| Param | Original file | Final file |
|---|---|---|
| Filename | modeM0/AS1A05_075T10_9000002842cztM0_level2.fits | modeM0/AS1A05_075T10_9000002842cztM0_level2_quad_clean.evt |
| Size (bytes) | 103,207,680 | 61,508,160 |
| Size | 98.4 MB | 58.7 MB |
| Events in quadrant A | 643,066 | 311,023 |
| Events in quadrant B | 625,140 | 317,156 |
| Events in quadrant C | 648,442 | 310,800 |
| Events in quadrant D | 570,212 | 283,426 |
| Mode M9 | |||
|---|---|---|---|
| Quadrant | BADHDUFLAG | Total packets | Discarded packets |
| A | 0 | 26 | 0 |
| B | 0 | 26 | 0 |
| C | 0 | 26 | 0 |
| D | 0 | 26 | 0 |
| Mode SS | |||
|---|---|---|---|
| Quadrant | BADHDUFLAG | Total packets | Discarded packets |
| A | 0 | 186 | 0 |
| B | 0 | 186 | 0 |
| C | 0 | 186 | 0 |
| D | 0 | 186 | 0 |
| Mode M0 | |||
|---|---|---|---|
| Quadrant | BADHDUFLAG | Total packets | Discarded packets |
| A | 0 | 20149 | 0 |
| B | 0 | 20320 | 0 |
| C | 0 | 22503 | 0 |
| D | 0 | 22403 | 0 |
| Quadrant | Total seconds | Saturated seconds | Saturation percentage |
|---|---|---|---|
| A | 9221 | 137 | 1.485739% |
| B | 9221 | 161 | 1.746015% |
| C | 9221 | 242 | 2.624444% |
| D | 9221 | 160 | 1.735170% |
Noise dominated data is calculated using 1-second bins in cleaned event files. If a bin has >2000 counts, and if more than 50% of those come from <1% of pixels, then it is considered to be noise-dominated and hence unusable.
| Quadrant | # 1 sec bins | Bins with >0 counts | Bins with >2000 counts | High rate bins dominated by noise | Noise dominated (total time) | Noise dominated (detector-on time) | Marked lightcurve |
|---|---|---|---|---|---|---|---|
| A | 11771 | 9220 | 0 | 0 | 0.00% | 0.00% |  |
| B | 11771 | 9220 | 0 | 0 | 0.00% | 0.00% |  |
| C | 11771 | 9219 | 0 | 0 | 0.00% | 0.00% |  |
| D | 11771 | 9220 | 0 | 0 | 0.00% | 0.00% |  |
Top three noisy pixels from each quadrant. If the there are fewer than three noisy pixels in the level2.evt file, extra rows are filled as -1
| Pixel properties | Quadrant properties | ||||||
|---|---|---|---|---|---|---|---|
| Quadrant | DetID | PixID | Counts | Sigma | Mean | Median | Sigma |
| A | 0 | 29 | 608 | 10.54 | 167 | 158 | 42.7 |
| A | 9 | 19 | 484 | 7.63 | 167 | 158 | 42.7 |
| A | 7 | 110 | 482 | 7.59 | 167 | 158 | 42.7 |
| B | 2 | 9 | 500 | 10.13 | 165 | 159 | 33.7 |
| B | 3 | 17 | 417 | 7.67 | 165 | 159 | 33.7 |
| B | 5 | 128 | 415 | 7.61 | 165 | 159 | 33.7 |
| C | 1 | 81 | 487 | 7.29 | 171 | 163 | 44.5 |
| C | 3 | 126 | 474 | 7.0 | 171 | 163 | 44.5 |
| C | 1 | 80 | 470 | 6.91 | 171 | 163 | 44.5 |
| D | 10 | 190 | 445 | 6.84 | 162 | 149 | 43.3 |
| D | 4 | 246 | 431 | 6.52 | 162 | 149 | 43.3 |
| D | 3 | 14 | 430 | 6.49 | 162 | 149 | 43.3 |
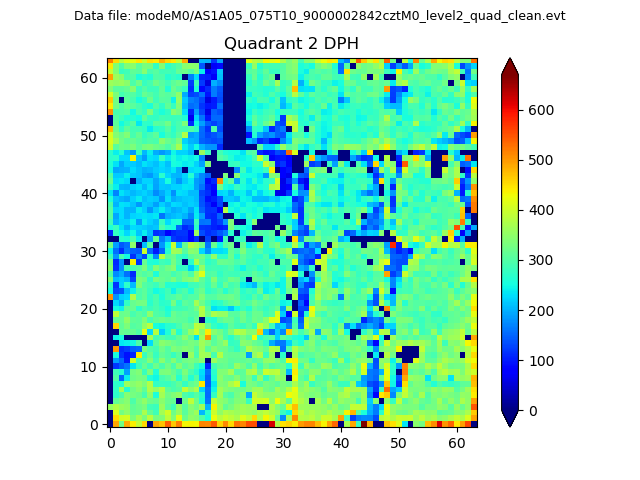
Histogram calculated using DETX and DETY for each event in the final _common_clean file
| Quadrant A |  |
 |
Quadrant B |
|---|---|---|---|
| Quadrant D | 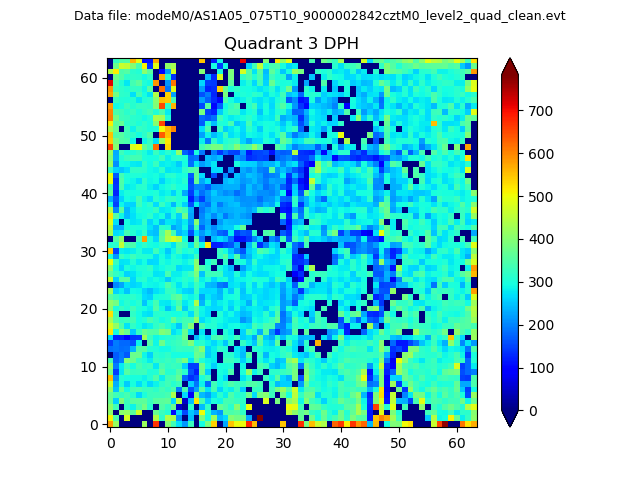 |
 |
Quadrant C |
| Plot type | Count rate plots | Images |
|---|---|---|
| Comparison with Poisson distribution Blue bars denote a histogram of data divided into 1 sec bins. Red curve is a Poisson curve with rate = median count rate of data. |
 |
 |
| Quadrant-wise count rates Data is divided into 100 sec bins |
 |
|
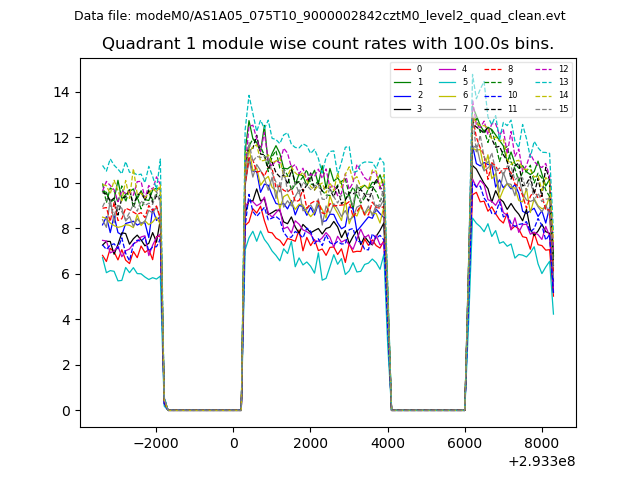
| Module-wise count rates for Quadrant A Data is divided into 100 sec bins |
 |
 |
| Module-wise count rates for Quadrant B Data is divided into 100 sec bins |
 |
 |
| Module-wise count rates for Quadrant C Data is divided into 100 sec bins |
 |
 |
| Module-wise count rates for Quadrant D Data is divided into 100 sec bins |
 |
 |
| Parameter | Plot |
|---|---|
| CZT HV Monitor |  |
| D_VDD | 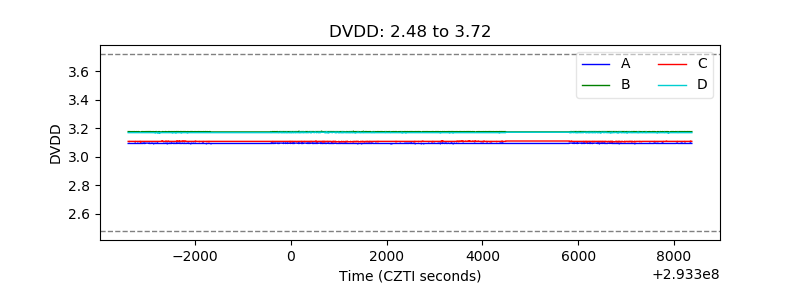 |
| Temperature 1 |  |
| Veto HV Monitor |  |
| Veto LLD |  |
| Alpha Counter |  |
| _CPM_Rate |  |
| CZT Counter |  |
| +2.5 Volts monitor | 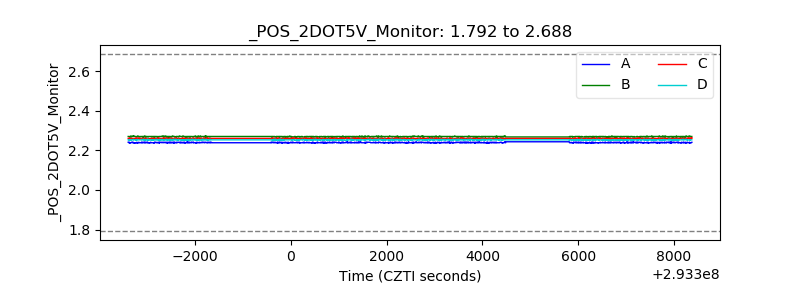 |
| +5 Volts monitor |  |
| _ROLL_ROT |  |
| _Roll_DEC |  |
| _Roll_RA |  |
| Veto Counter |  |