| Param | Original file | Final file |
|---|---|---|
| Filename | modeM0/AS1A05_075T10_9000002842_19220cztM0_level2.evt | modeM0/AS1A05_075T10_9000002842_19220cztM0_level2_quad_clean.evt |
| Size (bytes) | 235,641,600 | 48,222,720 |
| Size | 224.7 MB | 46.0 MB |
| Events in quadrant A | 1,661,846 | 311,318 |
| Events in quadrant B | 1,672,467 | 317,740 |
| Events in quadrant C | 1,947,863 | 308,455 |
| Events in quadrant D | 1,643,966 | 303,909 |
| Mode M9 | |||
|---|---|---|---|
| Quadrant | BADHDUFLAG | Total packets | Discarded packets |
| A | 0 | 12 | 0 |
| B | 0 | 12 | 0 |
| C | 0 | 12 | 0 |
| D | 0 | 12 | 0 |
| Mode SS | |||
|---|---|---|---|
| Quadrant | BADHDUFLAG | Total packets | Discarded packets |
| A | 0 | 64 | 0 |
| B | 0 | 64 | 0 |
| C | 0 | 64 | 0 |
| D | 0 | 64 | 0 |
| Mode M0 | |||
|---|---|---|---|
| Quadrant | BADHDUFLAG | Total packets | Discarded packets |
| A | 0 | 7007 | 1 |
| B | 0 | 7037 | 1 |
| C | 0 | 7792 | 1 |
| D | 0 | 6966 | 1 |
| Quadrant | Total seconds | Saturated seconds | Saturation percentage |
|---|---|---|---|
| A | 3067 | 81 | 2.641017% |
| B | 3067 | 87 | 2.836648% |
| C | 3067 | 122 | 3.977828% |
| D | 3067 | 70 | 2.282361% |
Noise dominated data is calculated using 1-second bins in cleaned event files. If a bin has >2000 counts, and if more than 50% of those come from <1% of pixels, then it is considered to be noise-dominated and hence unusable.
| Quadrant | # 1 sec bins | Bins with >0 counts | Bins with >2000 counts | High rate bins dominated by noise | Noise dominated (total time) | Noise dominated (detector-on time) | Marked lightcurve |
|---|---|---|---|---|---|---|---|
| A | 4297 | 3067 | 1 | 1 | 0.02% | 0.03% | 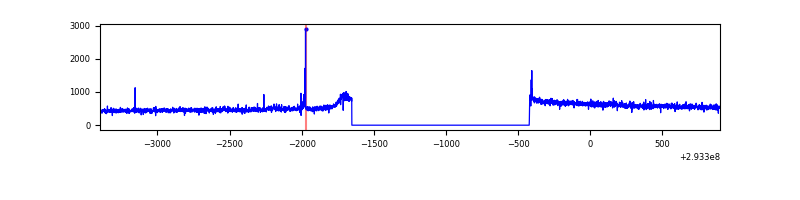 |
| B | 4297 | 3067 | 0 | 0 | 0.00% | 0.00% | 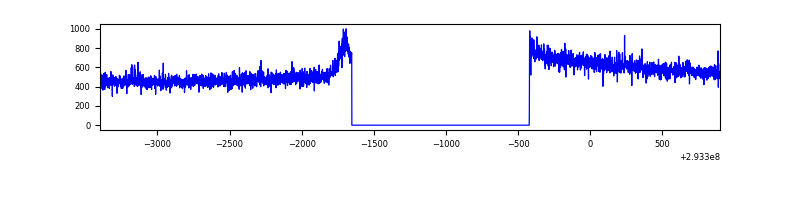 |
| C | 4297 | 3067 | 0 | 0 | 0.00% | 0.00% | 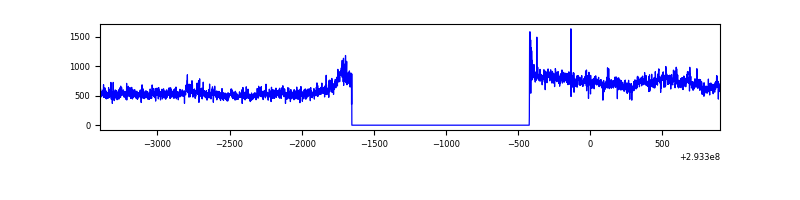 |
| D | 4297 | 3067 | 6 | 6 | 0.14% | 0.20% | 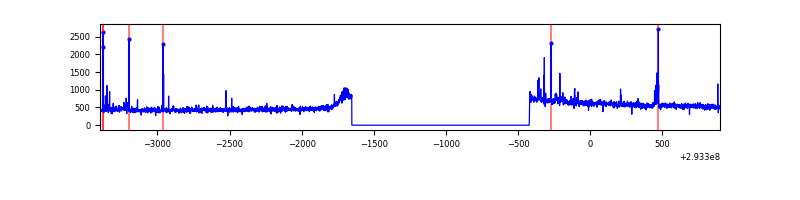 |
Top three noisy pixels from each quadrant. If the there are fewer than three noisy pixels in the level2.evt file, extra rows are filled as -1
| Pixel properties | Quadrant properties | ||||||
|---|---|---|---|---|---|---|---|
| Quadrant | DetID | PixID | Counts | Sigma | Mean | Median | Sigma |
| A | 9 | 143 | 18277 | 209.66 | 425 | 417 | 85.2 |
| A | 11 | 29 | 5883 | 64.16 | 425 | 417 | 85.2 |
| A | 0 | 226 | 3674 | 38.23 | 425 | 417 | 85.2 |
| B | 12 | 111 | 9393 | 109.72 | 426 | 415 | 81.8 |
| B | 11 | 111 | 8446 | 98.15 | 426 | 415 | 81.8 |
| B | 14 | 111 | 7289 | 84.01 | 426 | 415 | 81.8 |
| C | 3 | 233 | 273460 | 2842.24 | 412 | 416 | 96.1 |
| C | 14 | 238 | 63536 | 657.05 | 412 | 416 | 96.1 |
| C | 13 | 61 | 2926 | 26.13 | 412 | 416 | 96.1 |
| D | 11 | 176 | 49306 | 483.49 | 420 | 408 | 101.1 |
| D | 2 | 234 | 12893 | 123.45 | 420 | 408 | 101.1 |
| D | 5 | 222 | 6525 | 60.48 | 420 | 408 | 101.1 |
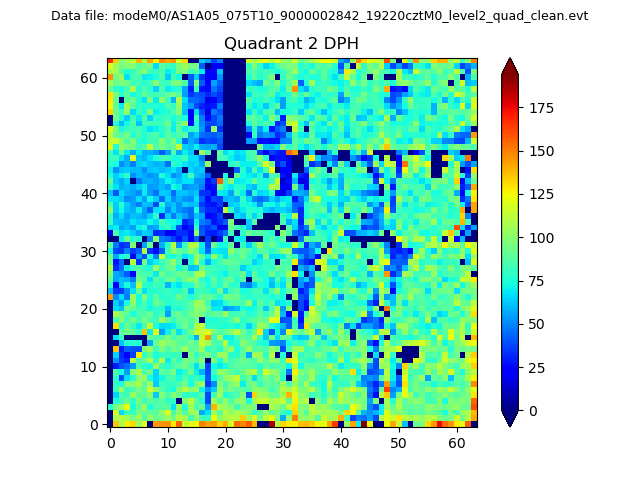
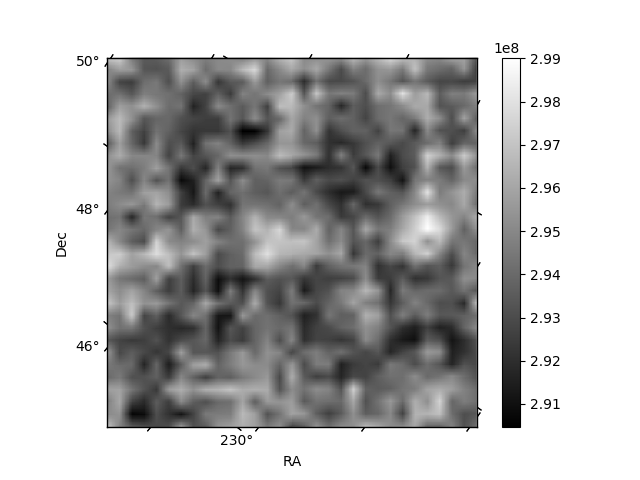
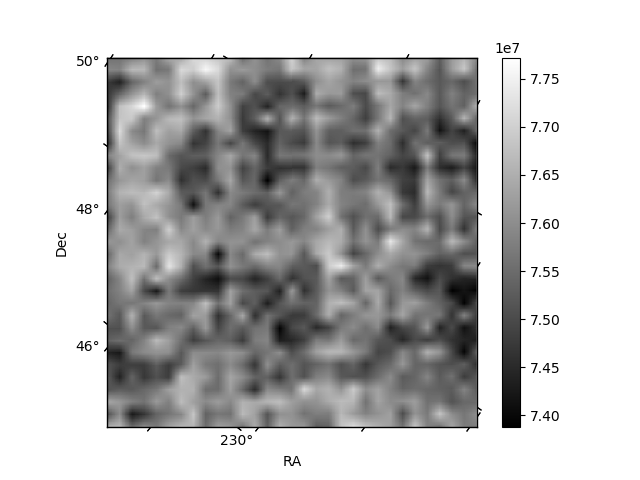
Histogram calculated using DETX and DETY for each event in the final _common_clean file
| Quadrant A | 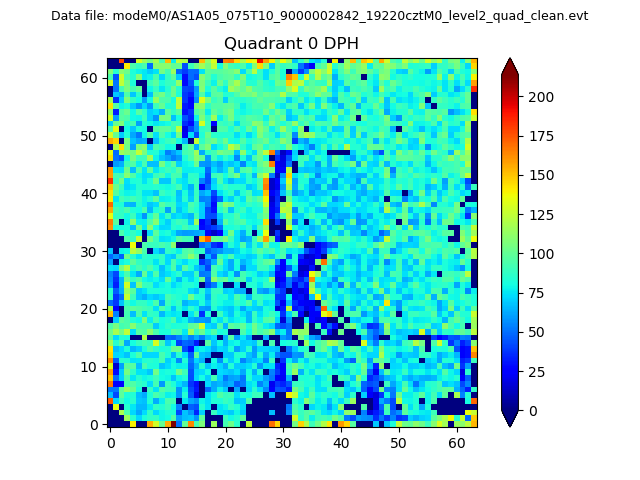 |
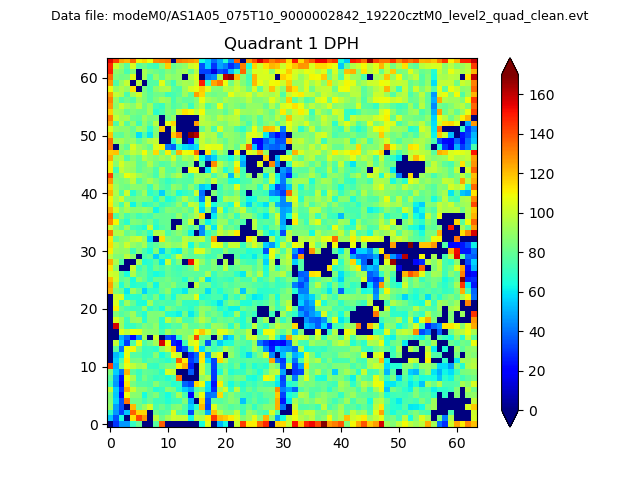 |
Quadrant B |
|---|---|---|---|
| Quadrant D | 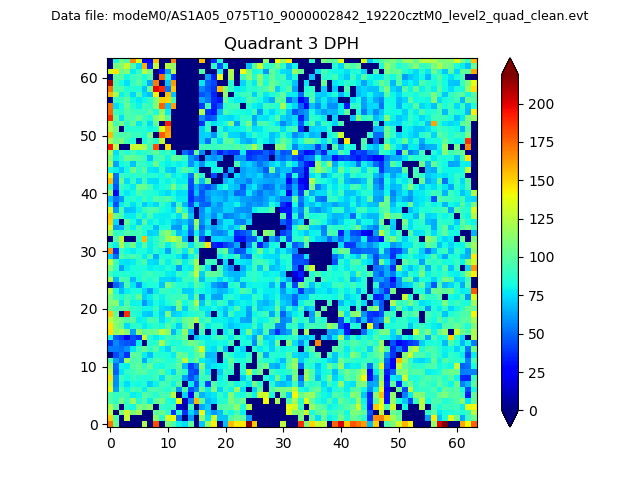 |
 |
Quadrant C |
| Plot type | Count rate plots | Images |
|---|---|---|
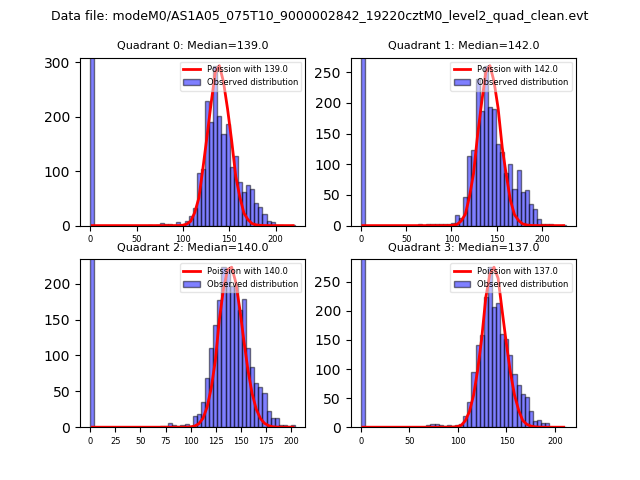
| Comparison with Poisson distribution Blue bars denote a histogram of data divided into 1 sec bins. Red curve is a Poisson curve with rate = median count rate of data. |
 |
 |
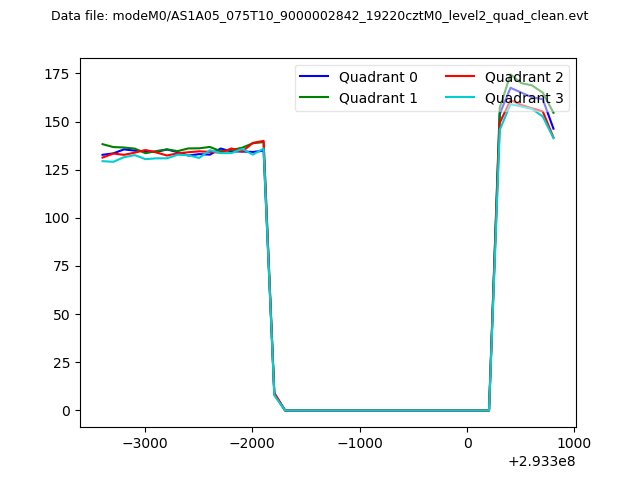
| Quadrant-wise count rates Data is divided into 100 sec bins |
 |
|
| Module-wise count rates for Quadrant A Data is divided into 100 sec bins |
 |
 |
| Module-wise count rates for Quadrant B Data is divided into 100 sec bins |
 |
 |
| Module-wise count rates for Quadrant C Data is divided into 100 sec bins |
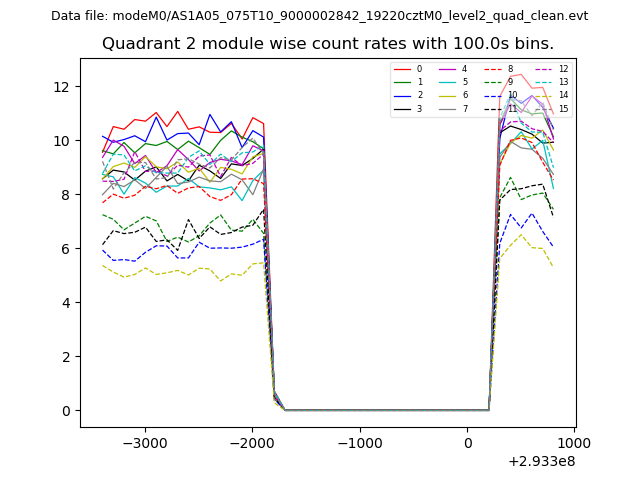 |
 |
| Module-wise count rates for Quadrant D Data is divided into 100 sec bins |
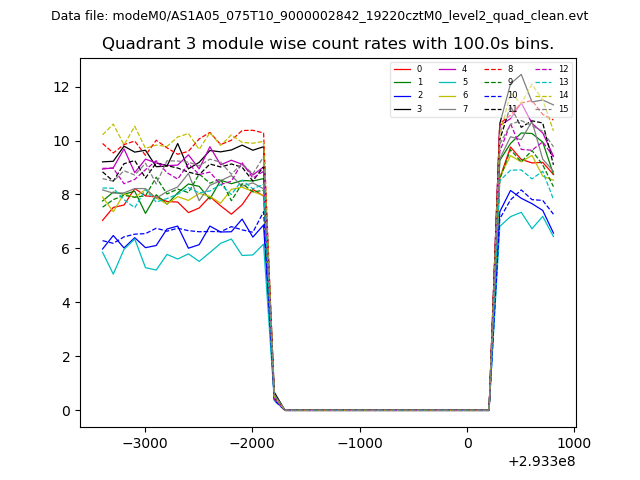 |
 |
| Parameter | Plot |
|---|---|
| CZT HV Monitor | 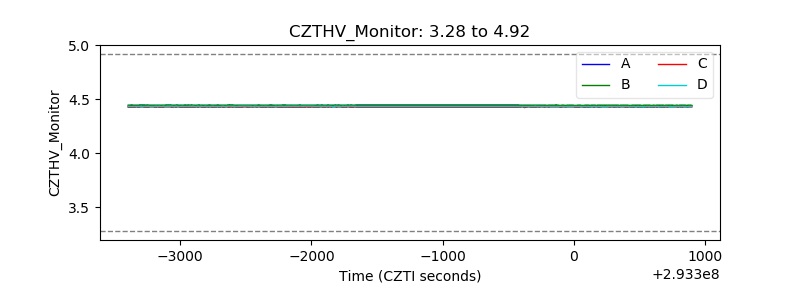 |
| D_VDD | 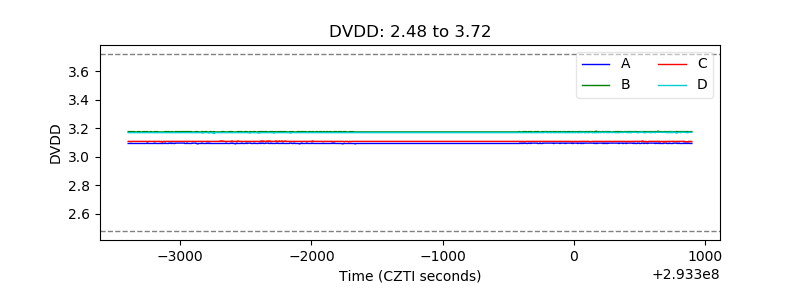 |
| Temperature 1 | 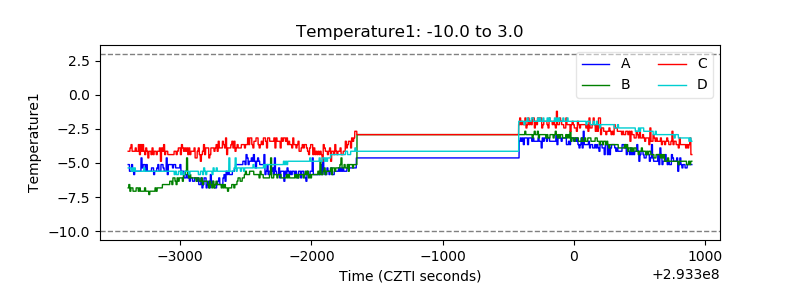 |
| Veto HV Monitor | 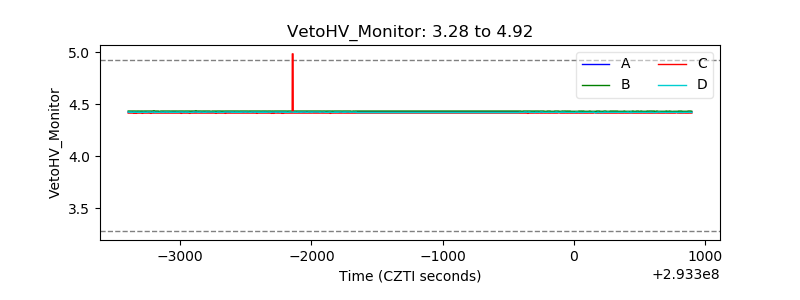 |
| Veto LLD | 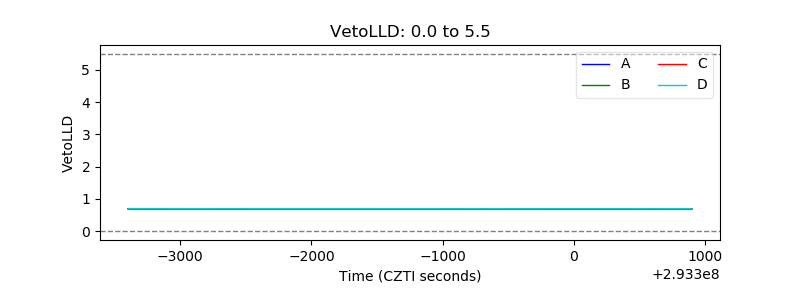 |
| Alpha Counter | 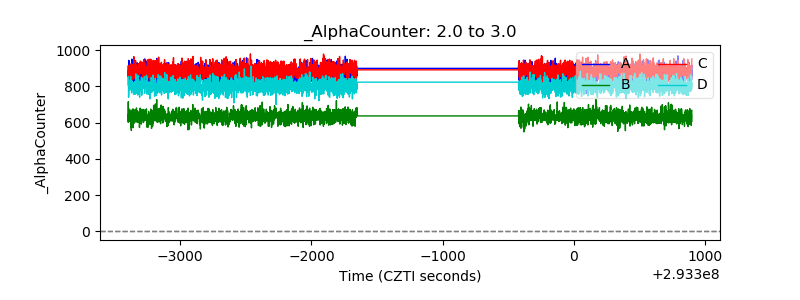 |
| _CPM_Rate | 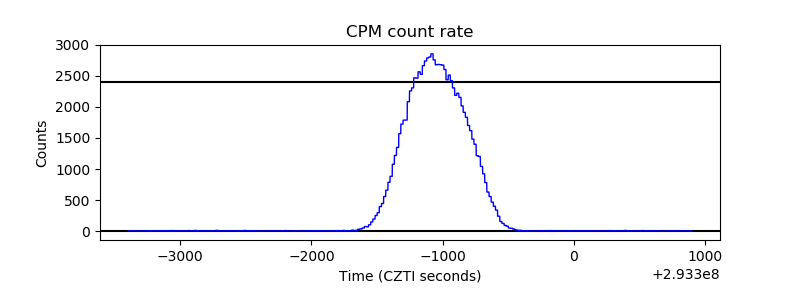 |
| CZT Counter | 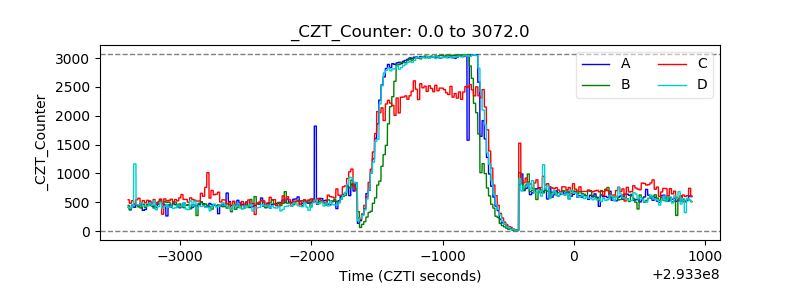 |
| +2.5 Volts monitor | 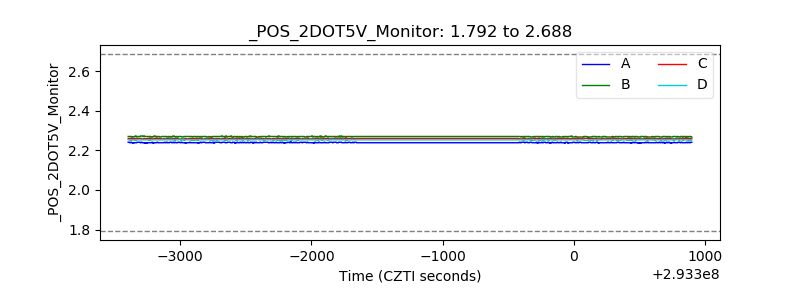 |
| +5 Volts monitor |  |
| _ROLL_ROT | 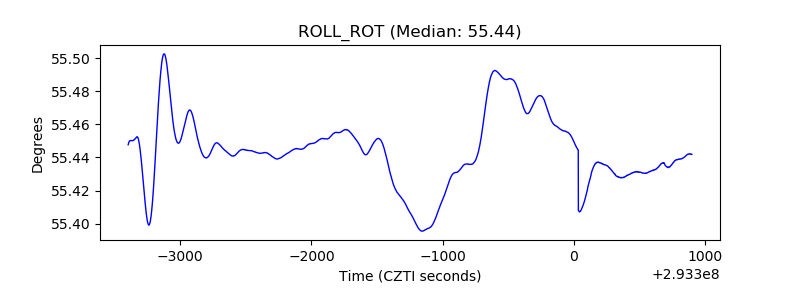 |
| _Roll_DEC | 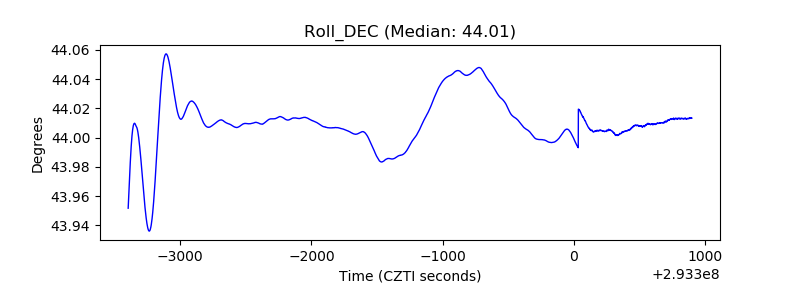 |
| _Roll_RA | 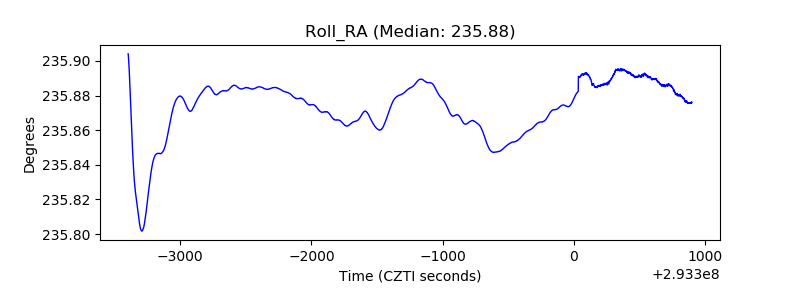 |
| Veto Counter | 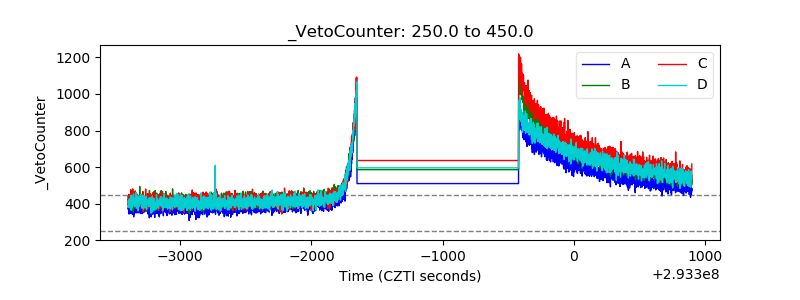 |