| Param | Original file | Final file |
|---|---|---|
| Filename | modeM0/AS1A05_075T10_9000002842_19221cztM0_level2.evt | modeM0/AS1A05_075T10_9000002842_19221cztM0_level2_quad_clean.evt |
| Size (bytes) | 609,848,640 | 141,105,600 |
| Size | 581.6 MB | 134.6 MB |
| Events in quadrant A | 4,199,847 | 928,033 |
| Events in quadrant B | 4,283,783 | 953,482 |
| Events in quadrant C | 4,920,474 | 929,462 |
| Events in quadrant D | 4,521,327 | 905,232 |
| Mode M9 | |||
|---|---|---|---|
| Quadrant | BADHDUFLAG | Total packets | Discarded packets |
| A | 0 | 26 | 0 |
| B | 0 | 26 | 0 |
| C | 0 | 26 | 0 |
| D | 0 | 26 | 0 |
| Mode SS | |||
|---|---|---|---|
| Quadrant | BADHDUFLAG | Total packets | Discarded packets |
| A | 0 | 162 | 0 |
| B | 0 | 162 | 0 |
| C | 0 | 162 | 0 |
| D | 0 | 162 | 0 |
| Mode M0 | |||
|---|---|---|---|
| Quadrant | BADHDUFLAG | Total packets | Discarded packets |
| A | 0 | 17737 | 3 |
| B | 0 | 17941 | 2 |
| C | 0 | 19983 | 2 |
| D | 0 | 18817 | 2 |
| Quadrant | Total seconds | Saturated seconds | Saturation percentage |
|---|---|---|---|
| A | 8034 | 135 | 1.680358% |
| B | 8034 | 161 | 2.003983% |
| C | 8034 | 239 | 2.974857% |
| D | 8034 | 157 | 1.954195% |
Noise dominated data is calculated using 1-second bins in cleaned event files. If a bin has >2000 counts, and if more than 50% of those come from <1% of pixels, then it is considered to be noise-dominated and hence unusable.
| Quadrant | # 1 sec bins | Bins with >0 counts | Bins with >2000 counts | High rate bins dominated by noise | Noise dominated (total time) | Noise dominated (detector-on time) | Marked lightcurve |
|---|---|---|---|---|---|---|---|
| A | 10584 | 8035 | 1 | 1 | 0.01% | 0.01% | 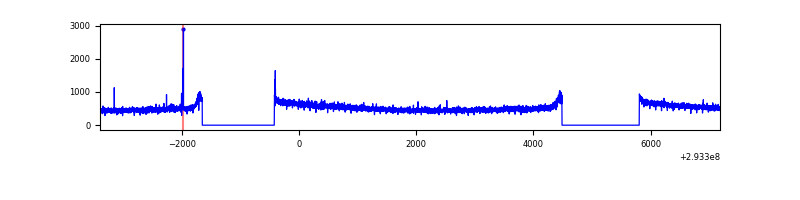 |
| B | 10584 | 8035 | 0 | 0 | 0.00% | 0.00% | 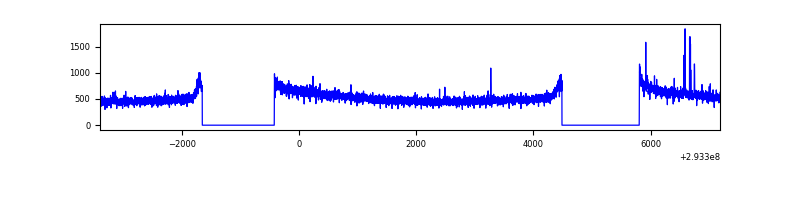 |
| C | 10584 | 8034 | 1 | 1 | 0.01% | 0.01% | 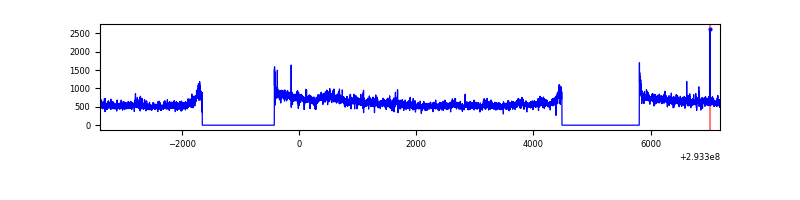 |
| D | 10584 | 8035 | 50 | 50 | 0.47% | 0.62% | 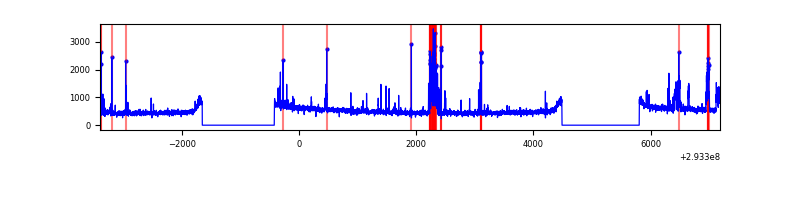 |
Top three noisy pixels from each quadrant. If the there are fewer than three noisy pixels in the level2.evt file, extra rows are filled as -1
| Pixel properties | Quadrant properties | ||||||
|---|---|---|---|---|---|---|---|
| Quadrant | DetID | PixID | Counts | Sigma | Mean | Median | Sigma |
| A | 11 | 29 | 30457 | 137.76 | 1078 | 1059 | 213.4 |
| A | 9 | 143 | 20156 | 89.49 | 1078 | 1059 | 213.4 |
| A | 13 | 254 | 10075 | 42.25 | 1078 | 1059 | 213.4 |
| B | 3 | 64 | 29837 | 143.02 | 1083 | 1058 | 201.2 |
| B | 12 | 111 | 23641 | 112.23 | 1083 | 1058 | 201.2 |
| B | 11 | 111 | 20793 | 98.07 | 1083 | 1058 | 201.2 |
| C | 3 | 233 | 624619 | 2561.34 | 1059 | 1071 | 243.4 |
| C | 14 | 238 | 165097 | 673.77 | 1059 | 1071 | 243.4 |
| C | 13 | 61 | 7457 | 26.23 | 1059 | 1071 | 243.4 |
| D | 1 | 52 | 275809 | 1087.2 | 1069 | 1042 | 252.7 |
| D | 11 | 176 | 185673 | 730.55 | 1069 | 1042 | 252.7 |
| D | 2 | 234 | 36540 | 140.46 | 1069 | 1042 | 252.7 |
Histogram calculated using DETX and DETY for each event in the final _common_clean file
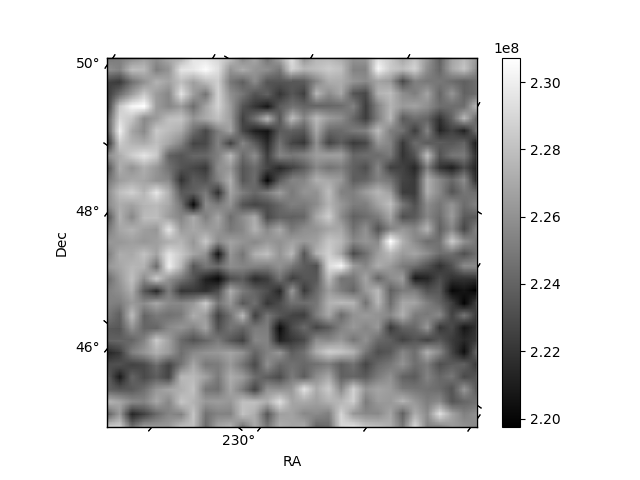
| Quadrant A | 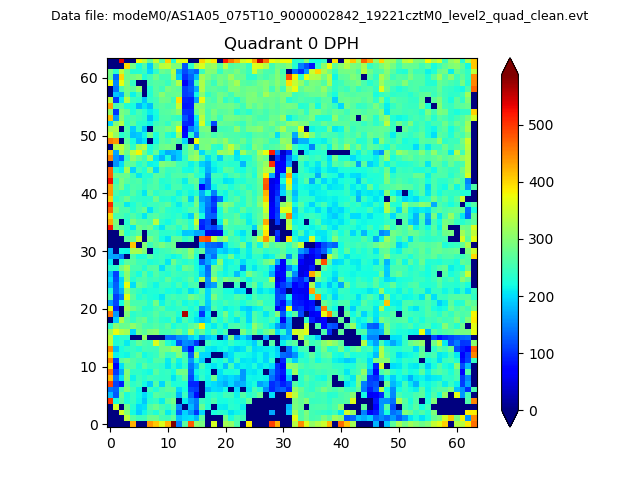 |
 |
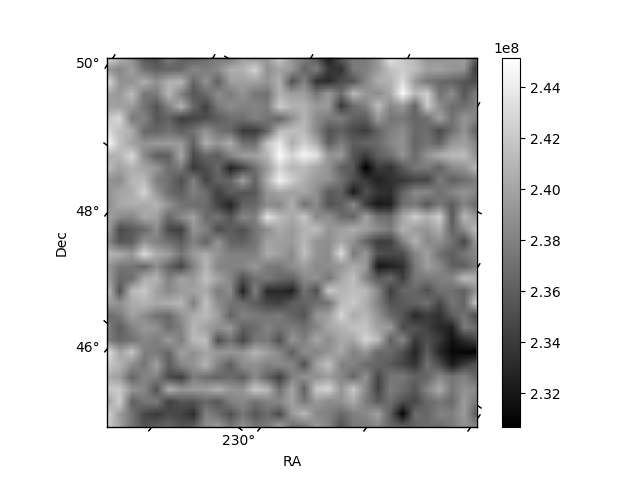
Quadrant B |
|---|---|---|---|
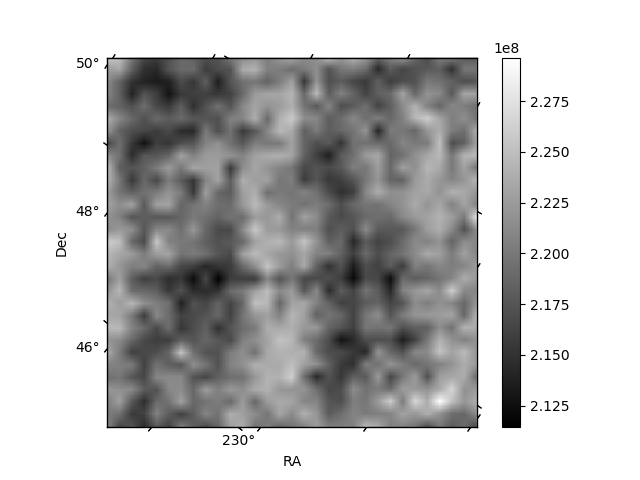
| Quadrant D | 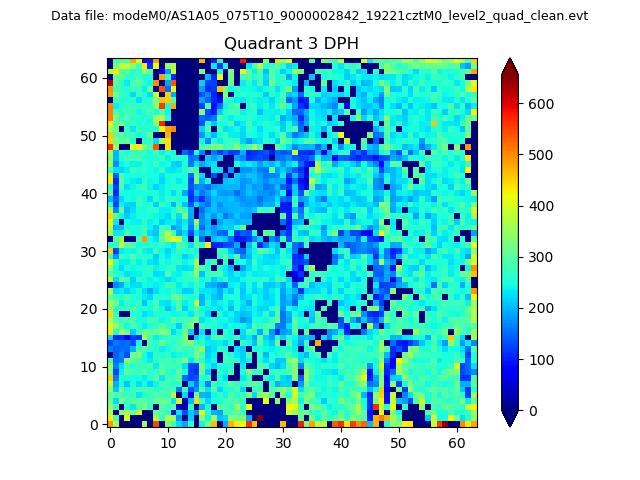 |
 |
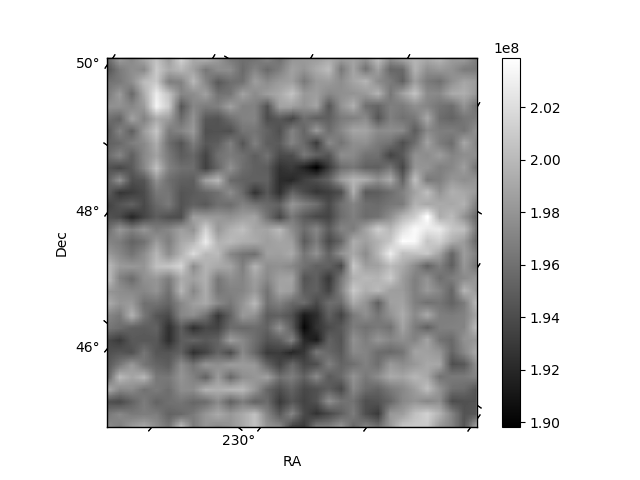
Quadrant C |
| Plot type | Count rate plots | Images |
|---|---|---|
| Comparison with Poisson distribution Blue bars denote a histogram of data divided into 1 sec bins. Red curve is a Poisson curve with rate = median count rate of data. |
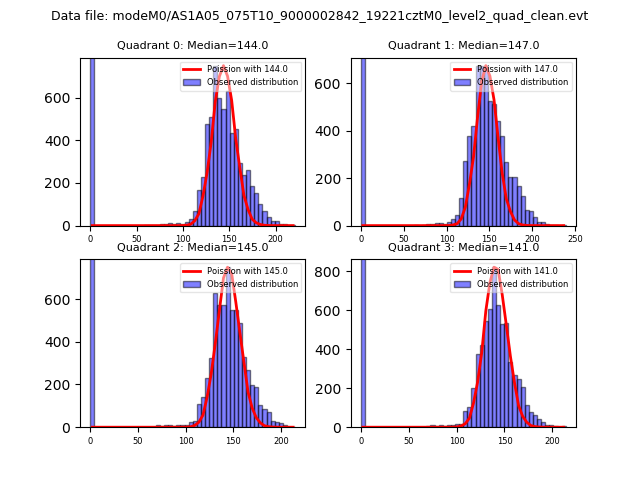 |
 |
| Quadrant-wise count rates Data is divided into 100 sec bins |
 |
|
| Module-wise count rates for Quadrant A Data is divided into 100 sec bins |
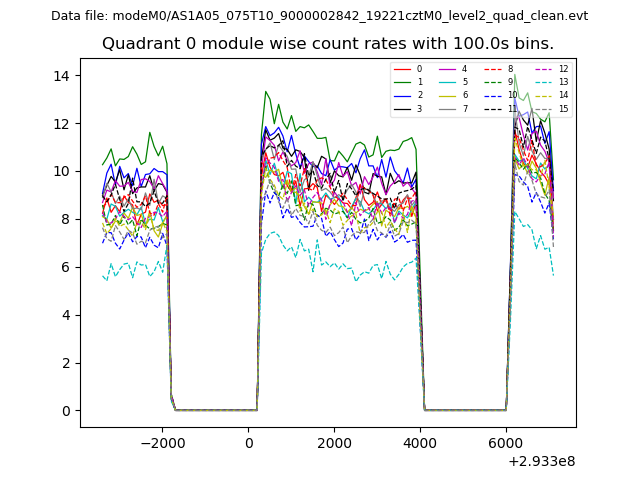 |
 |
| Module-wise count rates for Quadrant B Data is divided into 100 sec bins |
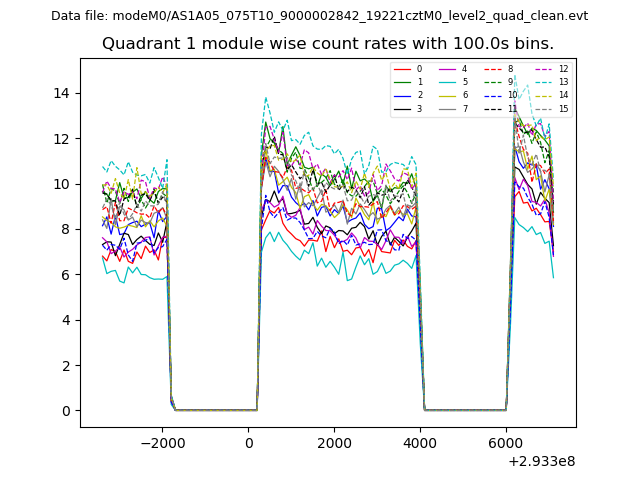 |
 |
| Module-wise count rates for Quadrant C Data is divided into 100 sec bins |
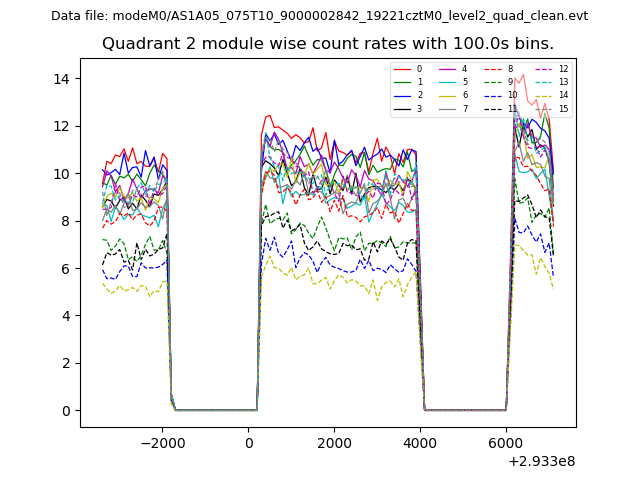 |
 |
| Module-wise count rates for Quadrant D Data is divided into 100 sec bins |
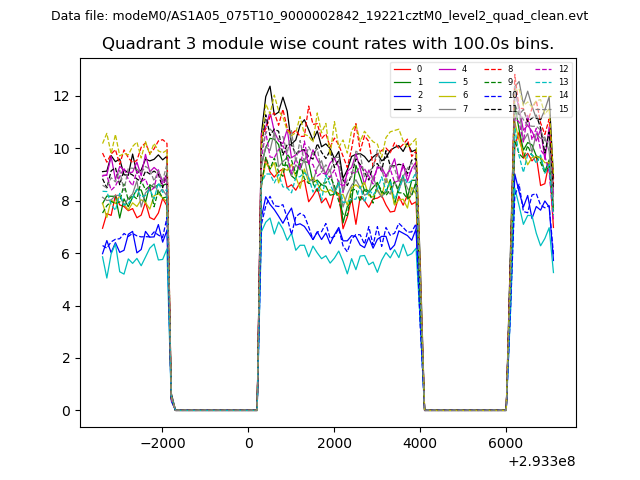 |
 |
| Parameter | Plot |
|---|---|
| CZT HV Monitor | 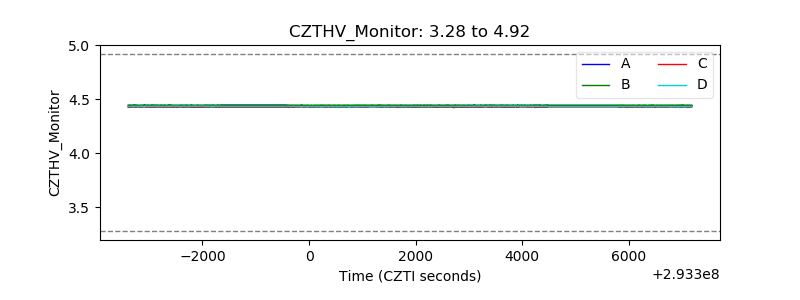 |
| D_VDD | 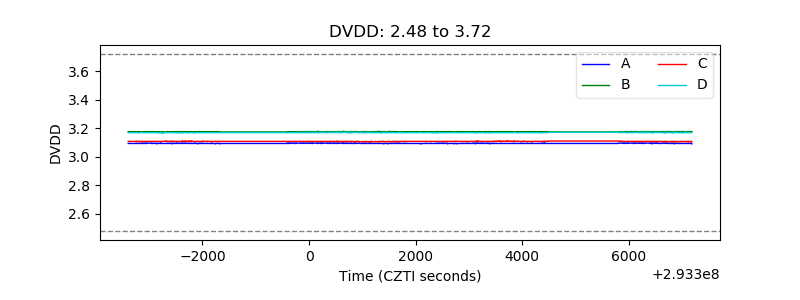 |
| Temperature 1 | 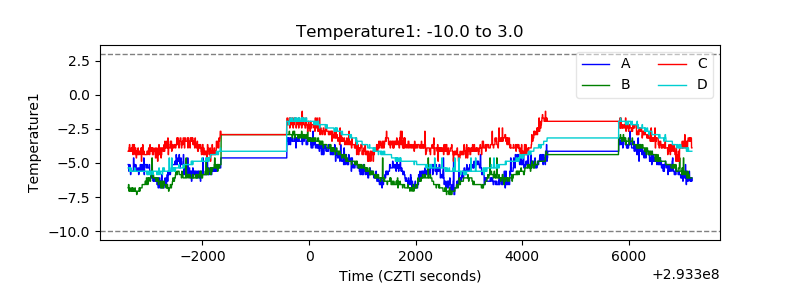 |
| Veto HV Monitor | 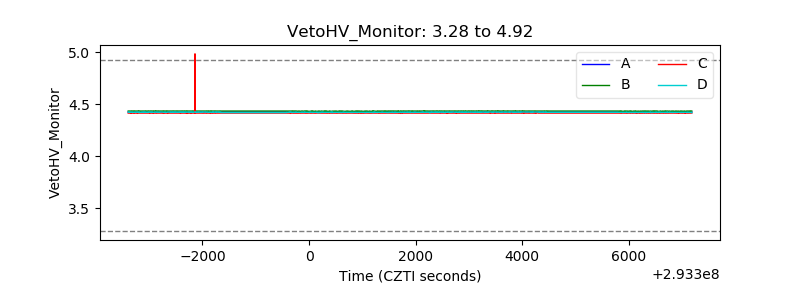 |
| Veto LLD | 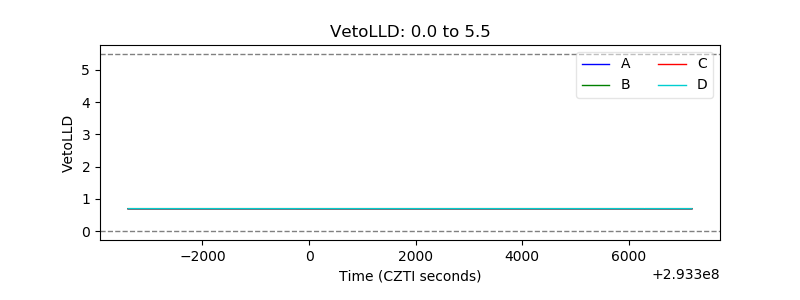 |
| Alpha Counter | 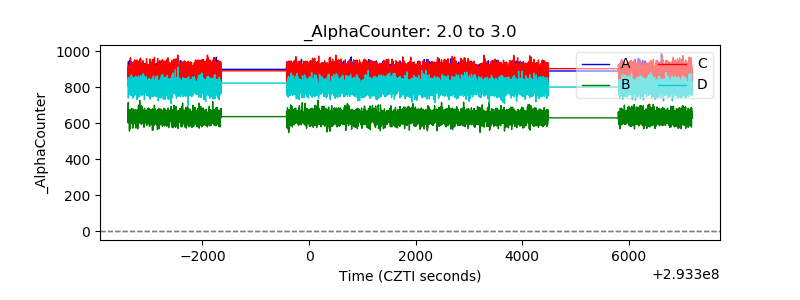 |
| _CPM_Rate | 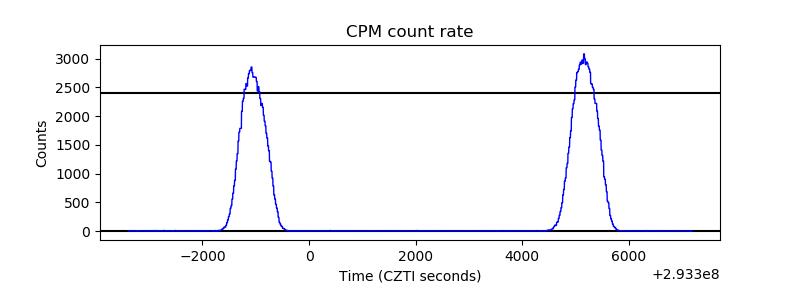 |
| CZT Counter |  |
| +2.5 Volts monitor |  |
| +5 Volts monitor |  |
| _ROLL_ROT | 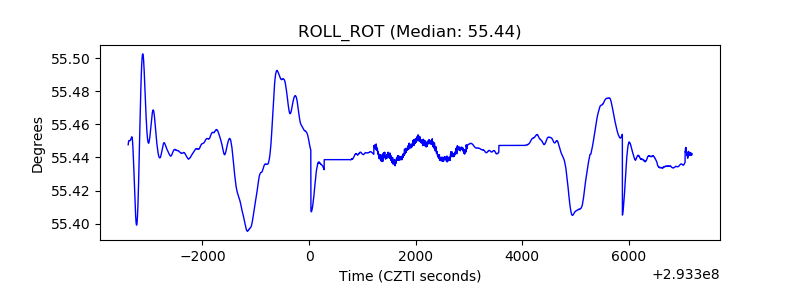 |
| _Roll_DEC | 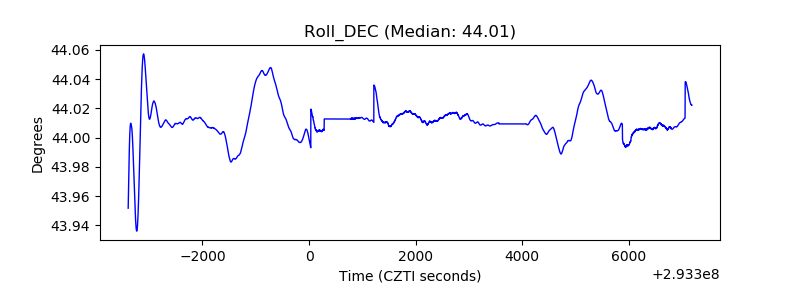 |
| _Roll_RA | 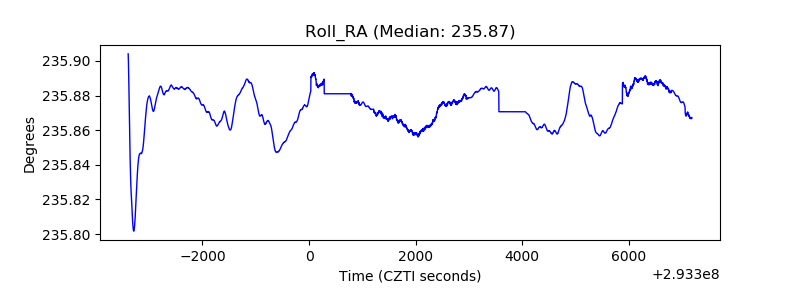 |
| Veto Counter | 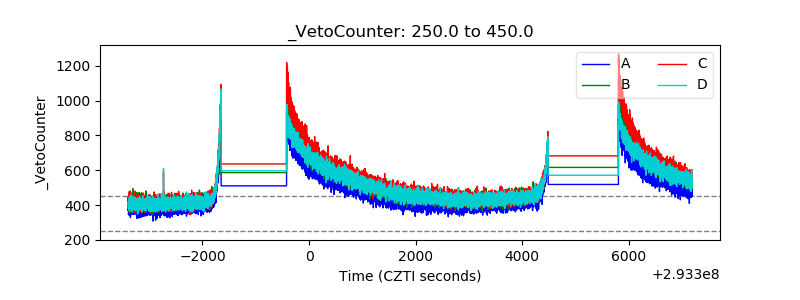 |