| Param | Original file | Final file |
|---|---|---|
| Filename | modeM0/AS1A05_075T10_9000002842_19222cztM0_level2.evt | modeM0/AS1A05_075T10_9000002842_19222cztM0_level2_quad_clean.evt |
| Size (bytes) | 248,757,120 | 52,536,960 |
| Size | 237.2 MB | 50.1 MB |
| Events in quadrant A | 1,624,950 | 343,568 |
| Events in quadrant B | 1,683,383 | 356,650 |
| Events in quadrant C | 1,853,936 | 346,771 |
| Events in quadrant D | 2,167,049 | 330,978 |
| Mode M9 | |||
|---|---|---|---|
| Quadrant | BADHDUFLAG | Total packets | Discarded packets |
| A | 0 | 14 | 0 |
| B | 0 | 14 | 0 |
| C | 0 | 14 | 0 |
| D | 0 | 14 | 0 |
| Mode SS | |||
|---|---|---|---|
| Quadrant | BADHDUFLAG | Total packets | Discarded packets |
| A | 0 | 60 | 0 |
| B | 0 | 60 | 0 |
| C | 0 | 60 | 0 |
| D | 0 | 60 | 0 |
| Mode M0 | |||
|---|---|---|---|
| Quadrant | BADHDUFLAG | Total packets | Discarded packets |
| A | 0 | 6799 | 1 |
| B | 0 | 6929 | 1 |
| C | 0 | 7648 | 1 |
| D | 0 | 8466 | 1 |
| Quadrant | Total seconds | Saturated seconds | Saturation percentage |
|---|---|---|---|
| A | 2990 | 55 | 1.839465% |
| B | 2991 | 72 | 2.407222% |
| C | 2991 | 110 | 3.677700% |
| D | 2991 | 56 | 1.872284% |
Noise dominated data is calculated using 1-second bins in cleaned event files. If a bin has >2000 counts, and if more than 50% of those come from <1% of pixels, then it is considered to be noise-dominated and hence unusable.
| Quadrant | # 1 sec bins | Bins with >0 counts | Bins with >2000 counts | High rate bins dominated by noise | Noise dominated (total time) | Noise dominated (detector-on time) | Marked lightcurve |
|---|---|---|---|---|---|---|---|
| A | 4310 | 2991 | 1 | 1 | 0.02% | 0.03% | 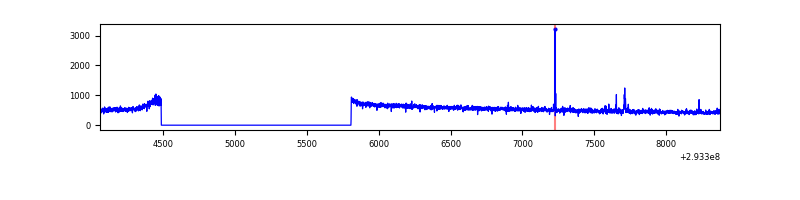 |
| B | 4311 | 2992 | 0 | 0 | 0.00% | 0.00% | 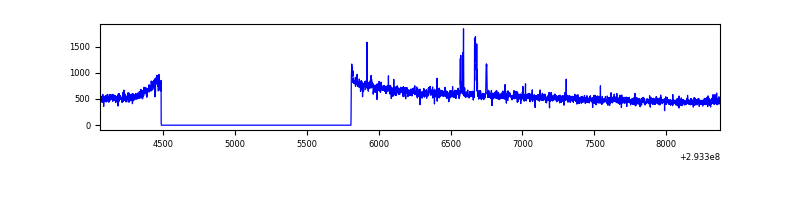 |
| C | 4311 | 2991 | 1 | 1 | 0.02% | 0.03% | 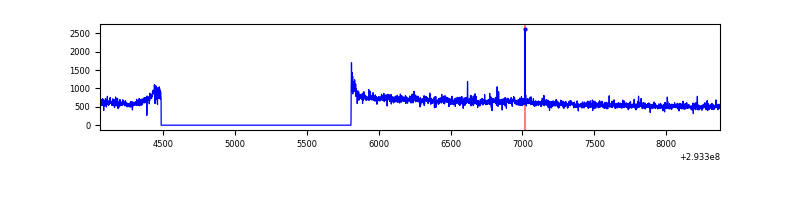 |
| D | 4311 | 2992 | 10 | 10 | 0.23% | 0.33% | 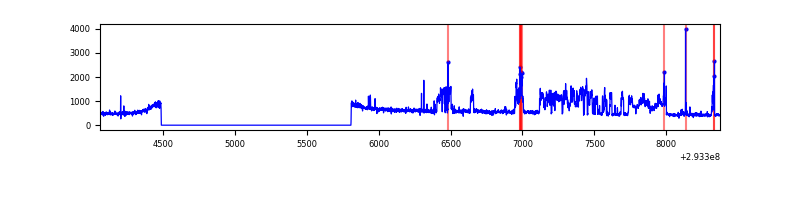 |
Top three noisy pixels from each quadrant. If the there are fewer than three noisy pixels in the level2.evt file, extra rows are filled as -1
| Pixel properties | Quadrant properties | ||||||
|---|---|---|---|---|---|---|---|
| Quadrant | DetID | PixID | Counts | Sigma | Mean | Median | Sigma |
| A | 9 | 143 | 16931 | 197.66 | 415 | 407 | 83.6 |
| A | 11 | 29 | 8810 | 100.51 | 415 | 407 | 83.6 |
| A | 13 | 254 | 3940 | 42.26 | 415 | 407 | 83.6 |
| B | 3 | 64 | 28167 | 354.28 | 420 | 411 | 78.3 |
| B | 12 | 111 | 8900 | 108.35 | 420 | 411 | 78.3 |
| B | 11 | 111 | 7779 | 94.04 | 420 | 411 | 78.3 |
| C | 3 | 233 | 172686 | 1782.12 | 414 | 418 | 96.7 |
| C | 14 | 238 | 64843 | 666.48 | 414 | 418 | 96.7 |
| C | 13 | 61 | 2833 | 24.98 | 414 | 418 | 96.7 |
| D | 1 | 52 | 486744 | 4846.75 | 418 | 406 | 100.3 |
| D | 11 | 176 | 90685 | 899.7 | 418 | 406 | 100.3 |
| D | 2 | 234 | 13404 | 129.54 | 418 | 406 | 100.3 |
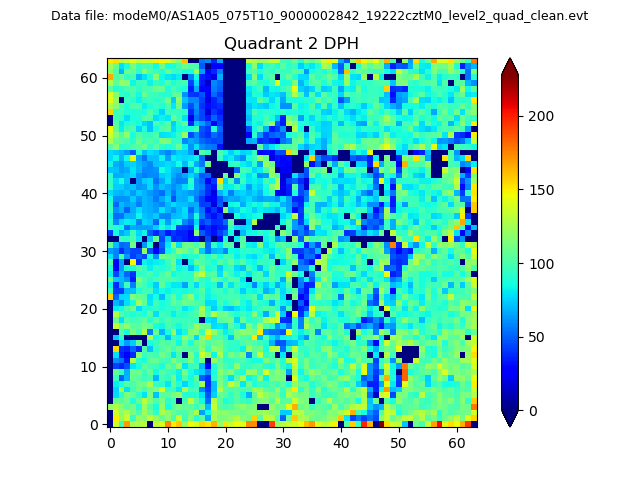
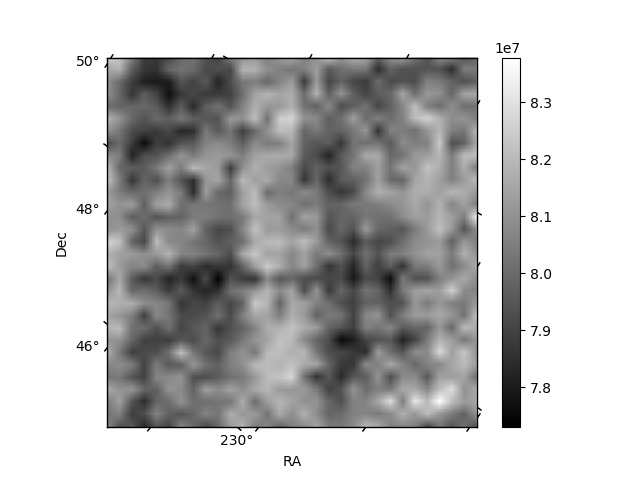
Histogram calculated using DETX and DETY for each event in the final _common_clean file
| Quadrant A | 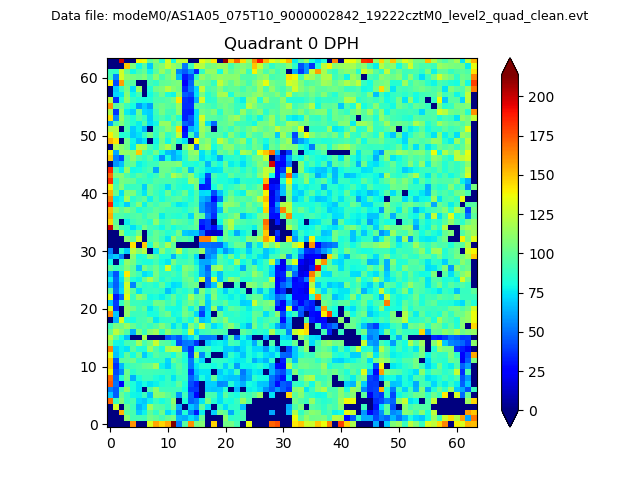 |
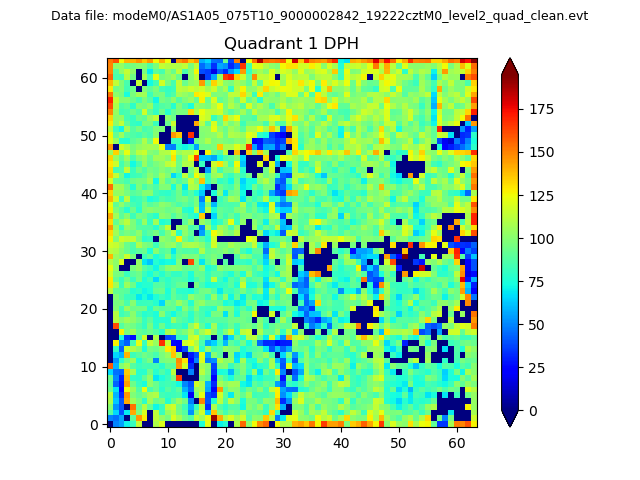 |
Quadrant B |
|---|---|---|---|
| Quadrant D | 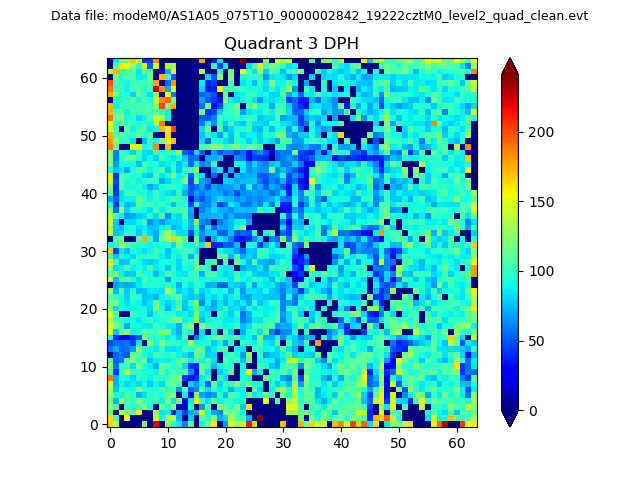 |
 |
Quadrant C |
| Plot type | Count rate plots | Images |
|---|---|---|
| Comparison with Poisson distribution Blue bars denote a histogram of data divided into 1 sec bins. Red curve is a Poisson curve with rate = median count rate of data. |
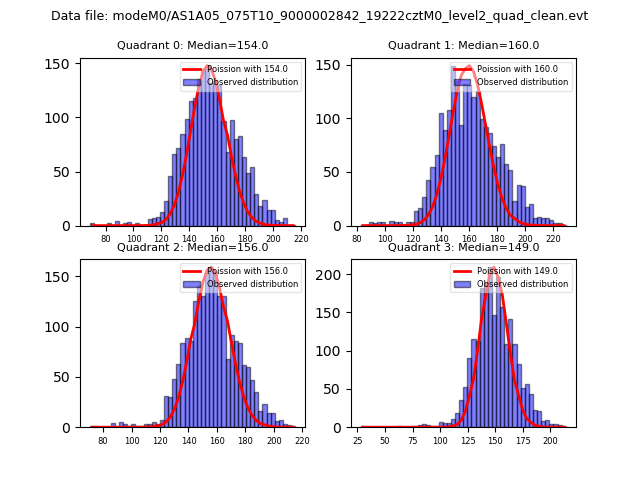 |
 |
| Quadrant-wise count rates Data is divided into 100 sec bins |
 |
|
| Module-wise count rates for Quadrant A Data is divided into 100 sec bins |
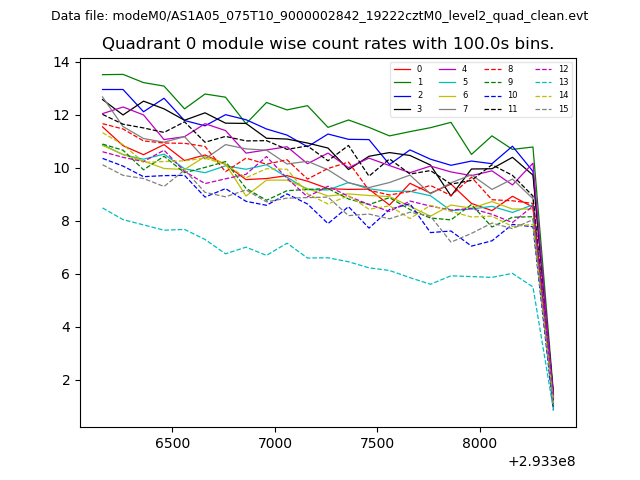 |
 |
| Module-wise count rates for Quadrant B Data is divided into 100 sec bins |
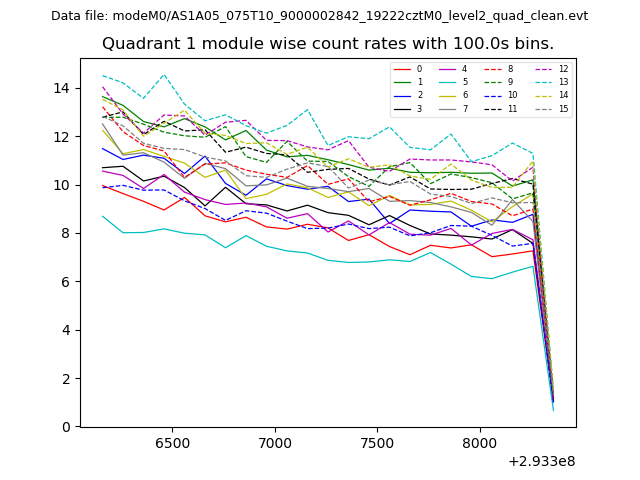 |
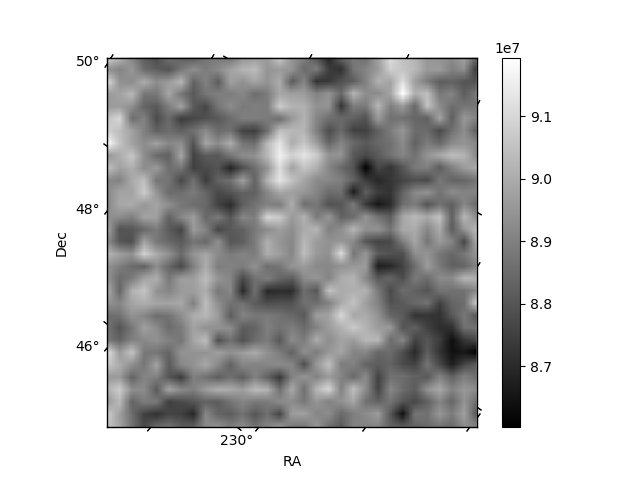 |
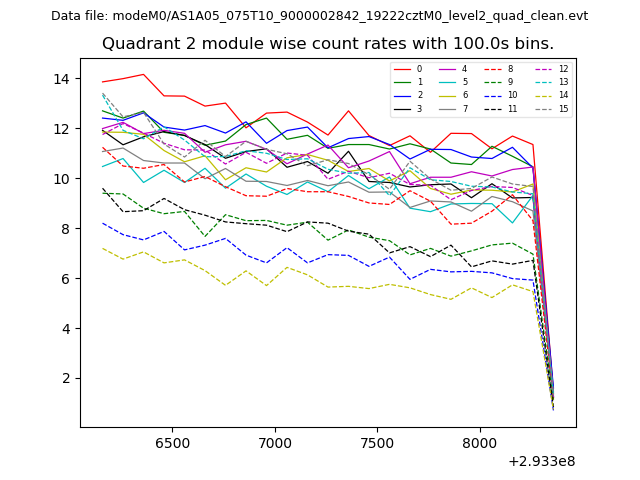
| Module-wise count rates for Quadrant C Data is divided into 100 sec bins |
 |
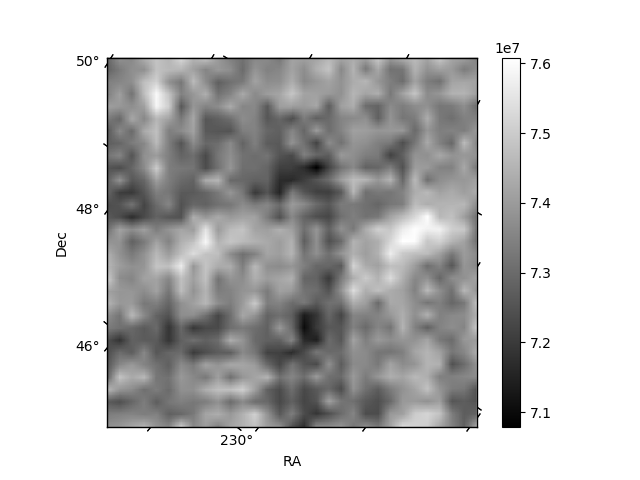 |
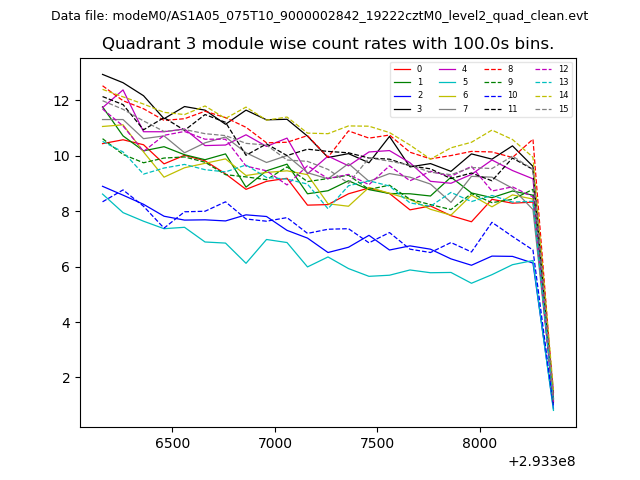
| Module-wise count rates for Quadrant D Data is divided into 100 sec bins |
 |
 |
| Parameter | Plot |
|---|---|
| CZT HV Monitor | 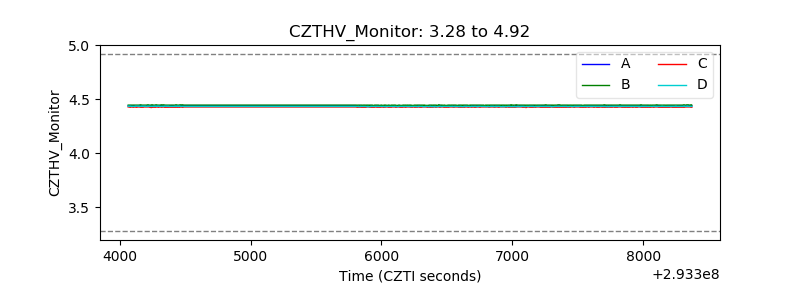 |
| D_VDD | 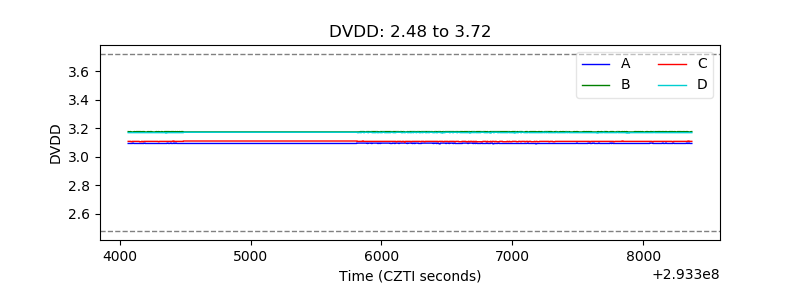 |
| Temperature 1 | 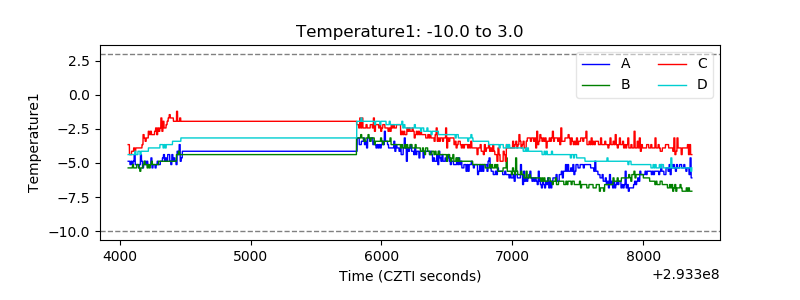 |
| Veto HV Monitor | 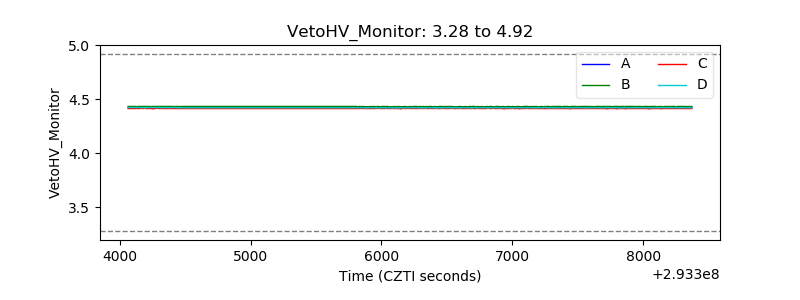 |
| Veto LLD | 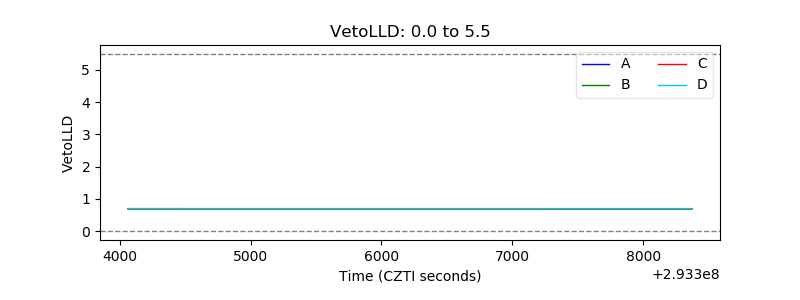 |
| Alpha Counter | 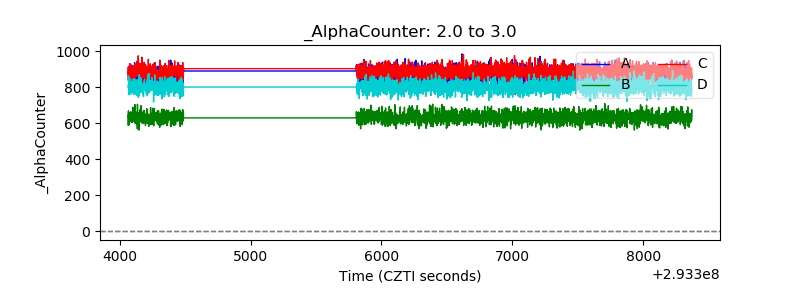 |
| _CPM_Rate | 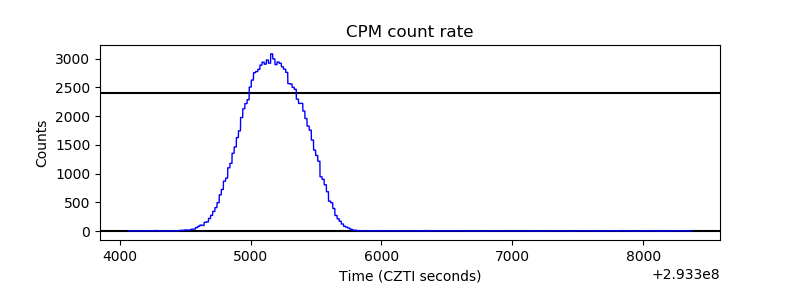 |
| CZT Counter | 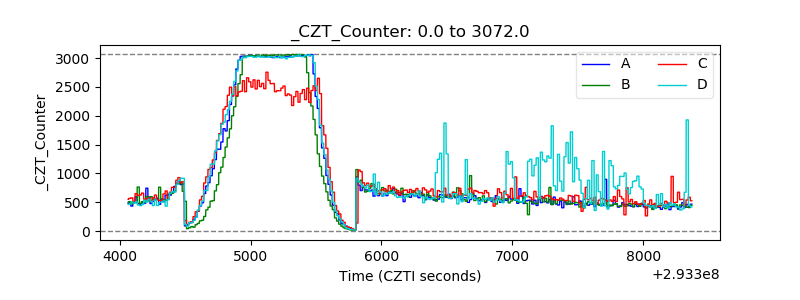 |
| +2.5 Volts monitor |  |
| +5 Volts monitor |  |
| _ROLL_ROT | 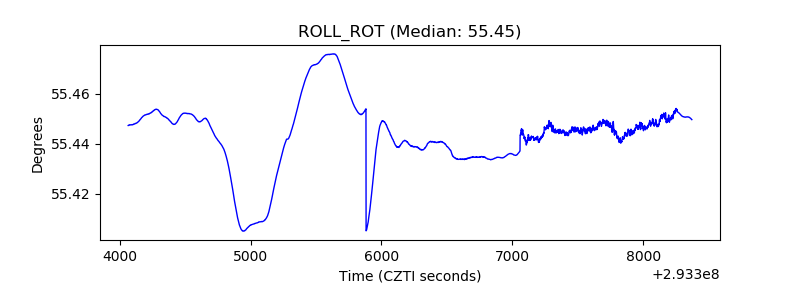 |
| _Roll_DEC | 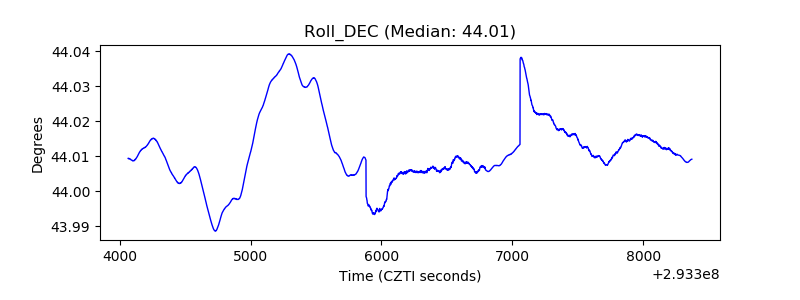 |
| _Roll_RA | 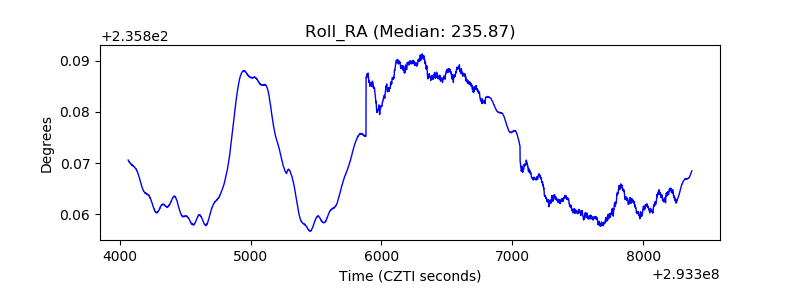 |
| Veto Counter | 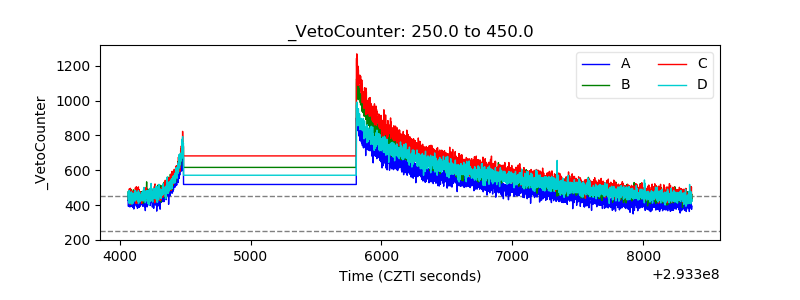 |