| Param | Original file | Final file |
|---|---|---|
| Filename | modeM0/AS1C04_001T01_9000002846_19231cztM0_level2.evt | modeM0/AS1C04_001T01_9000002846_19231cztM0_level2_quad_clean.evt |
| Size (bytes) | 152,884,800 | 17,907,840 |
| Size | 145.8 MB | 17.1 MB |
| Events in quadrant A | 1,032,761 | 99,299 |
| Events in quadrant B | 1,043,841 | 102,035 |
| Events in quadrant C | 1,209,401 | 96,789 |
| Events in quadrant D | 1,205,143 | 97,290 |
| Mode M9 | |||
|---|---|---|---|
| Quadrant | BADHDUFLAG | Total packets | Discarded packets |
| A | 0 | 9 | 0 |
| B | 0 | 9 | 0 |
| C | 0 | 9 | 0 |
| D | 0 | 9 | 0 |
| Mode SS | |||
|---|---|---|---|
| Quadrant | BADHDUFLAG | Total packets | Discarded packets |
| A | 0 | 42 | 0 |
| B | 0 | 42 | 0 |
| C | 0 | 42 | 0 |
| D | 0 | 42 | 0 |
| Mode M0 | |||
|---|---|---|---|
| Quadrant | BADHDUFLAG | Total packets | Discarded packets |
| A | 0 | 4223 | 1 |
| B | 0 | 4252 | 1 |
| C | 0 | 4915 | 1 |
| D | 0 | 4863 | 1 |
| Quadrant | Total seconds | Saturated seconds | Saturation percentage |
|---|---|---|---|
| A | 2011 | 55 | 2.734958% |
| B | 2011 | 64 | 3.182496% |
| C | 2011 | 79 | 3.928394% |
| D | 2011 | 114 | 5.668821% |
Noise dominated data is calculated using 1-second bins in cleaned event files. If a bin has >2000 counts, and if more than 50% of those come from <1% of pixels, then it is considered to be noise-dominated and hence unusable.
| Quadrant | # 1 sec bins | Bins with >0 counts | Bins with >2000 counts | High rate bins dominated by noise | Noise dominated (total time) | Noise dominated (detector-on time) | Marked lightcurve |
|---|---|---|---|---|---|---|---|
| A | 2921 | 2011 | 0 | 0 | 0.00% | 0.00% | 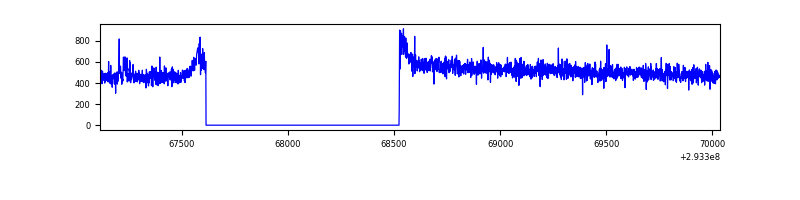 |
| B | 2921 | 2011 | 1 | 1 | 0.03% | 0.05% | 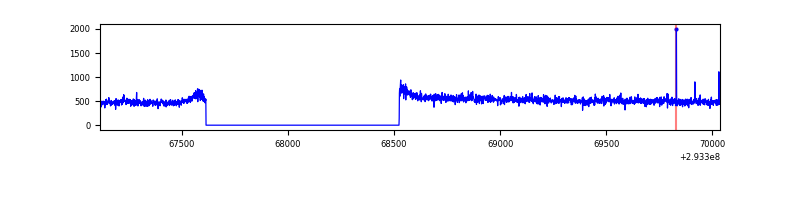 |
| C | 2921 | 2011 | 0 | 0 | 0.00% | 0.00% | 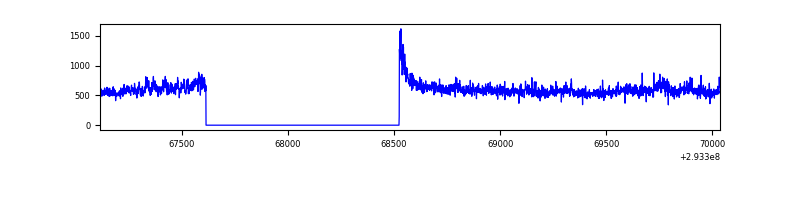 |
| D | 2921 | 2011 | 50 | 50 | 1.71% | 2.49% | 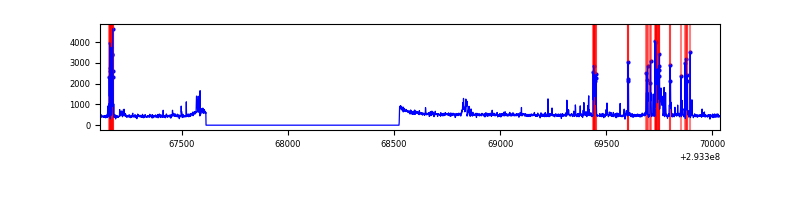 |
Top three noisy pixels from each quadrant. If the there are fewer than three noisy pixels in the level2.evt file, extra rows are filled as -1
| Pixel properties | Quadrant properties | ||||||
|---|---|---|---|---|---|---|---|
| Quadrant | DetID | PixID | Counts | Sigma | Mean | Median | Sigma |
| A | 9 | 143 | 5649 | 97.3 | 266 | 260 | 55.4 |
| A | 13 | 254 | 2769 | 45.3 | 266 | 260 | 55.4 |
| A | 0 | 226 | 2299 | 36.81 | 266 | 260 | 55.4 |
| B | 12 | 111 | 6097 | 111.06 | 263 | 256 | 52.6 |
| B | 11 | 111 | 5489 | 99.5 | 263 | 256 | 52.6 |
| B | 14 | 111 | 4827 | 86.91 | 263 | 256 | 52.6 |
| C | 3 | 233 | 195515 | 3281.77 | 249 | 249 | 59.5 |
| C | 14 | 238 | 38437 | 641.81 | 249 | 249 | 59.5 |
| C | 5 | 4 | 2320 | 34.81 | 249 | 249 | 59.5 |
| D | 11 | 176 | 197156 | 3159.26 | 252 | 244 | 62.3 |
| D | 13 | 104 | 29315 | 466.42 | 252 | 244 | 62.3 |
| D | 7 | 96 | 17836 | 282.25 | 252 | 244 | 62.3 |
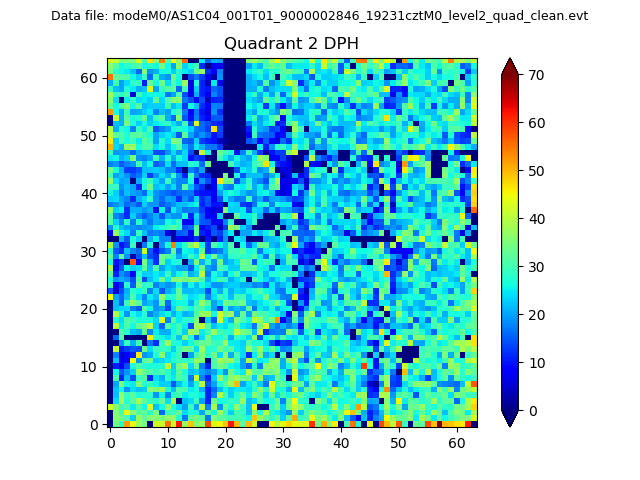
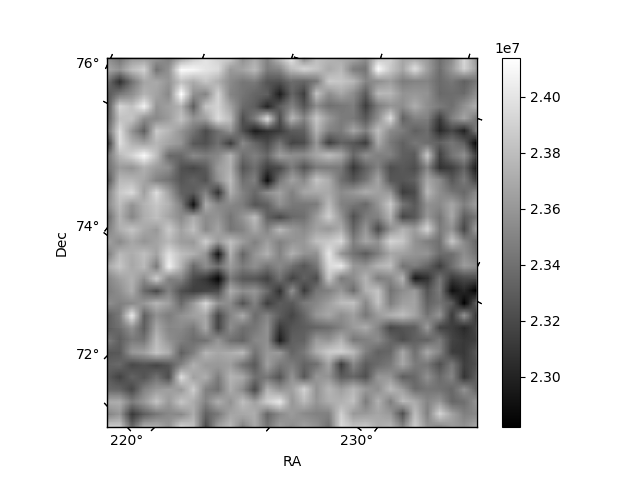
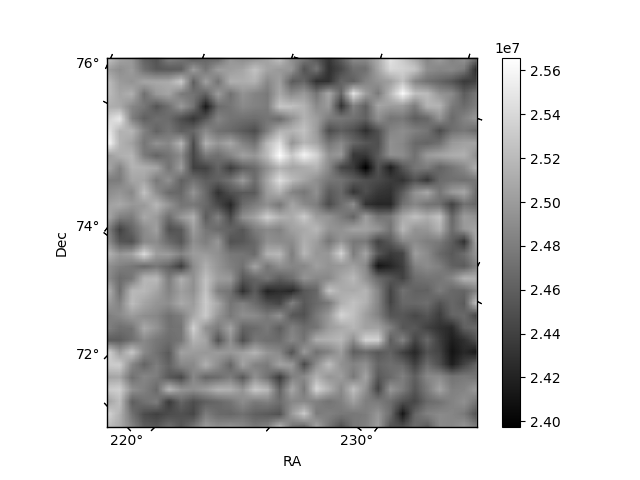
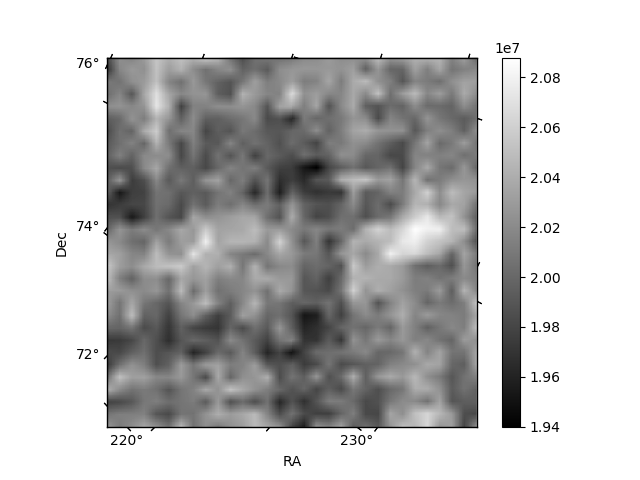
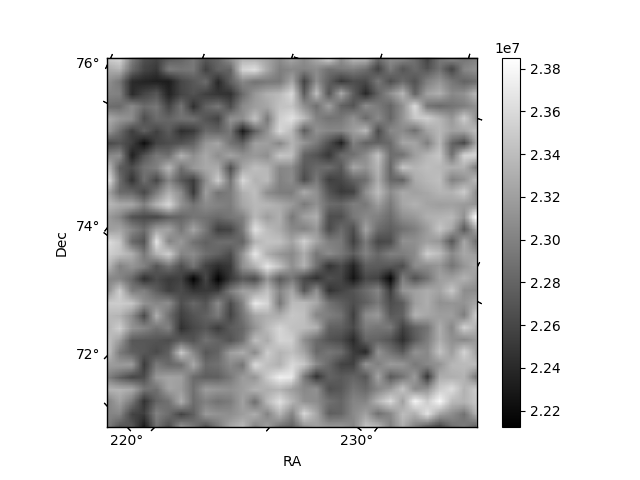
Histogram calculated using DETX and DETY for each event in the final _common_clean file
| Quadrant A | 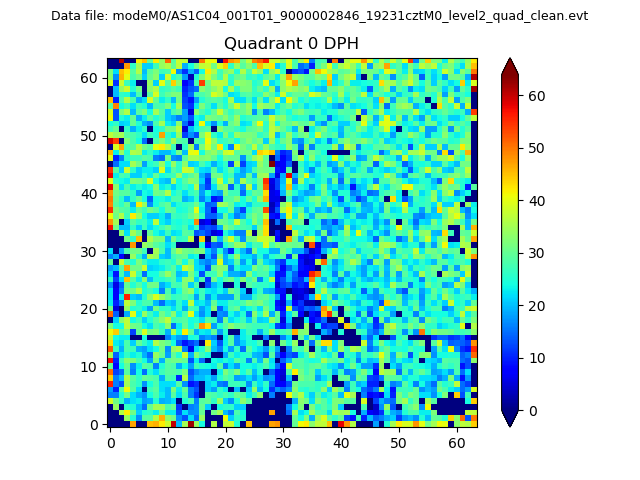 |
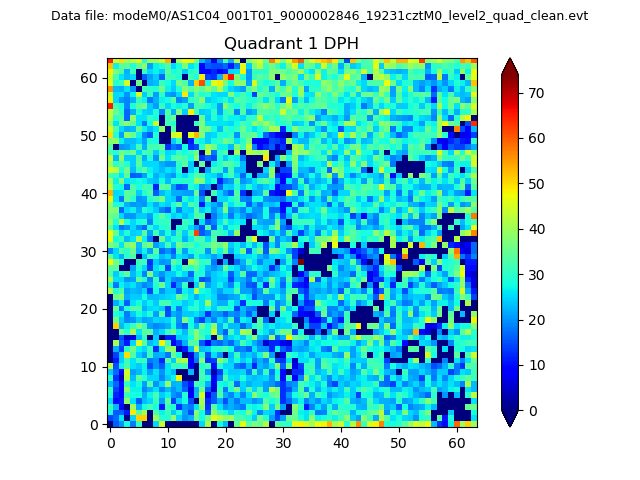 |
Quadrant B |
|---|---|---|---|
| Quadrant D | 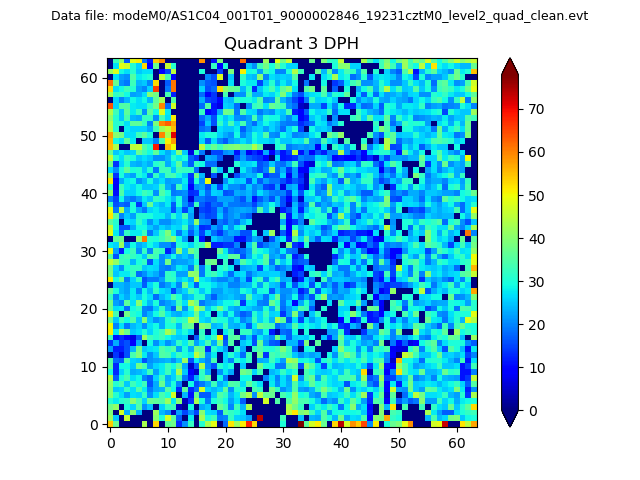 |
 |
Quadrant C |
| Plot type | Count rate plots | Images |
|---|---|---|
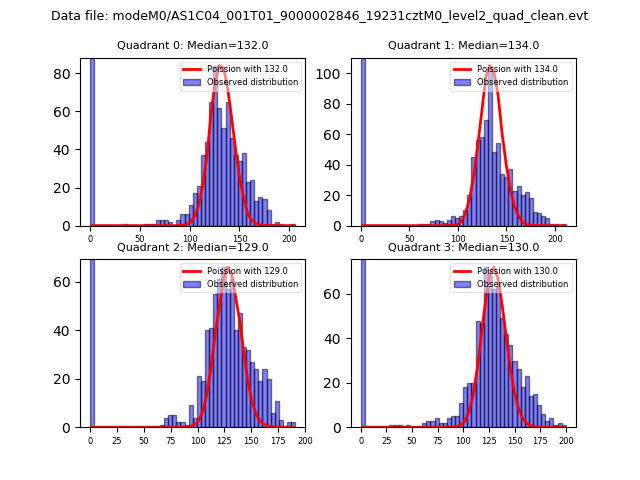
| Comparison with Poisson distribution Blue bars denote a histogram of data divided into 1 sec bins. Red curve is a Poisson curve with rate = median count rate of data. |
 |
 |
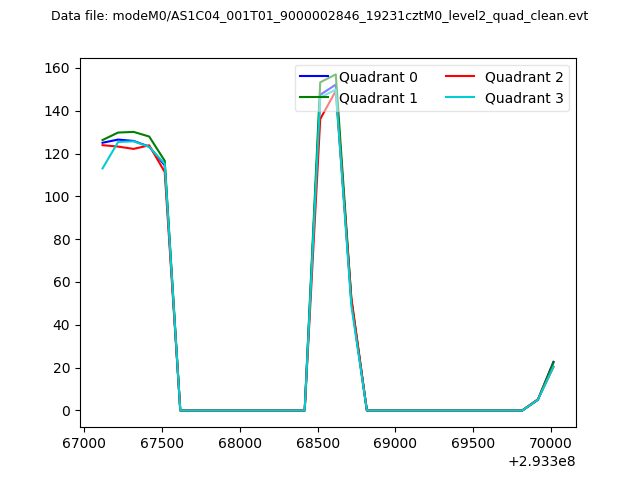
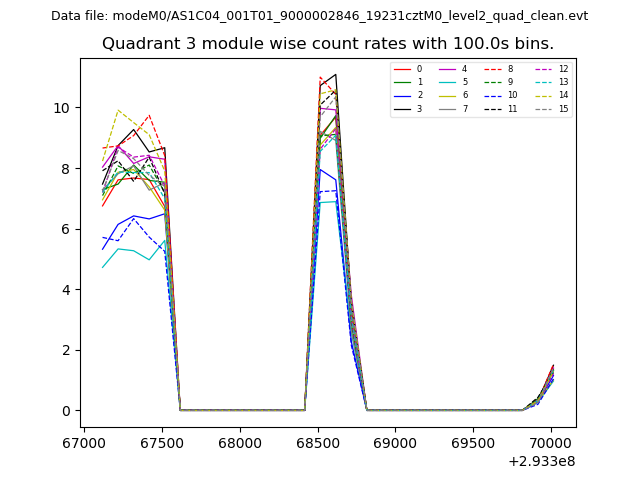
| Quadrant-wise count rates Data is divided into 100 sec bins |
 |
|
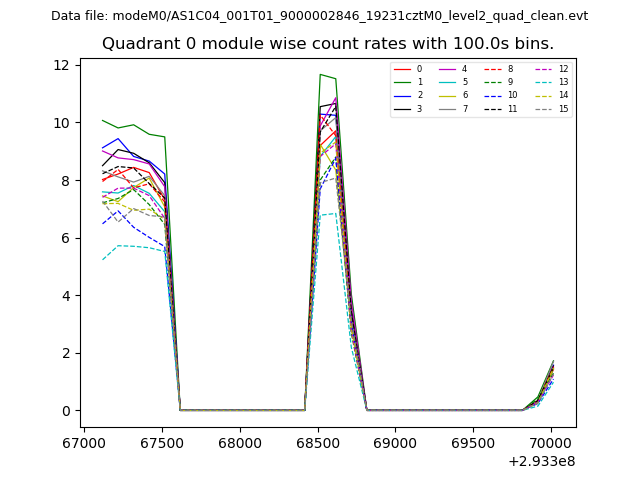
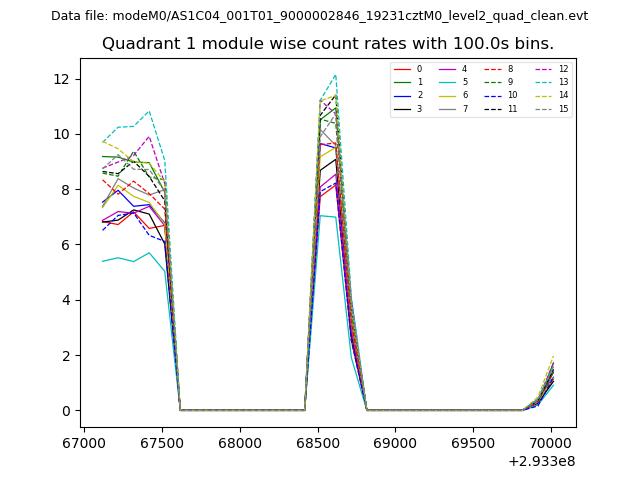
| Module-wise count rates for Quadrant A Data is divided into 100 sec bins |
 |
 |
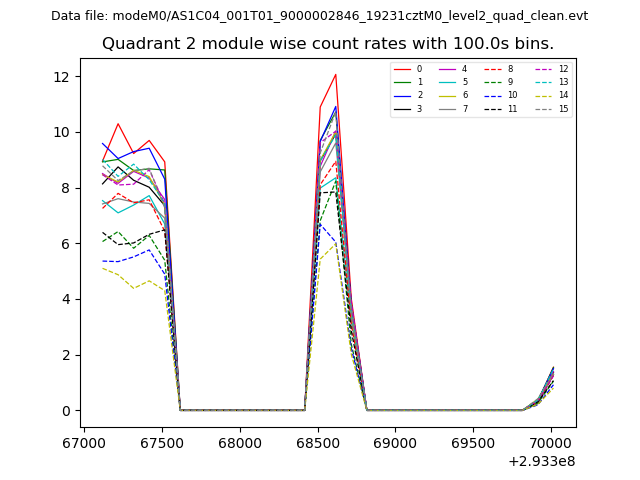
| Module-wise count rates for Quadrant B Data is divided into 100 sec bins |
 |
 |
| Module-wise count rates for Quadrant C Data is divided into 100 sec bins |
 |
 |
| Module-wise count rates for Quadrant D Data is divided into 100 sec bins |
 |
 |
| Parameter | Plot |
|---|---|
| CZT HV Monitor | 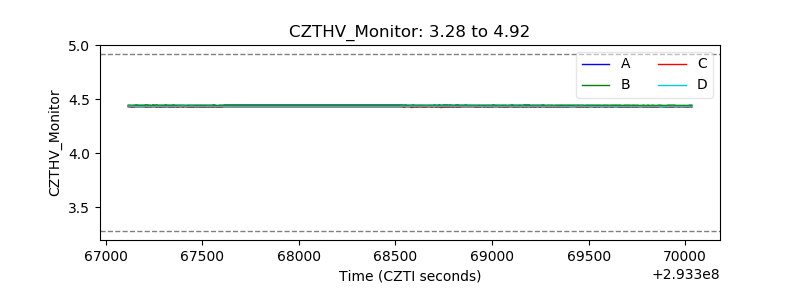 |
| D_VDD | 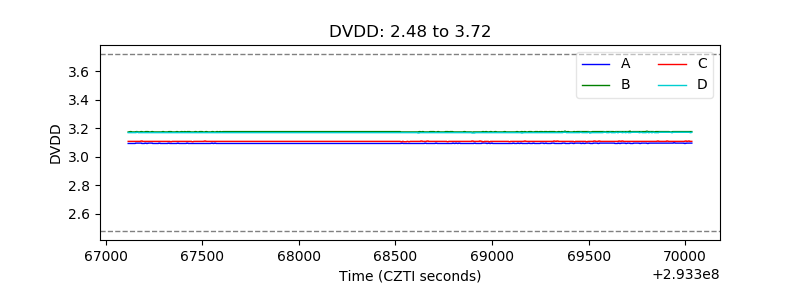 |
| Temperature 1 | 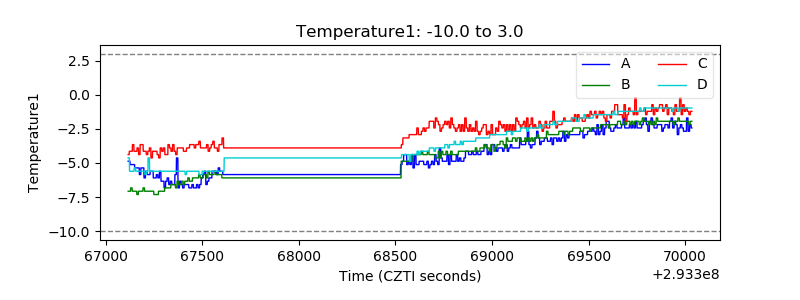 |
| Veto HV Monitor | 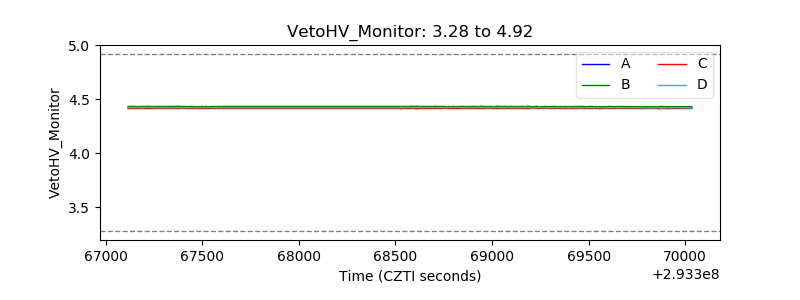 |
| Veto LLD | 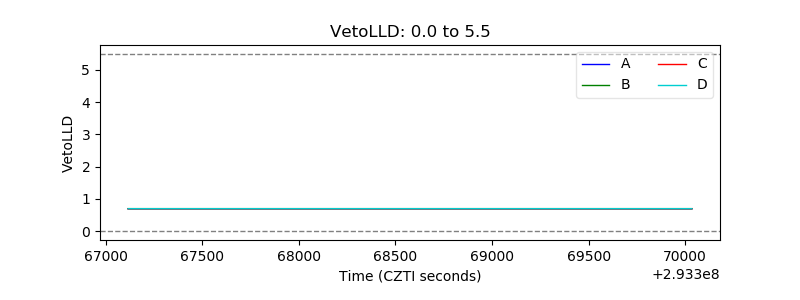 |
| Alpha Counter | 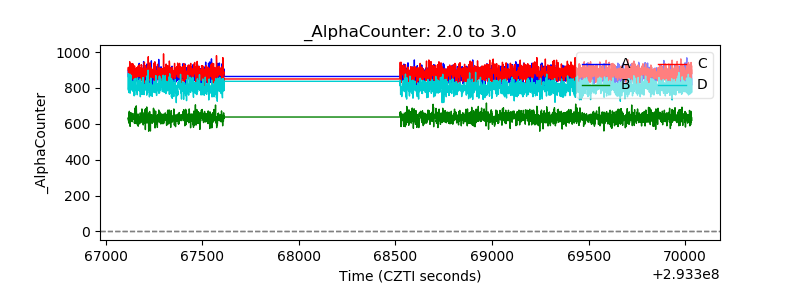 |
| _CPM_Rate | 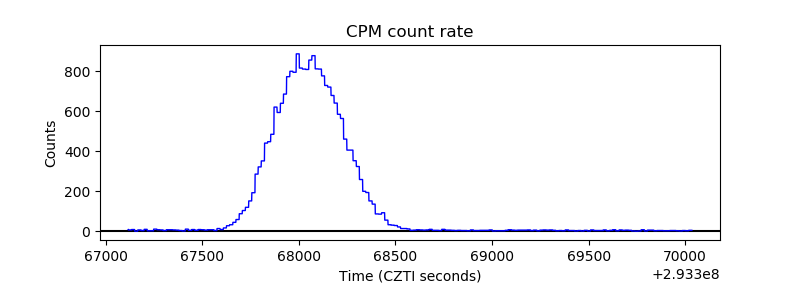 |
| CZT Counter |  |
| +2.5 Volts monitor |  |
| +5 Volts monitor | 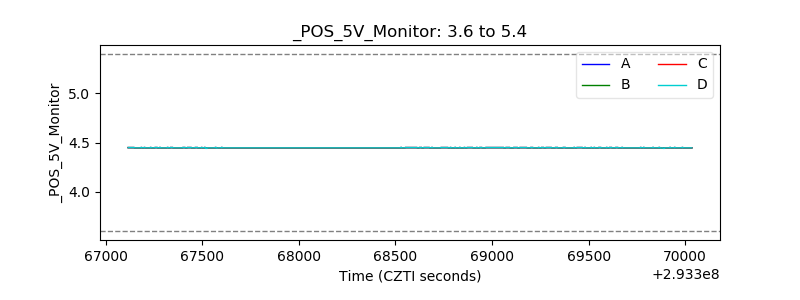 |
| _ROLL_ROT | 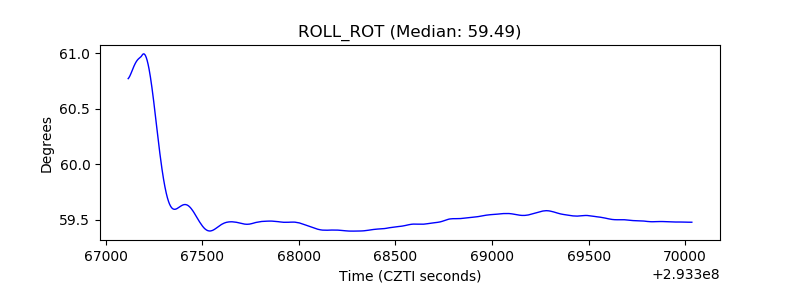 |
| _Roll_DEC | 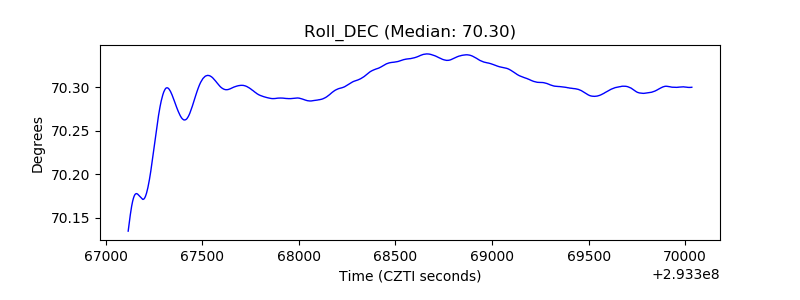 |
| _Roll_RA | 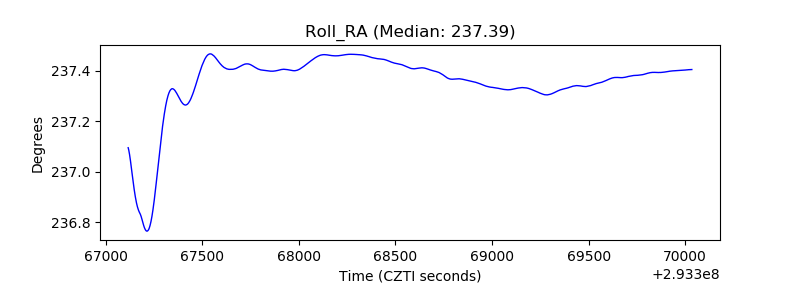 |
| Veto Counter | 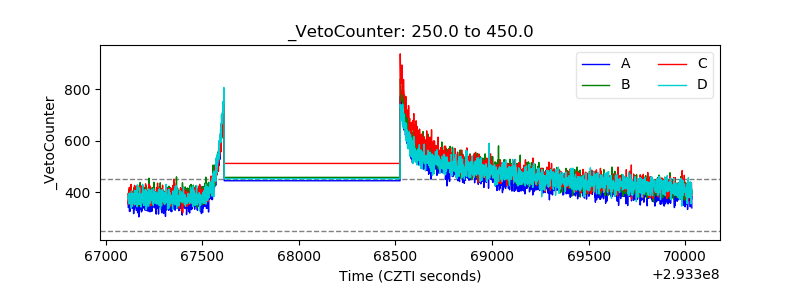 |