| Param | Original file | Final file |
|---|---|---|
| Filename | modeM0/AS1C04_001T01_9000002846_19232cztM0_level2.evt | modeM0/AS1C04_001T01_9000002846_19232cztM0_level2_quad_clean.evt |
| Size (bytes) | 503,570,880 | 82,681,920 |
| Size | 480.2 MB | 78.9 MB |
| Events in quadrant A | 3,120,178 | 523,912 |
| Events in quadrant B | 3,213,910 | 531,799 |
| Events in quadrant C | 3,896,456 | 505,154 |
| Events in quadrant D | 4,582,727 | 493,011 |
| Mode M9 | |||
|---|---|---|---|
| Quadrant | BADHDUFLAG | Total packets | Discarded packets |
| A | 0 | 11 | 0 |
| B | 0 | 11 | 0 |
| C | 0 | 11 | 0 |
| D | 0 | 11 | 0 |
| Mode SS | |||
|---|---|---|---|
| Quadrant | BADHDUFLAG | Total packets | Discarded packets |
| A | 0 | 130 | 0 |
| B | 0 | 130 | 0 |
| C | 0 | 130 | 0 |
| D | 0 | 130 | 0 |
| Mode M0 | |||
|---|---|---|---|
| Quadrant | BADHDUFLAG | Total packets | Discarded packets |
| A | 0 | 13515 | 2 |
| B | 0 | 13705 | 1 |
| C | 0 | 15930 | 1 |
| D | 0 | 17991 | 1 |
| Quadrant | Total seconds | Saturated seconds | Saturation percentage |
|---|---|---|---|
| A | 6450 | 69 | 1.069767% |
| B | 6450 | 78 | 1.209302% |
| C | 6450 | 114 | 1.767442% |
| D | 6450 | 359 | 5.565891% |
Noise dominated data is calculated using 1-second bins in cleaned event files. If a bin has >2000 counts, and if more than 50% of those come from <1% of pixels, then it is considered to be noise-dominated and hence unusable.
| Quadrant | # 1 sec bins | Bins with >0 counts | Bins with >2000 counts | High rate bins dominated by noise | Noise dominated (total time) | Noise dominated (detector-on time) | Marked lightcurve |
|---|---|---|---|---|---|---|---|
| A | 7505 | 6450 | 7 | 7 | 0.09% | 0.11% | 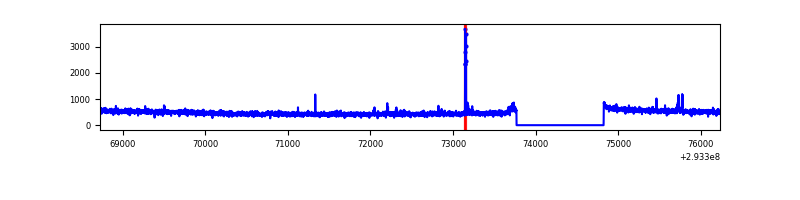 |
| B | 7505 | 6450 | 5 | 5 | 0.07% | 0.08% | 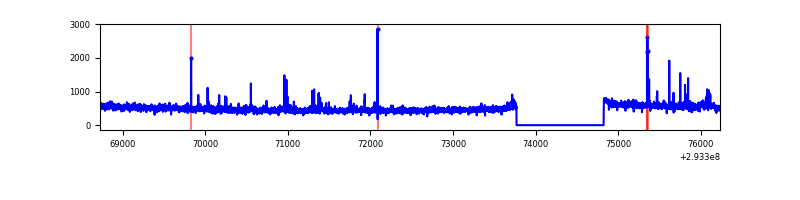 |
| C | 7505 | 6450 | 7 | 7 | 0.09% | 0.11% | 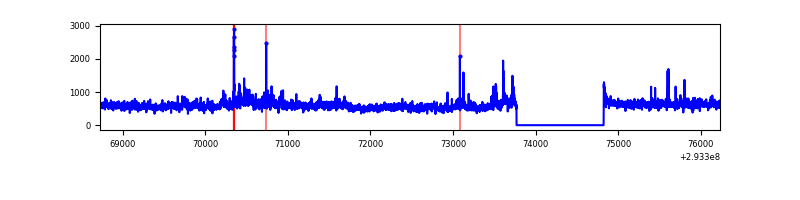 |
| D | 7505 | 6450 | 236 | 236 | 3.14% | 3.66% | 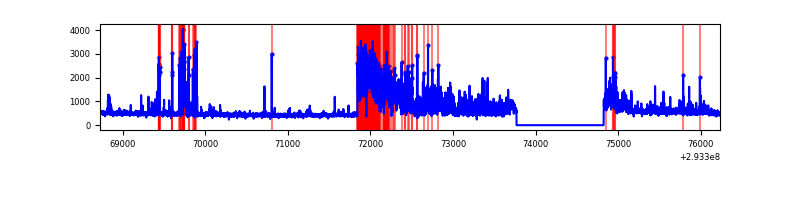 |
Top three noisy pixels from each quadrant. If the there are fewer than three noisy pixels in the level2.evt file, extra rows are filled as -1
| Pixel properties | Quadrant properties | ||||||
|---|---|---|---|---|---|---|---|
| Quadrant | DetID | PixID | Counts | Sigma | Mean | Median | Sigma |
| A | 9 | 143 | 49587 | 302.05 | 796 | 778 | 161.6 |
| A | 13 | 254 | 8905 | 50.29 | 796 | 778 | 161.6 |
| A | 0 | 226 | 6810 | 37.33 | 796 | 778 | 161.6 |
| B | 7 | 220 | 26488 | 172.82 | 791 | 771 | 148.8 |
| B | 0 | 198 | 20123 | 130.04 | 791 | 771 | 148.8 |
| B | 4 | 80 | 19042 | 122.78 | 791 | 771 | 148.8 |
| C | 3 | 233 | 763362 | 4331.44 | 761 | 762 | 176.1 |
| C | 14 | 238 | 119805 | 676.14 | 761 | 762 | 176.1 |
| C | 0 | 207 | 39214 | 218.4 | 761 | 762 | 176.1 |
| D | 1 | 52 | 1370768 | 7398.63 | 766 | 744 | 185.2 |
| D | 11 | 176 | 222048 | 1195.12 | 766 | 744 | 185.2 |
| D | 13 | 104 | 39175 | 207.54 | 766 | 744 | 185.2 |
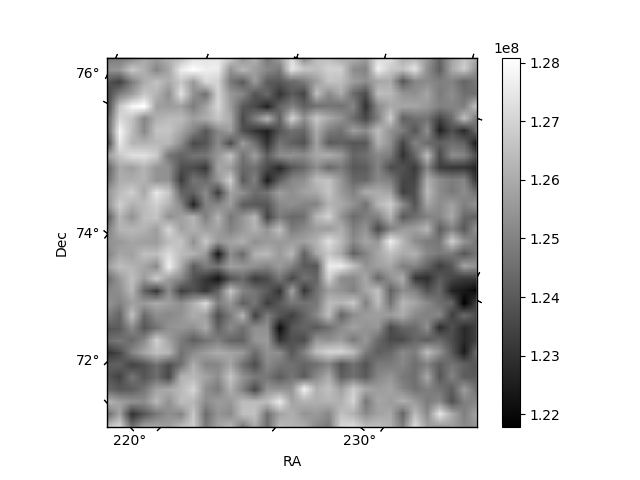
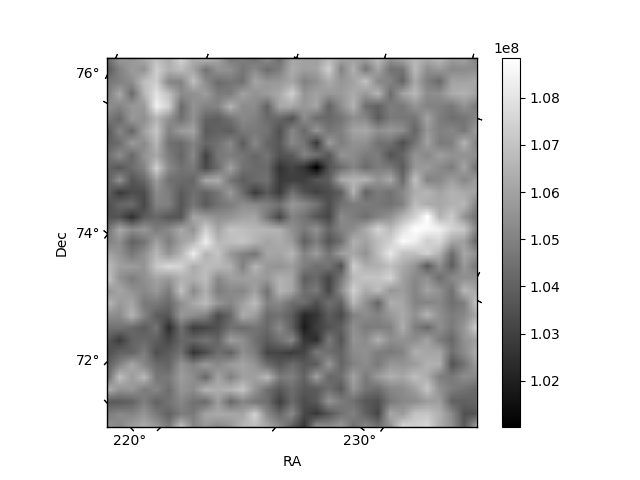
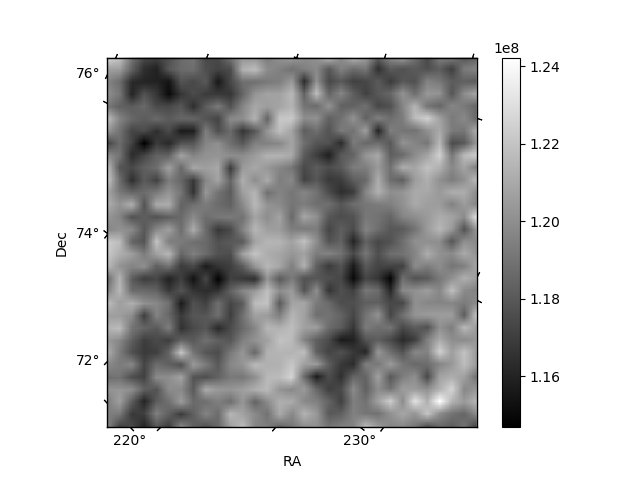
Histogram calculated using DETX and DETY for each event in the final _common_clean file
| Quadrant A | 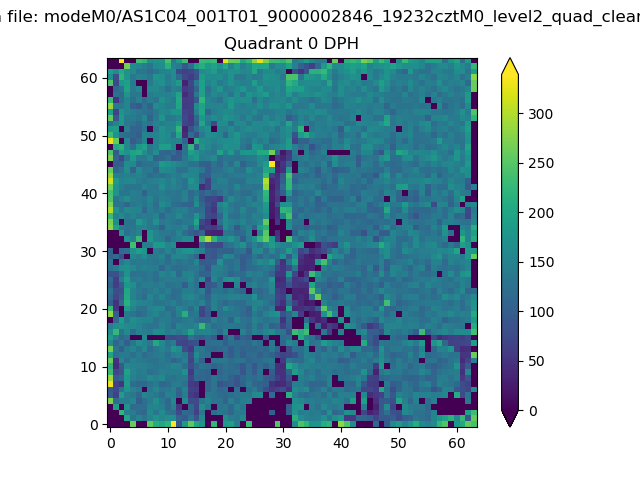 |
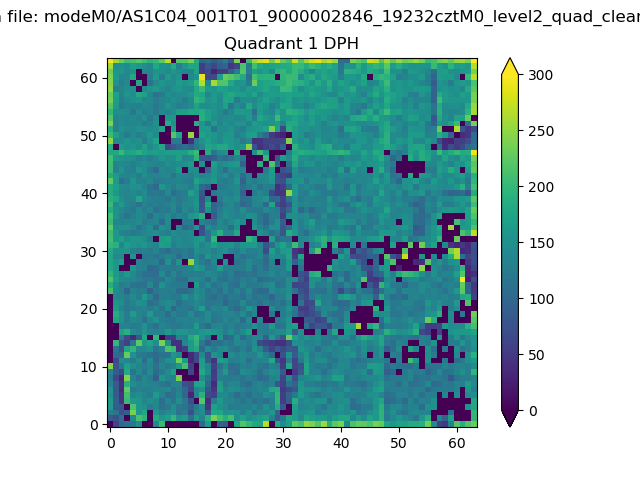 |
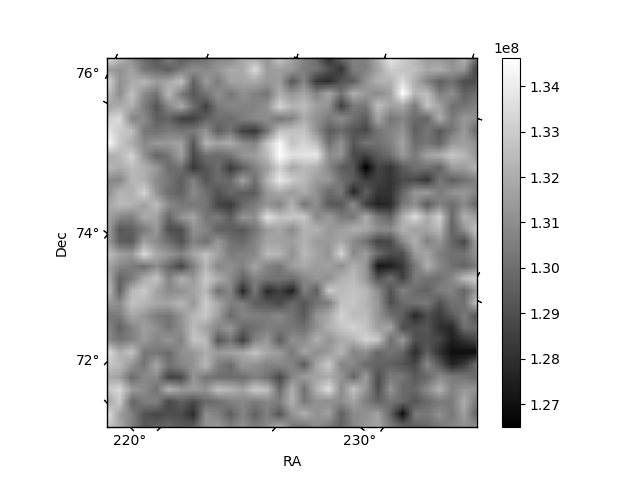
Quadrant B |
|---|---|---|---|
| Quadrant D |  |
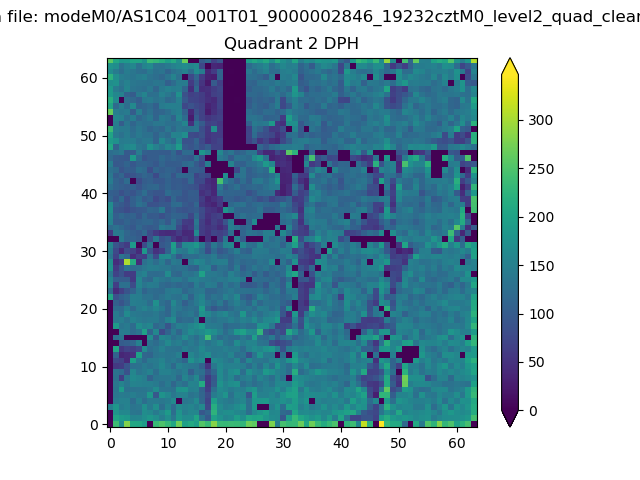 |
Quadrant C |
| Plot type | Count rate plots | Images |
|---|---|---|
| Comparison with Poisson distribution Blue bars denote a histogram of data divided into 1 sec bins. Red curve is a Poisson curve with rate = median count rate of data. |
 |
 |
| Quadrant-wise count rates Data is divided into 100 sec bins |
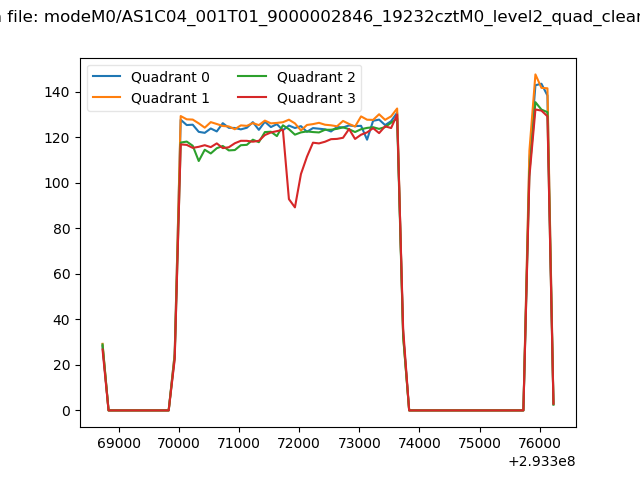 |
|
| Module-wise count rates for Quadrant A Data is divided into 100 sec bins |
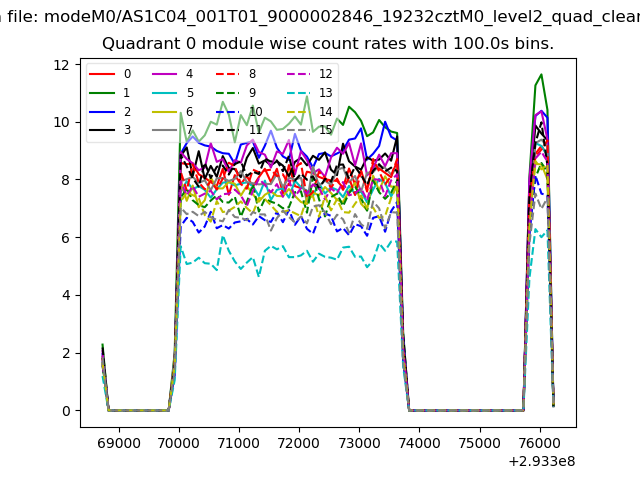 |
 |
| Module-wise count rates for Quadrant B Data is divided into 100 sec bins |
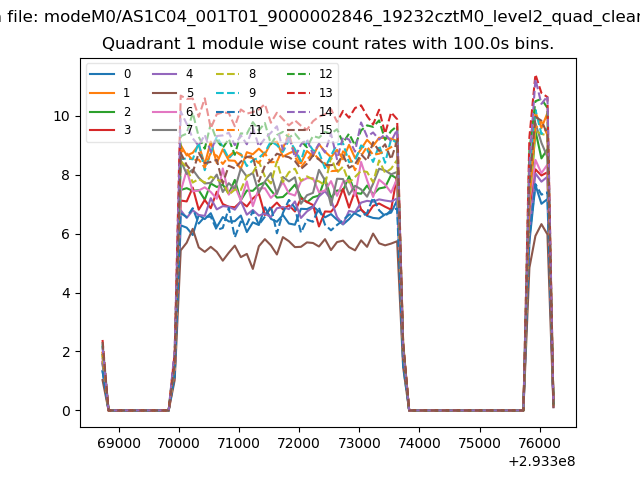 |
 |
| Module-wise count rates for Quadrant C Data is divided into 100 sec bins |
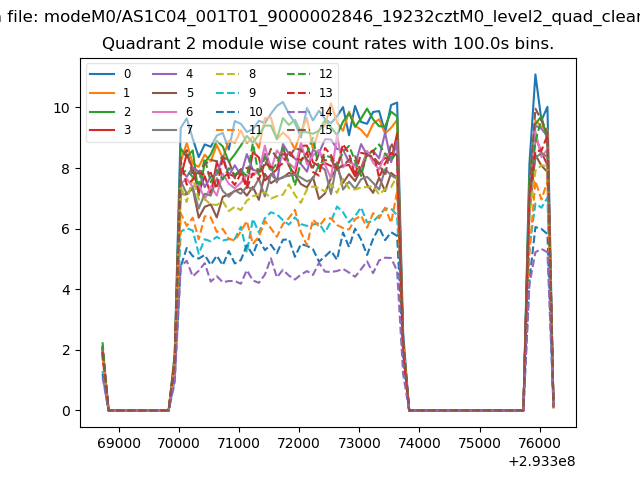 |
 |
| Module-wise count rates for Quadrant D Data is divided into 100 sec bins |
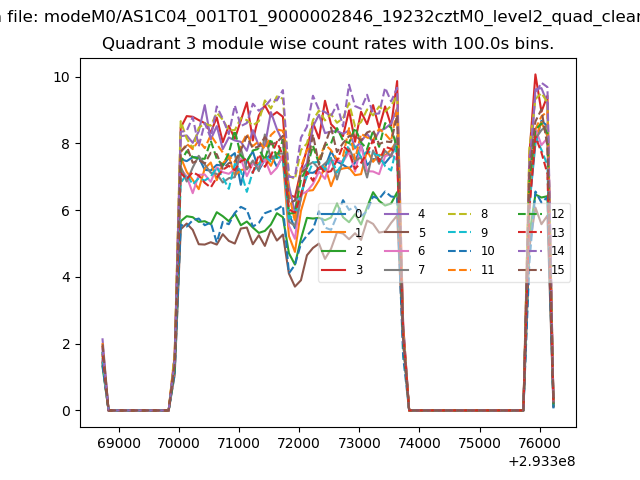 |
 |
| Parameter | Plot |
|---|---|
| CZT HV Monitor | 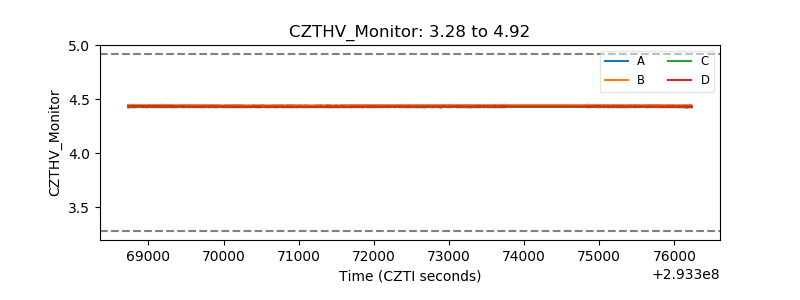 |
| D_VDD | 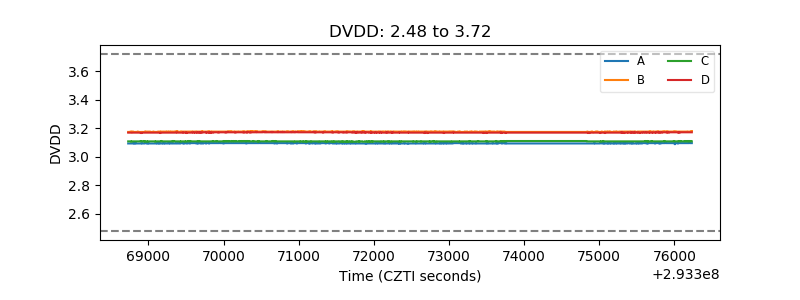 |
| Temperature 1 | 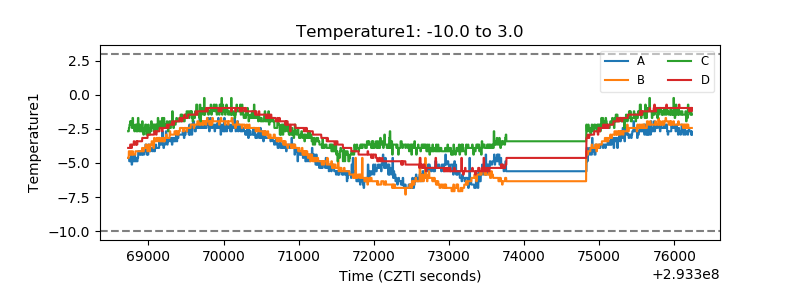 |
| Veto HV Monitor |  |
| Veto LLD | 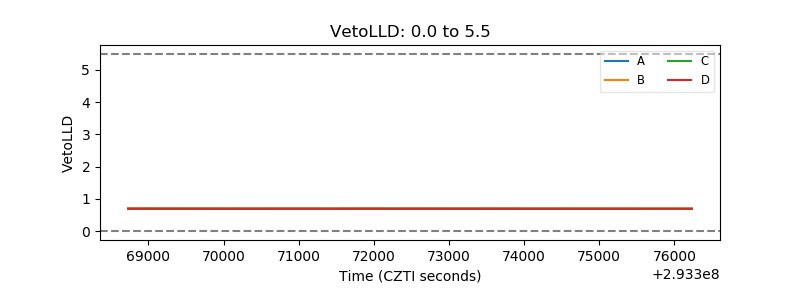 |
| Alpha Counter | 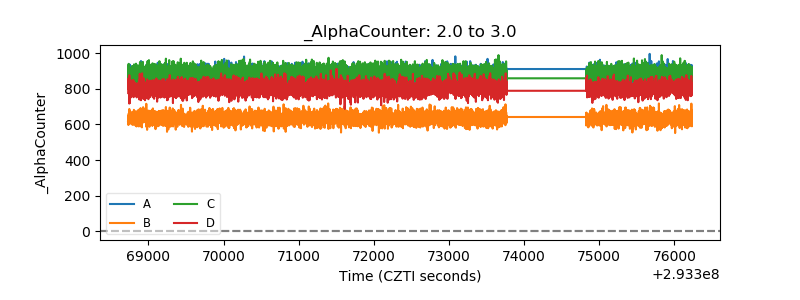 |
| _CPM_Rate | 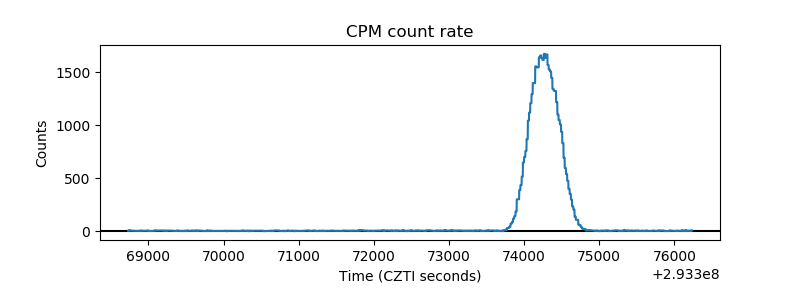 |
| CZT Counter | 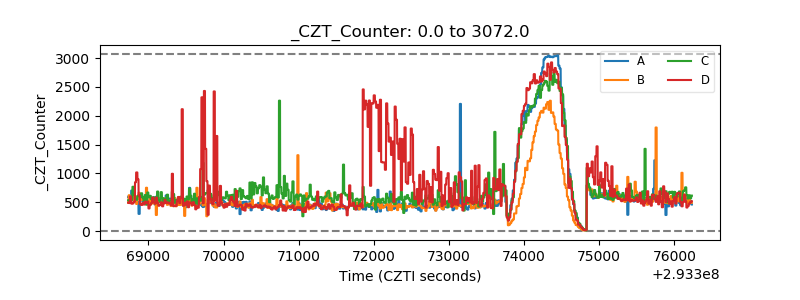 |
| +2.5 Volts monitor |  |
| +5 Volts monitor | 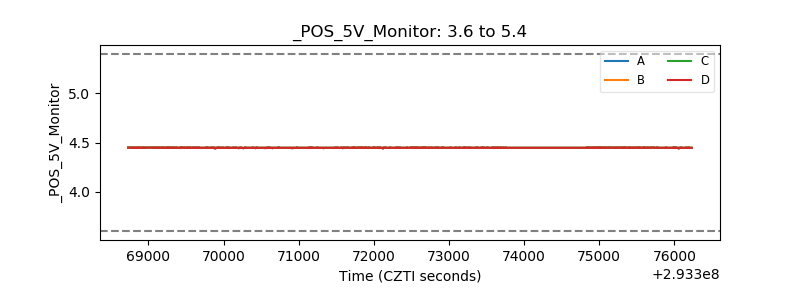 |
| _ROLL_ROT |  |
| _Roll_DEC |  |
| _Roll_RA |  |
| Veto Counter | 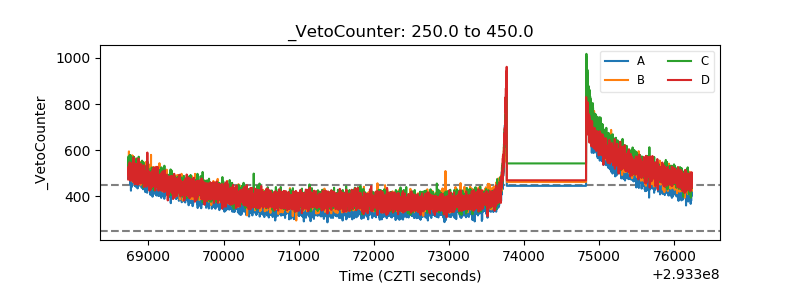 |