| Param | Original file | Final file |
|---|---|---|
| Filename | modeM0/AS1C04_001T01_9000002846_19234cztM0_level2.evt | modeM0/AS1C04_001T01_9000002846_19234cztM0_level2_quad_clean.evt |
| Size (bytes) | 469,998,720 | 97,934,400 |
| Size | 448.2 MB | 93.4 MB |
| Events in quadrant A | 3,197,125 | 638,794 |
| Events in quadrant B | 3,329,544 | 646,718 |
| Events in quadrant C | 3,790,215 | 621,302 |
| Events in quadrant D | 3,485,007 | 615,174 |
| Mode M9 | |||
|---|---|---|---|
| Quadrant | BADHDUFLAG | Total packets | Discarded packets |
| A | 0 | 16 | 0 |
| B | 0 | 17 | 0 |
| C | 0 | 17 | 0 |
| D | 0 | 17 | 0 |
| Mode SS | |||
|---|---|---|---|
| Quadrant | BADHDUFLAG | Total packets | Discarded packets |
| A | 0 | 128 | 0 |
| B | 0 | 128 | 0 |
| C | 0 | 128 | 0 |
| D | 0 | 128 | 0 |
| Mode M0 | |||
|---|---|---|---|
| Quadrant | BADHDUFLAG | Total packets | Discarded packets |
| A | 0 | 13813 | 2 |
| B | 0 | 14252 | 2 |
| C | 0 | 15727 | 2 |
| D | 0 | 14724 | 2 |
| Quadrant | Total seconds | Saturated seconds | Saturation percentage |
|---|---|---|---|
| A | 6366 | 73 | 1.146717% |
| B | 6366 | 98 | 1.539428% |
| C | 6366 | 139 | 2.183475% |
| D | 6366 | 105 | 1.649387% |
Noise dominated data is calculated using 1-second bins in cleaned event files. If a bin has >2000 counts, and if more than 50% of those come from <1% of pixels, then it is considered to be noise-dominated and hence unusable.
| Quadrant | # 1 sec bins | Bins with >0 counts | Bins with >2000 counts | High rate bins dominated by noise | Noise dominated (total time) | Noise dominated (detector-on time) | Marked lightcurve |
|---|---|---|---|---|---|---|---|
| A | 7541 | 6366 | 1 | 1 | 0.01% | 0.02% | 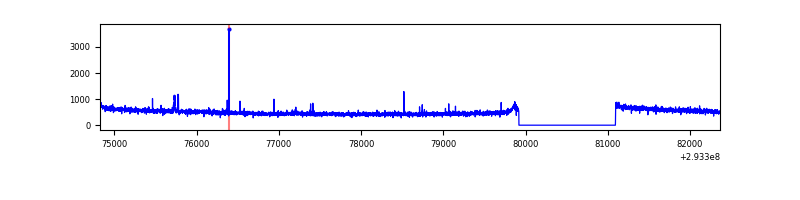 |
| B | 7541 | 6366 | 10 | 10 | 0.13% | 0.16% | 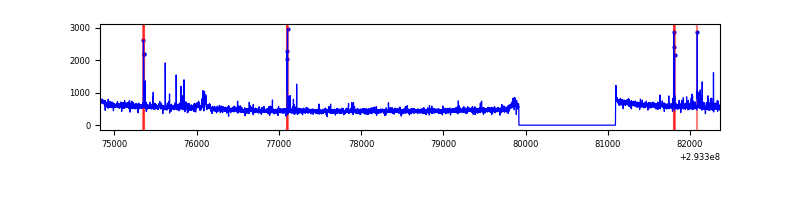 |
| C | 7540 | 6365 | 5 | 5 | 0.07% | 0.08% | 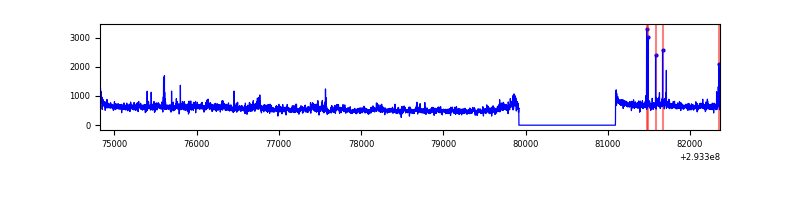 |
| D | 7541 | 6366 | 28 | 28 | 0.37% | 0.44% | 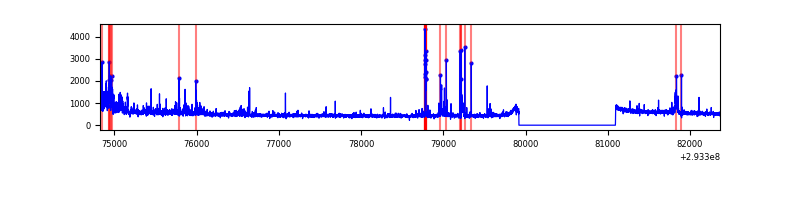 |
Top three noisy pixels from each quadrant. If the there are fewer than three noisy pixels in the level2.evt file, extra rows are filled as -1
| Pixel properties | Quadrant properties | ||||||
|---|---|---|---|---|---|---|---|
| Quadrant | DetID | PixID | Counts | Sigma | Mean | Median | Sigma |
| A | 9 | 143 | 21658 | 127.22 | 821 | 804 | 163.9 |
| A | 3 | 15 | 8443 | 46.6 | 821 | 804 | 163.9 |
| A | 13 | 254 | 8358 | 46.08 | 821 | 804 | 163.9 |
| B | 7 | 220 | 53118 | 340.19 | 817 | 797 | 153.8 |
| B | 4 | 80 | 19892 | 124.16 | 817 | 797 | 153.8 |
| B | 3 | 64 | 18085 | 112.41 | 817 | 797 | 153.8 |
| C | 3 | 233 | 510693 | 2798.5 | 793 | 798 | 182.2 |
| C | 14 | 238 | 125568 | 684.78 | 793 | 798 | 182.2 |
| C | 0 | 207 | 58188 | 314.98 | 793 | 798 | 182.2 |
| D | 1 | 52 | 230761 | 1191.96 | 806 | 784 | 192.9 |
| D | 11 | 176 | 125362 | 645.68 | 806 | 784 | 192.9 |
| D | 2 | 120 | 42543 | 216.43 | 806 | 784 | 192.9 |
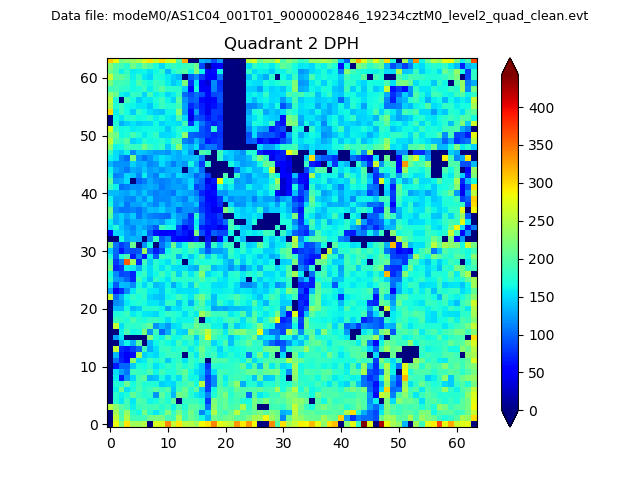
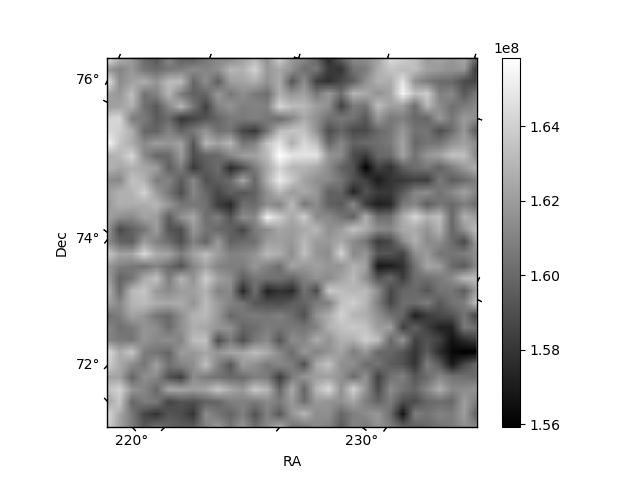
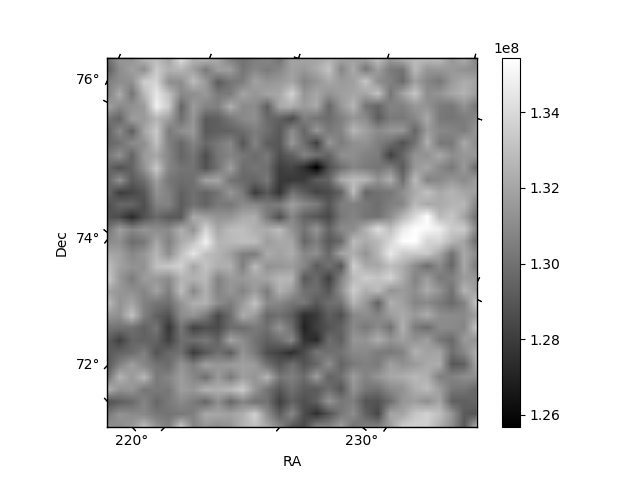
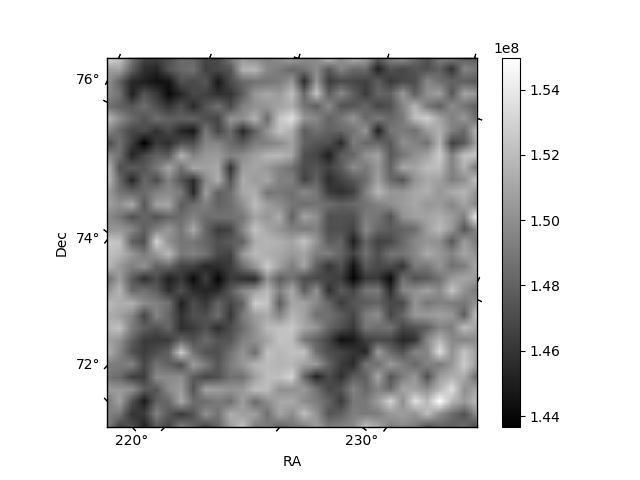
Histogram calculated using DETX and DETY for each event in the final _common_clean file
| Quadrant A | 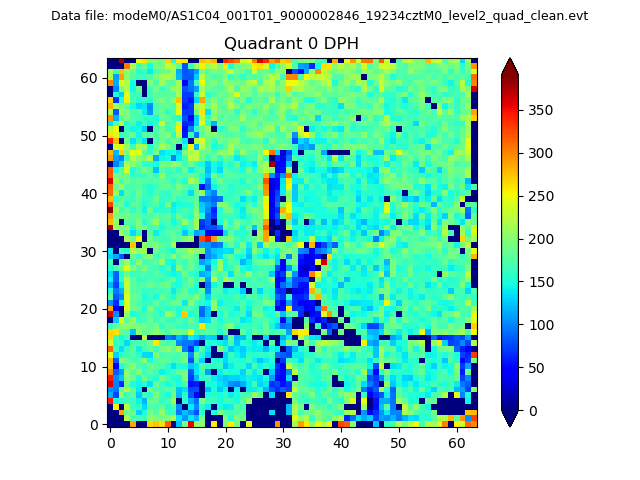 |
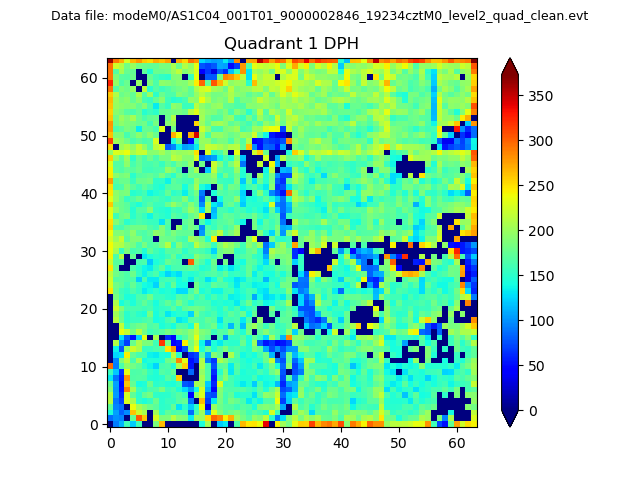 |
Quadrant B |
|---|---|---|---|
| Quadrant D | 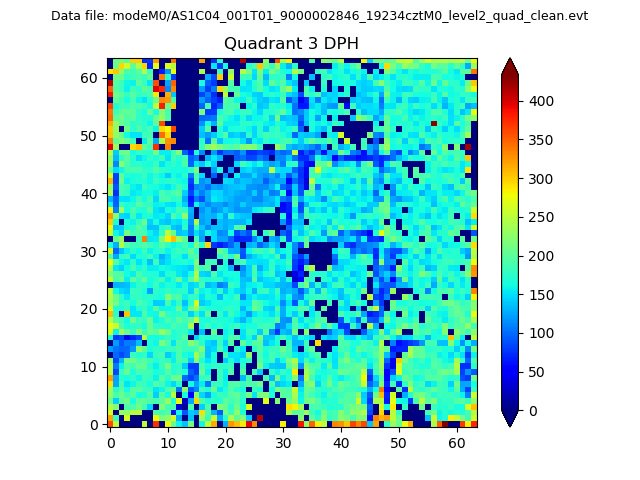 |
 |
Quadrant C |
| Plot type | Count rate plots | Images |
|---|---|---|
| Comparison with Poisson distribution Blue bars denote a histogram of data divided into 1 sec bins. Red curve is a Poisson curve with rate = median count rate of data. |
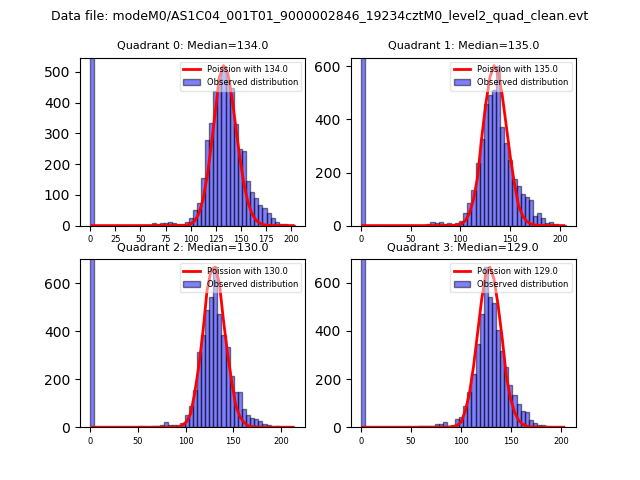 |
 |
| Quadrant-wise count rates Data is divided into 100 sec bins |
 |
|
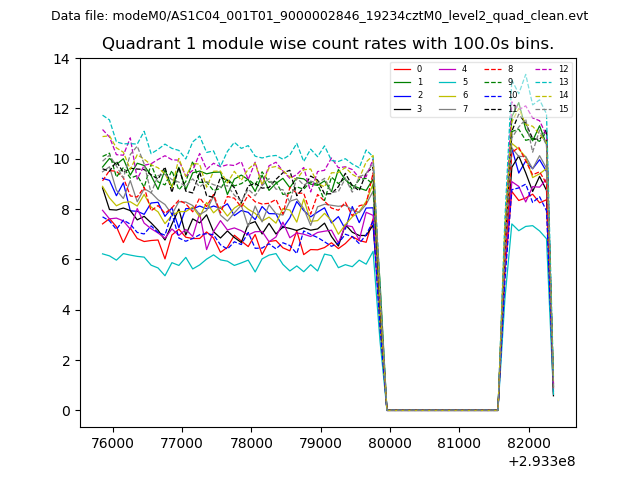
| Module-wise count rates for Quadrant A Data is divided into 100 sec bins |
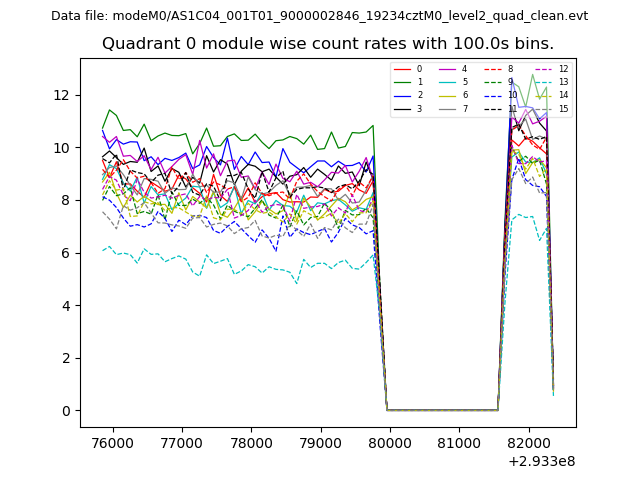 |
 |
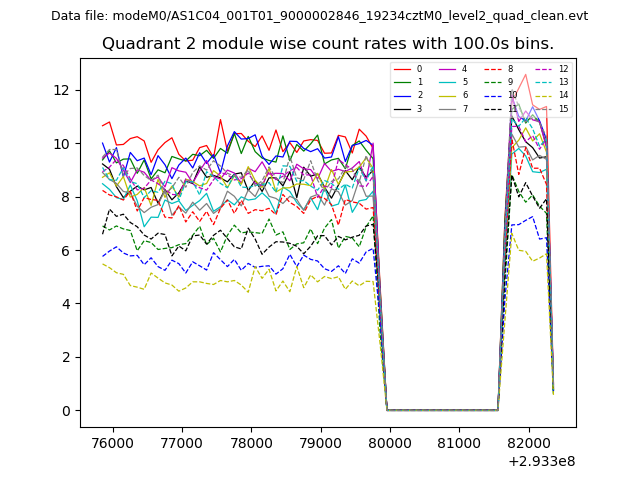
| Module-wise count rates for Quadrant B Data is divided into 100 sec bins |
 |
 |
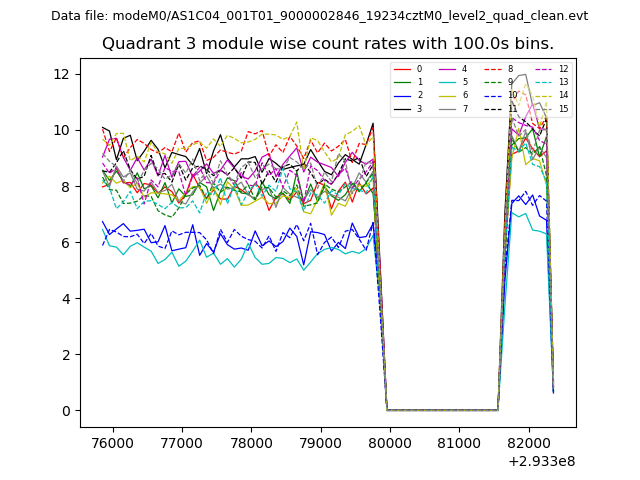
| Module-wise count rates for Quadrant C Data is divided into 100 sec bins |
 |
 |
| Module-wise count rates for Quadrant D Data is divided into 100 sec bins |
 |
 |
| Parameter | Plot |
|---|---|
| CZT HV Monitor |  |
| D_VDD | 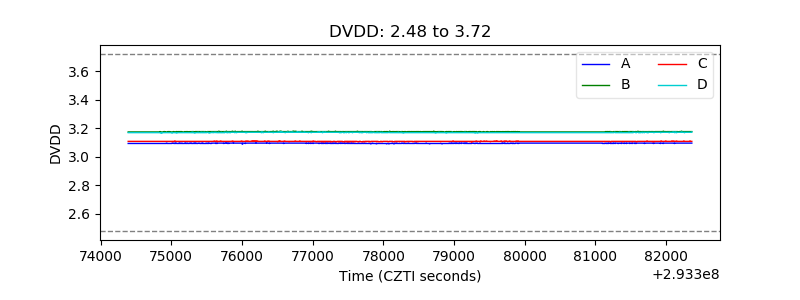 |
| Temperature 1 | 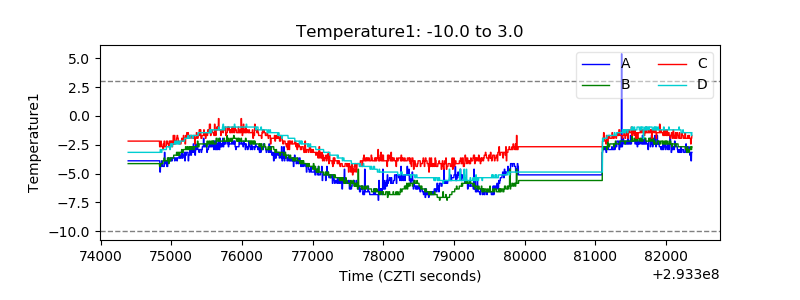 |
| Veto HV Monitor | 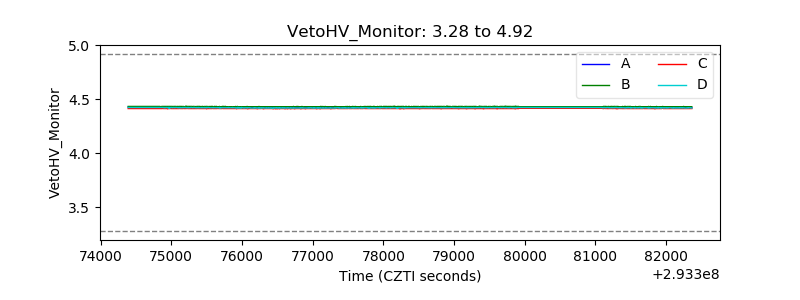 |
| Veto LLD | 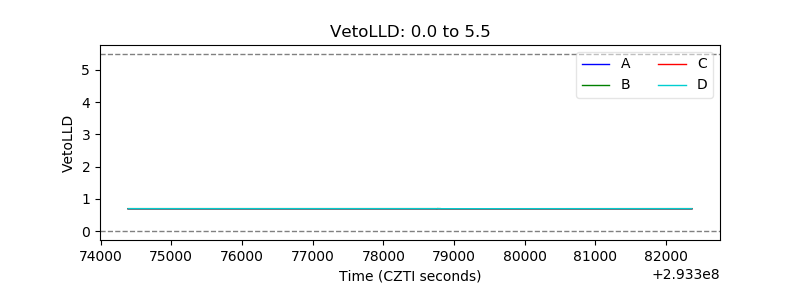 |
| Alpha Counter | 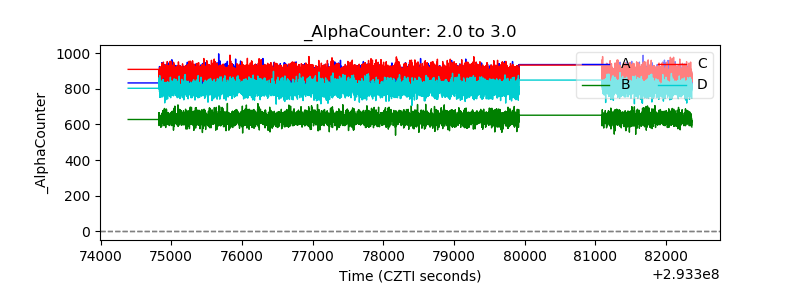 |
| _CPM_Rate | 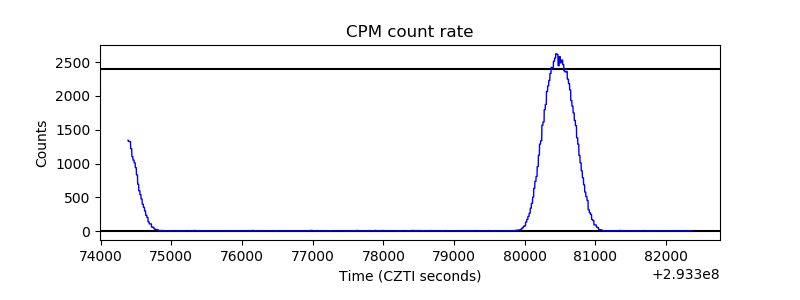 |
| CZT Counter | 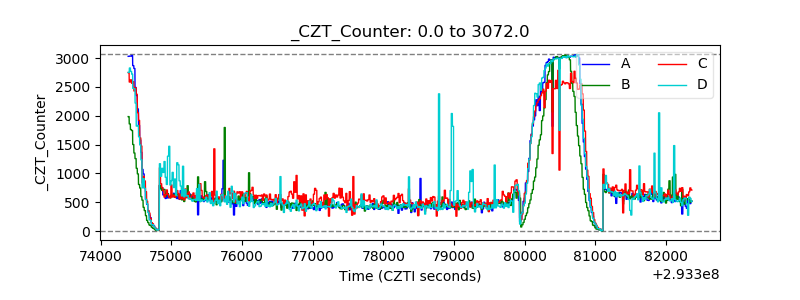 |
| +2.5 Volts monitor |  |
| +5 Volts monitor |  |
| _ROLL_ROT | 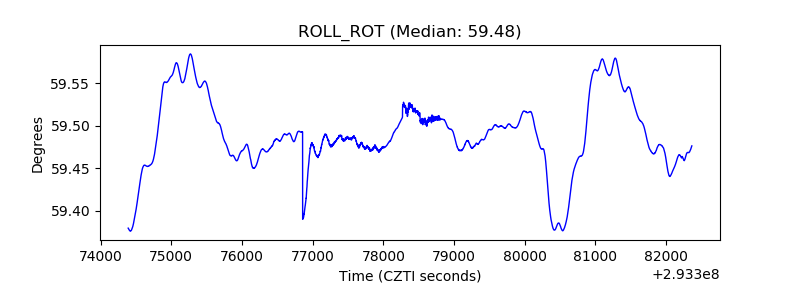 |
| _Roll_DEC | 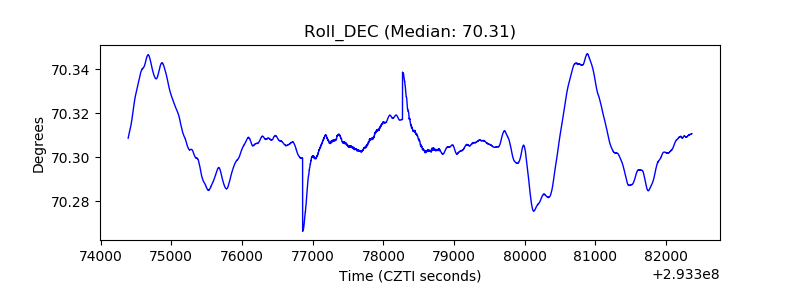 |
| _Roll_RA | 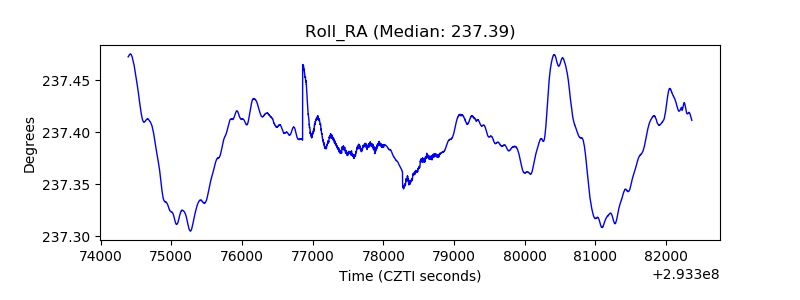 |
| Veto Counter | 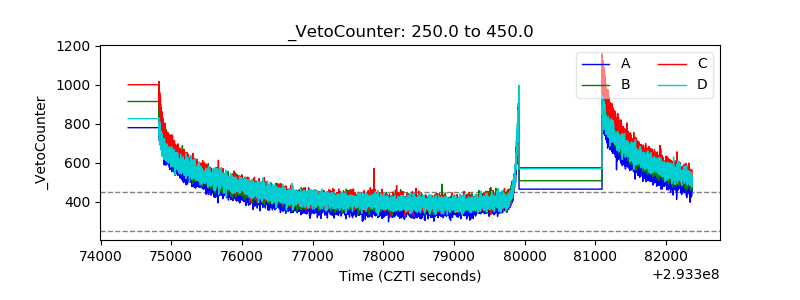 |