| Param | Original file | Final file |
|---|---|---|
| Filename | modeM0/AS1C04_001T01_9000002846_19236cztM0_level2.evt | modeM0/AS1C04_001T01_9000002846_19236cztM0_level2_quad_clean.evt |
| Size (bytes) | 463,484,160 | 131,100,480 |
| Size | 442.0 MB | 125.0 MB |
| Events in quadrant A | 3,157,195 | 884,407 |
| Events in quadrant B | 3,234,310 | 916,858 |
| Events in quadrant C | 3,670,405 | 887,645 |
| Events in quadrant D | 3,563,208 | 858,783 |
| Mode M9 | |||
|---|---|---|---|
| Quadrant | BADHDUFLAG | Total packets | Discarded packets |
| A | 0 | 14 | 0 |
| B | 0 | 14 | 0 |
| C | 0 | 14 | 0 |
| D | 0 | 14 | 0 |
| Mode SS | |||
|---|---|---|---|
| Quadrant | BADHDUFLAG | Total packets | Discarded packets |
| A | 0 | 122 | 0 |
| B | 0 | 122 | 0 |
| C | 0 | 122 | 0 |
| D | 0 | 122 | 0 |
| Mode M0 | |||
|---|---|---|---|
| Quadrant | BADHDUFLAG | Total packets | Discarded packets |
| A | 0 | 13421 | 0 |
| B | 0 | 13649 | 0 |
| C | 0 | 14988 | 0 |
| D | 0 | 14764 | 0 |
| Quadrant | Total seconds | Saturated seconds | Saturation percentage |
|---|---|---|---|
| A | 6067 | 91 | 1.499918% |
| B | 6067 | 88 | 1.450470% |
| C | 6067 | 160 | 2.637218% |
| D | 6067 | 118 | 1.944948% |
Noise dominated data is calculated using 1-second bins in cleaned event files. If a bin has >2000 counts, and if more than 50% of those come from <1% of pixels, then it is considered to be noise-dominated and hence unusable.
| Quadrant | # 1 sec bins | Bins with >0 counts | Bins with >2000 counts | High rate bins dominated by noise | Noise dominated (total time) | Noise dominated (detector-on time) | Marked lightcurve |
|---|---|---|---|---|---|---|---|
| A | 7407 | 6067 | 10 | 10 | 0.14% | 0.16% | 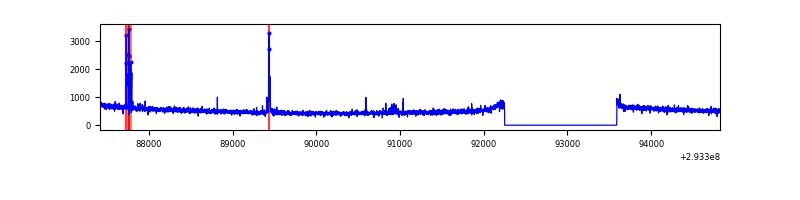 |
| B | 7407 | 6067 | 1 | 1 | 0.01% | 0.02% | 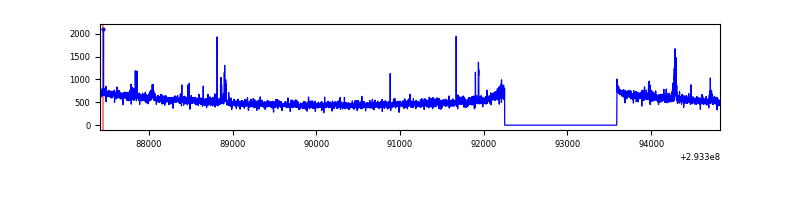 |
| C | 7407 | 6067 | 7 | 7 | 0.09% | 0.12% | 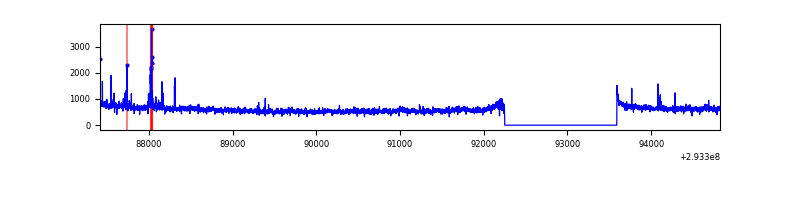 |
| D | 7407 | 6067 | 33 | 33 | 0.45% | 0.54% | 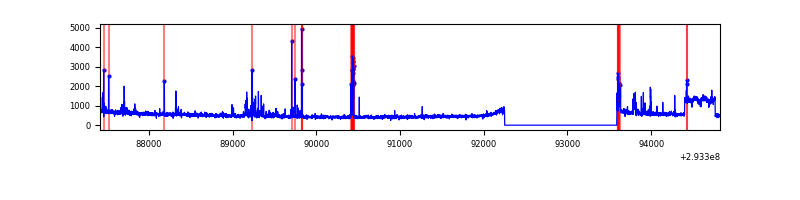 |
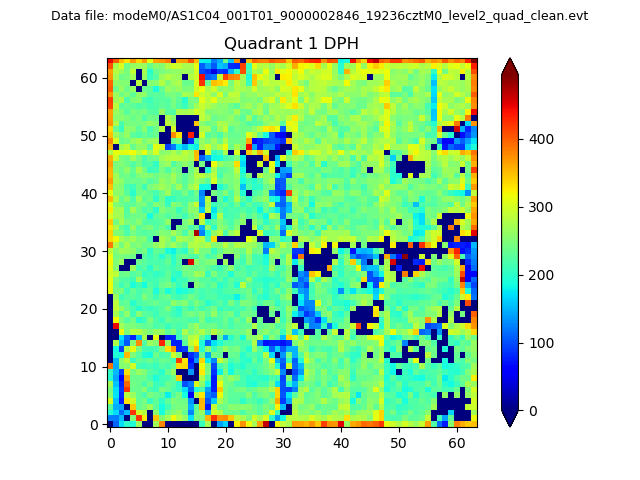
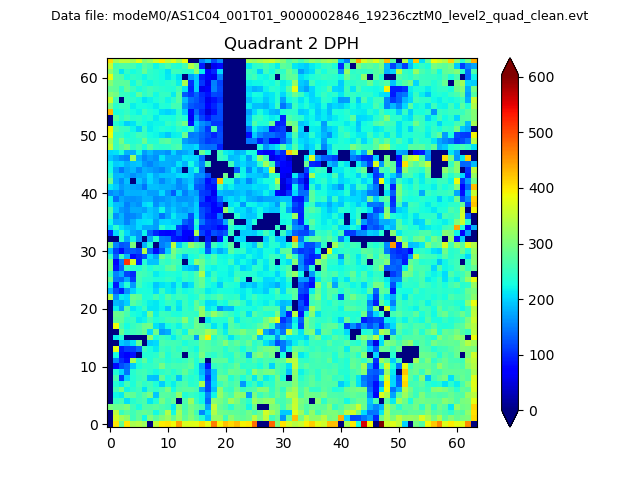
Top three noisy pixels from each quadrant. If the there are fewer than three noisy pixels in the level2.evt file, extra rows are filled as -1
| Pixel properties | Quadrant properties | ||||||
|---|---|---|---|---|---|---|---|
| Quadrant | DetID | PixID | Counts | Sigma | Mean | Median | Sigma |
| A | 13 | 170 | 38007 | 232.88 | 801 | 787 | 159.8 |
| A | 13 | 252 | 34843 | 213.09 | 801 | 787 | 159.8 |
| A | 13 | 254 | 8051 | 45.45 | 801 | 787 | 159.8 |
| B | 0 | 190 | 24637 | 160.65 | 808 | 788 | 148.5 |
| B | 6 | 36 | 20131 | 130.29 | 808 | 788 | 148.5 |
| B | 3 | 64 | 19915 | 128.84 | 808 | 788 | 148.5 |
| C | 3 | 233 | 371346 | 2056.38 | 792 | 797 | 180.2 |
| C | 14 | 238 | 126995 | 700.34 | 792 | 797 | 180.2 |
| C | 0 | 207 | 79304 | 435.68 | 792 | 797 | 180.2 |
| D | 9 | 68 | 340588 | 1773.61 | 798 | 774 | 191.6 |
| D | 12 | 16 | 61502 | 316.96 | 798 | 774 | 191.6 |
| D | 7 | 96 | 52753 | 271.3 | 798 | 774 | 191.6 |
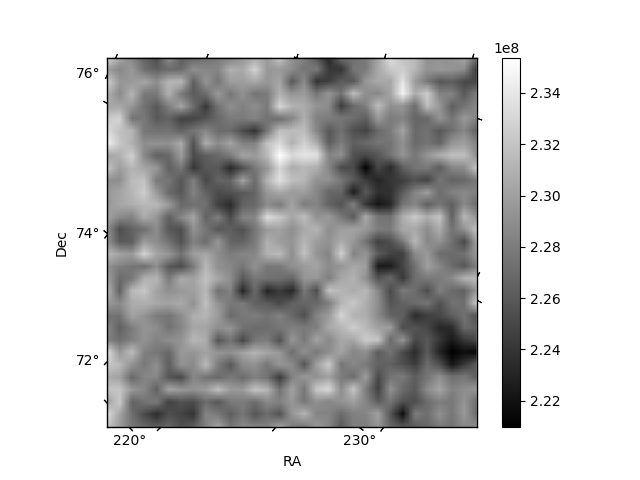
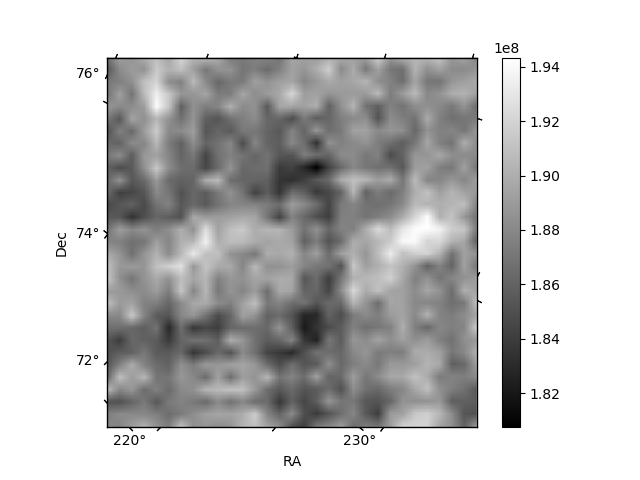
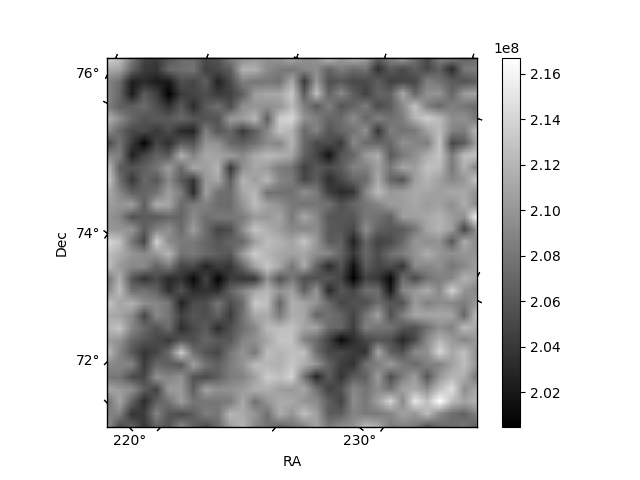
Histogram calculated using DETX and DETY for each event in the final _common_clean file
| Quadrant A | 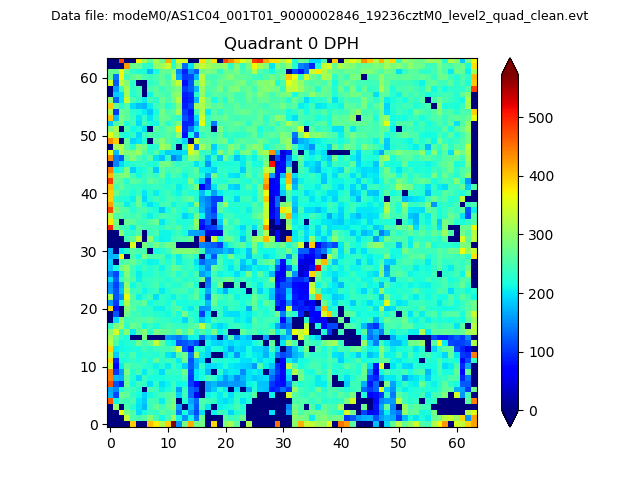 |
 |
Quadrant B |
|---|---|---|---|
| Quadrant D | 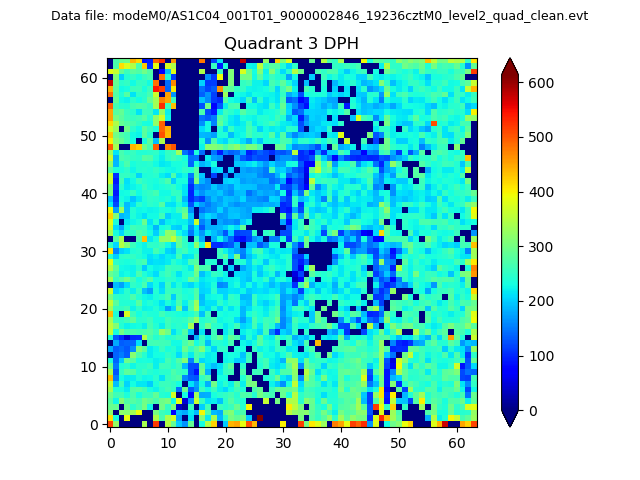 |
 |
Quadrant C |
| Plot type | Count rate plots | Images |
|---|---|---|
| Comparison with Poisson distribution Blue bars denote a histogram of data divided into 1 sec bins. Red curve is a Poisson curve with rate = median count rate of data. |
 |
 |
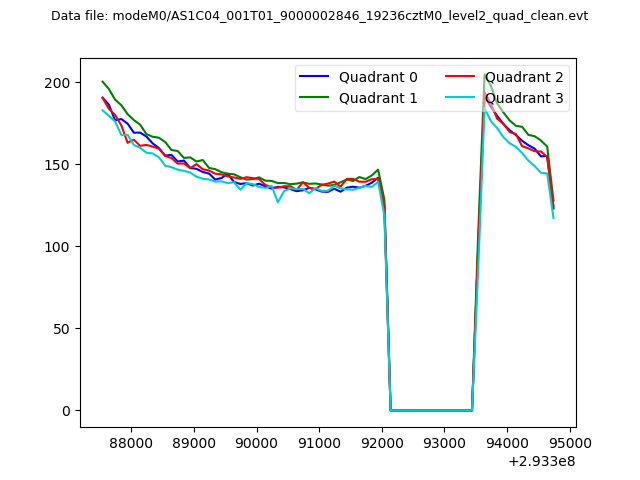
| Quadrant-wise count rates Data is divided into 100 sec bins |
 |
|
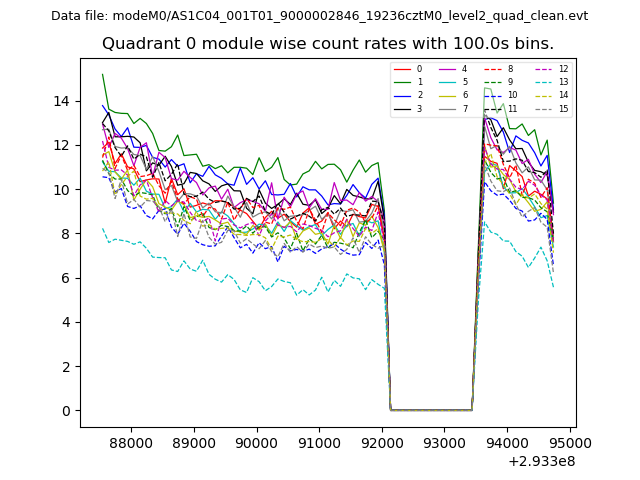
| Module-wise count rates for Quadrant A Data is divided into 100 sec bins |
 |
 |
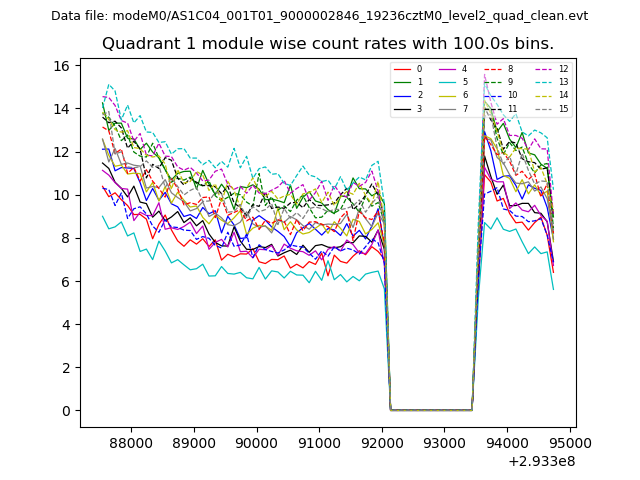
| Module-wise count rates for Quadrant B Data is divided into 100 sec bins |
 |
 |
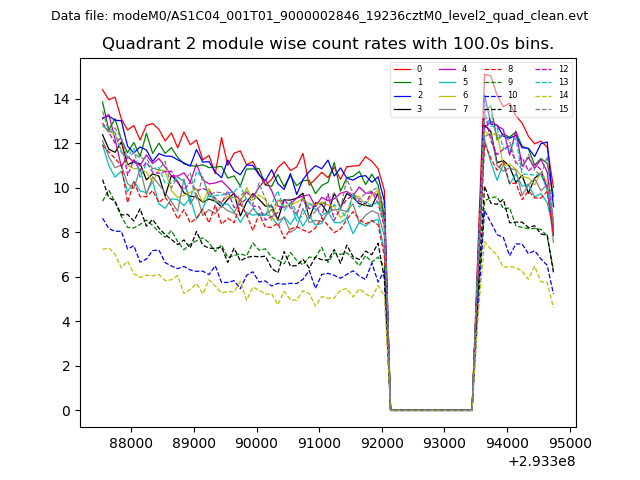
| Module-wise count rates for Quadrant C Data is divided into 100 sec bins |
 |
 |
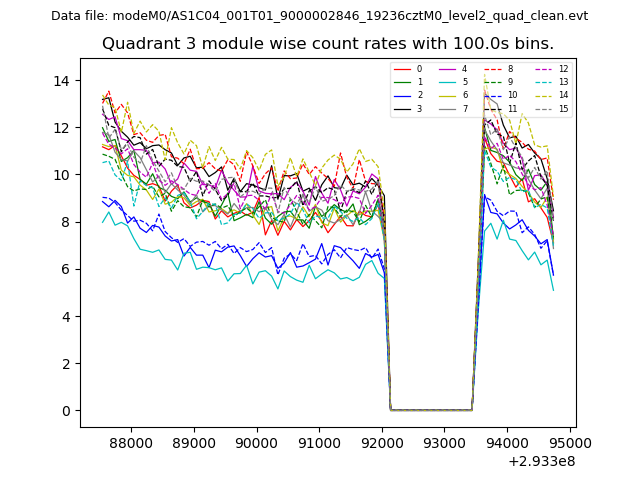
| Module-wise count rates for Quadrant D Data is divided into 100 sec bins |
 |
 |
| Parameter | Plot |
|---|---|
| CZT HV Monitor | 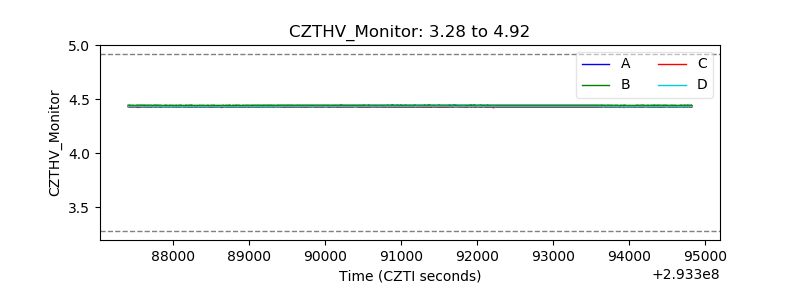 |
| D_VDD | 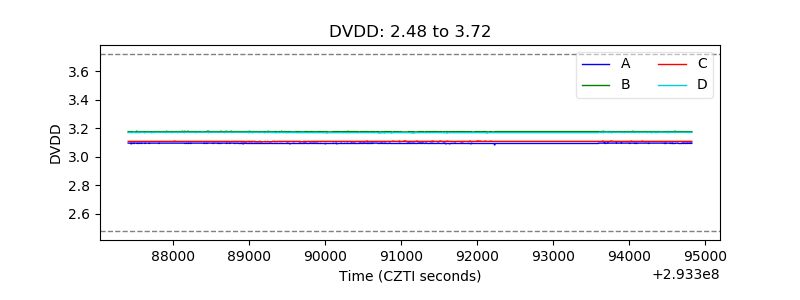 |
| Temperature 1 | 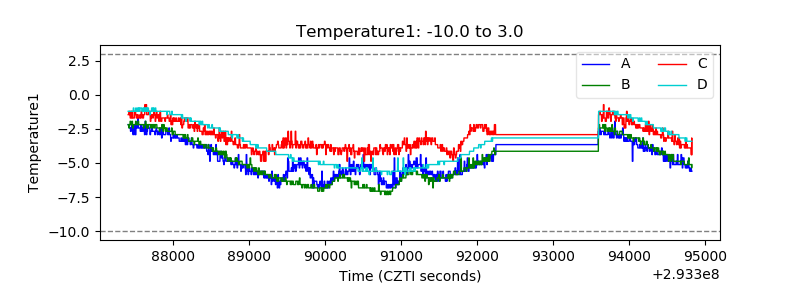 |
| Veto HV Monitor | 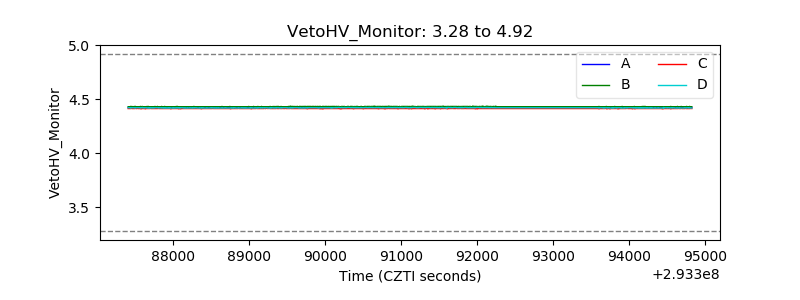 |
| Veto LLD | 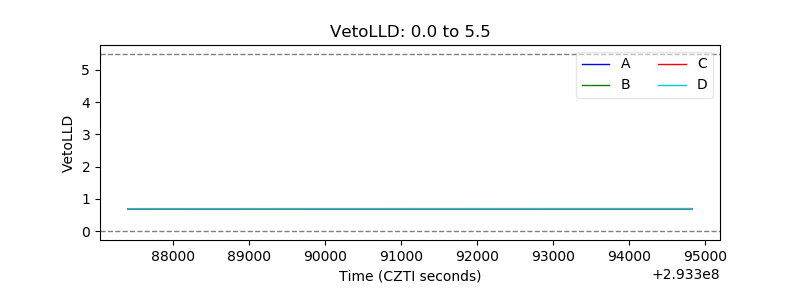 |
| Alpha Counter | 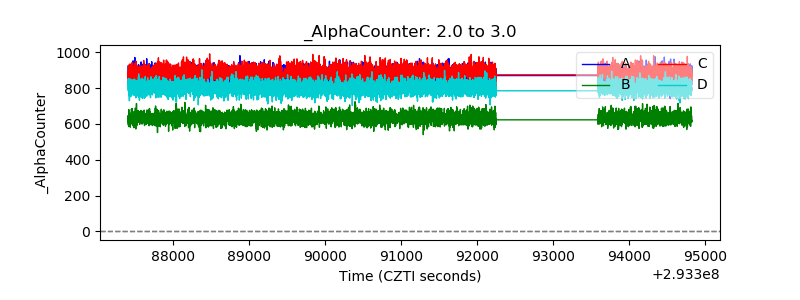 |
| _CPM_Rate | 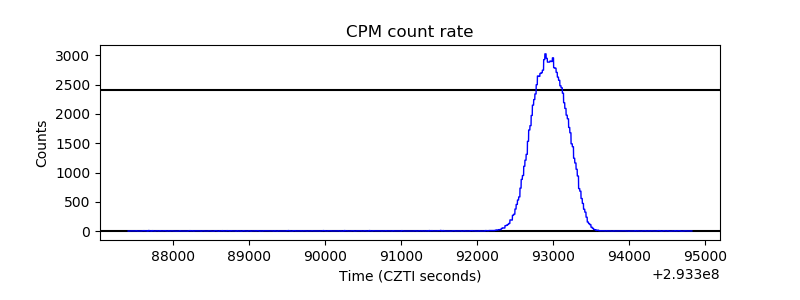 |
| CZT Counter |  |
| +2.5 Volts monitor |  |
| +5 Volts monitor | 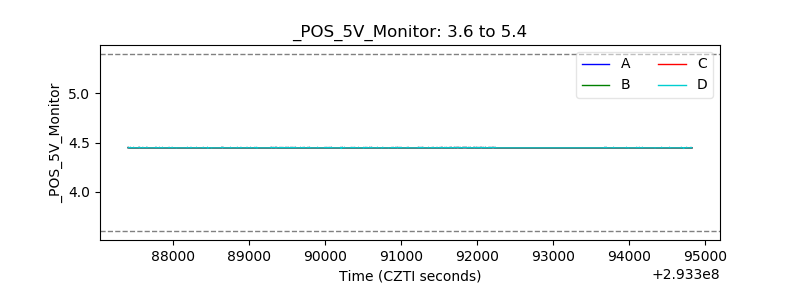 |
| _ROLL_ROT |  |
| _Roll_DEC | 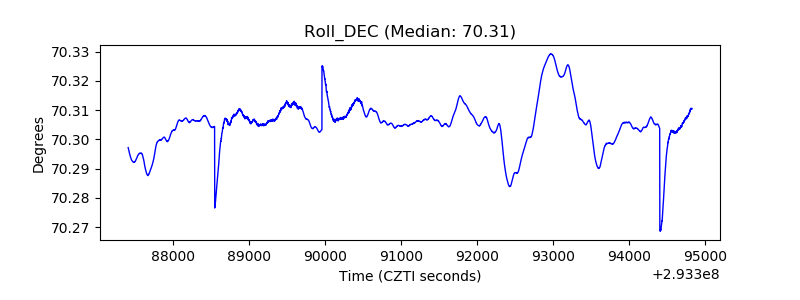 |
| _Roll_RA |  |
| Veto Counter | 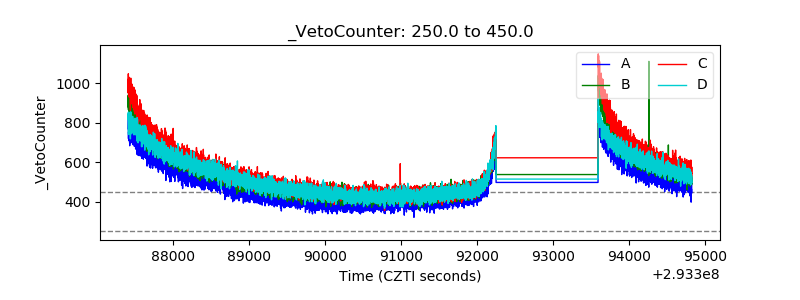 |