| Param | Original file | Final file |
|---|---|---|
| Filename | modeM0/AS1C04_001T01_9000002846_19237cztM0_level2.evt | modeM0/AS1C04_001T01_9000002846_19237cztM0_level2_quad_clean.evt |
| Size (bytes) | 458,487,360 | 125,763,840 |
| Size | 437.2 MB | 119.9 MB |
| Events in quadrant A | 3,149,559 | 834,930 |
| Events in quadrant B | 3,216,397 | 869,331 |
| Events in quadrant C | 3,582,118 | 851,143 |
| Events in quadrant D | 3,515,987 | 820,946 |
| Mode M9 | |||
|---|---|---|---|
| Quadrant | BADHDUFLAG | Total packets | Discarded packets |
| A | 0 | 17 | 0 |
| B | 0 | 18 | 0 |
| C | 0 | 18 | 0 |
| D | 0 | 18 | 0 |
| Mode SS | |||
|---|---|---|---|
| Quadrant | BADHDUFLAG | Total packets | Discarded packets |
| A | 0 | 126 | 0 |
| B | 0 | 126 | 0 |
| C | 0 | 126 | 0 |
| D | 0 | 126 | 0 |
| Mode M0 | |||
|---|---|---|---|
| Quadrant | BADHDUFLAG | Total packets | Discarded packets |
| A | 0 | 13432 | 1 |
| B | 0 | 13621 | 1 |
| C | 0 | 14752 | 1 |
| D | 0 | 14761 | 1 |
| Quadrant | Total seconds | Saturated seconds | Saturation percentage |
|---|---|---|---|
| A | 6204 | 80 | 1.289491% |
| B | 6204 | 102 | 1.644101% |
| C | 6203 | 153 | 2.466548% |
| D | 6203 | 112 | 1.805578% |
Noise dominated data is calculated using 1-second bins in cleaned event files. If a bin has >2000 counts, and if more than 50% of those come from <1% of pixels, then it is considered to be noise-dominated and hence unusable.
| Quadrant | # 1 sec bins | Bins with >0 counts | Bins with >2000 counts | High rate bins dominated by noise | Noise dominated (total time) | Noise dominated (detector-on time) | Marked lightcurve |
|---|---|---|---|---|---|---|---|
| A | 7529 | 6205 | 5 | 5 | 0.07% | 0.08% | 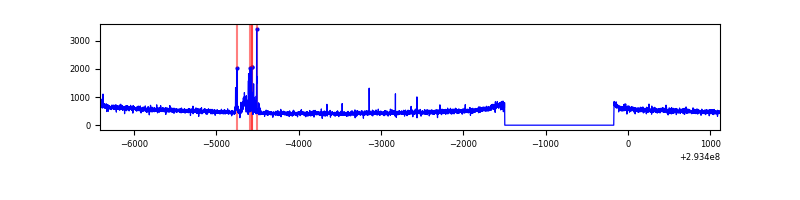 |
| B | 7529 | 6204 | 2 | 2 | 0.03% | 0.03% | 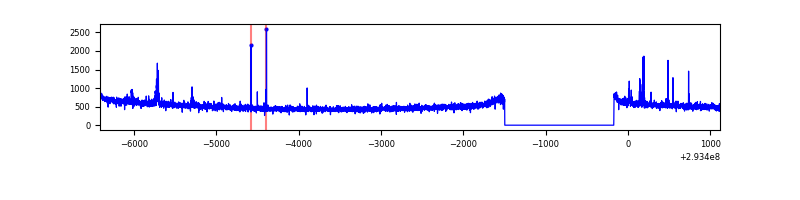 |
| C | 7528 | 6204 | 0 | 0 | 0.00% | 0.00% | 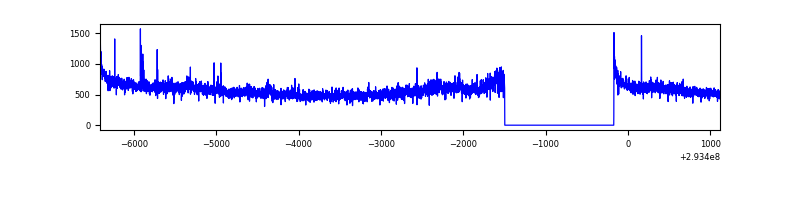 |
| D | 7528 | 6204 | 16 | 16 | 0.21% | 0.26% | 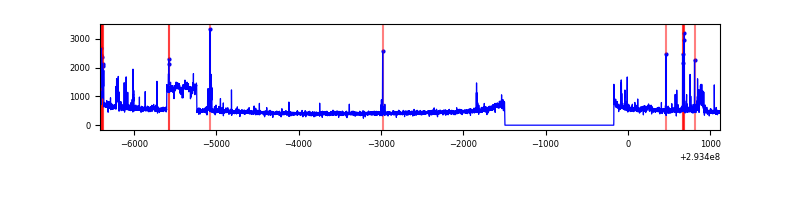 |
Top three noisy pixels from each quadrant. If the there are fewer than three noisy pixels in the level2.evt file, extra rows are filled as -1
| Pixel properties | Quadrant properties | ||||||
|---|---|---|---|---|---|---|---|
| Quadrant | DetID | PixID | Counts | Sigma | Mean | Median | Sigma |
| A | 13 | 252 | 85802 | 530.42 | 795 | 779 | 160.3 |
| A | 13 | 254 | 8574 | 48.63 | 795 | 779 | 160.3 |
| A | 0 | 226 | 6788 | 37.49 | 795 | 779 | 160.3 |
| B | 0 | 190 | 30657 | 202.98 | 804 | 787 | 147.2 |
| B | 6 | 36 | 24587 | 161.73 | 804 | 787 | 147.2 |
| B | 12 | 111 | 16539 | 107.04 | 804 | 787 | 147.2 |
| C | 3 | 233 | 353756 | 1953.21 | 791 | 797 | 180.7 |
| C | 14 | 238 | 126368 | 694.89 | 791 | 797 | 180.7 |
| C | 0 | 207 | 15385 | 80.73 | 791 | 797 | 180.7 |
| D | 9 | 68 | 452320 | 2406.9 | 791 | 771 | 187.6 |
| D | 2 | 234 | 25823 | 133.54 | 791 | 771 | 187.6 |
| D | 15 | 145 | 17074 | 86.9 | 791 | 771 | 187.6 |
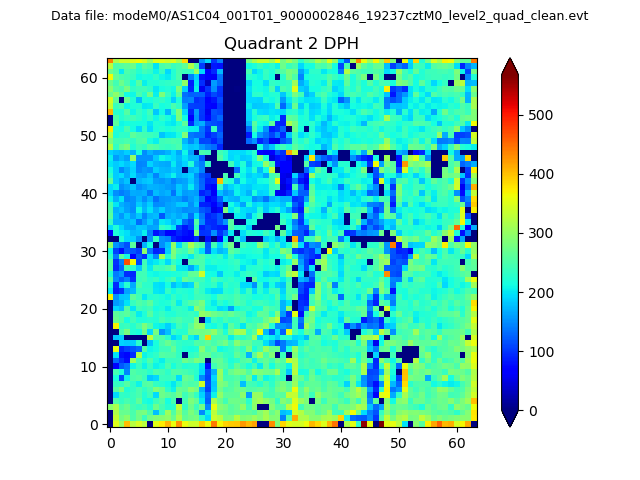
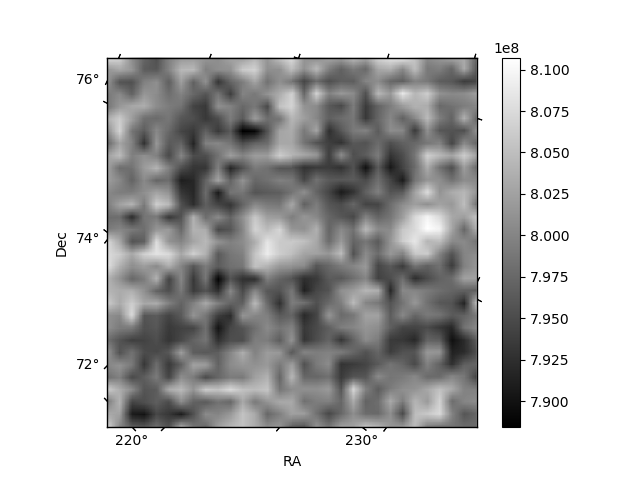
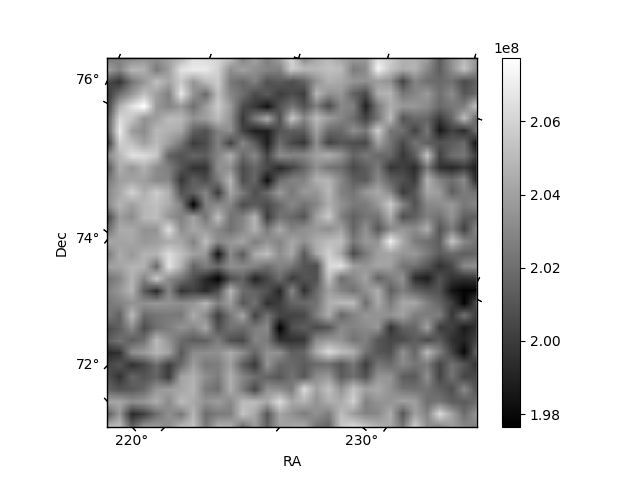
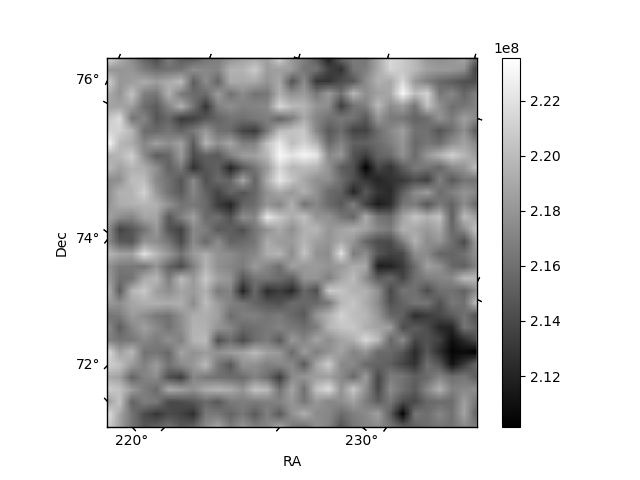
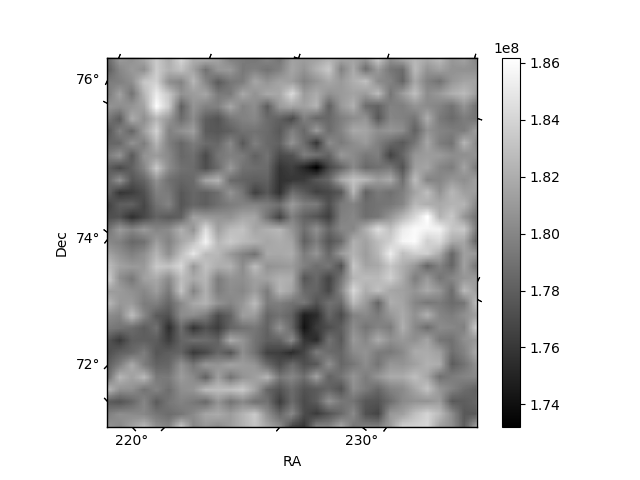
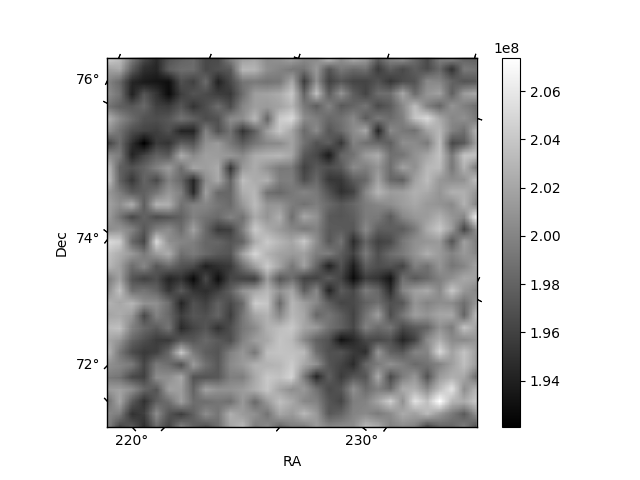
Histogram calculated using DETX and DETY for each event in the final _common_clean file
| Quadrant A | 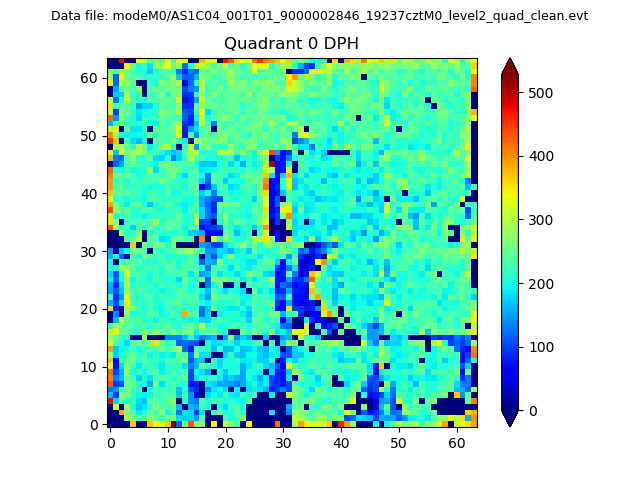 |
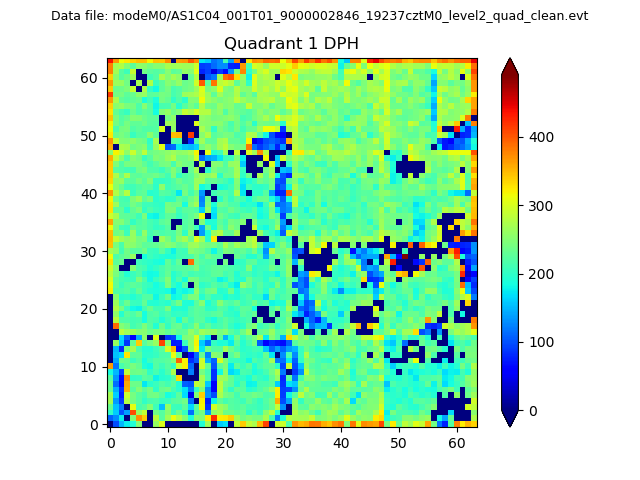 |
Quadrant B |
|---|---|---|---|
| Quadrant D | 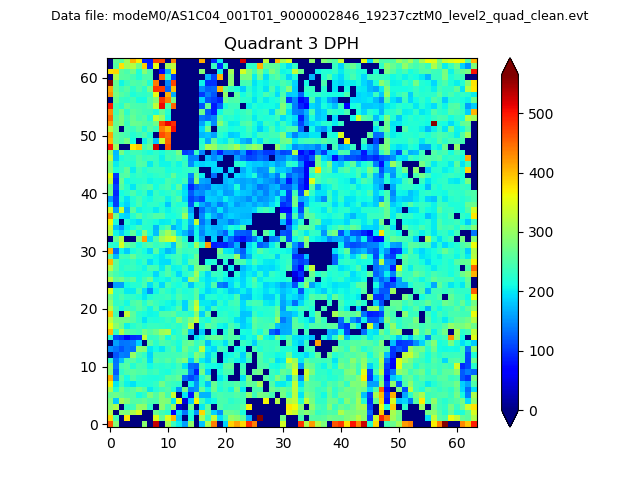 |
 |
Quadrant C |
| Plot type | Count rate plots | Images |
|---|---|---|
| Comparison with Poisson distribution Blue bars denote a histogram of data divided into 1 sec bins. Red curve is a Poisson curve with rate = median count rate of data. |
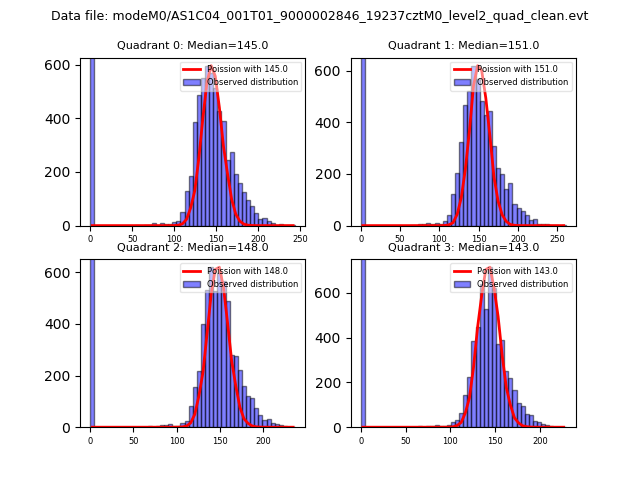 |
 |
| Quadrant-wise count rates Data is divided into 100 sec bins |
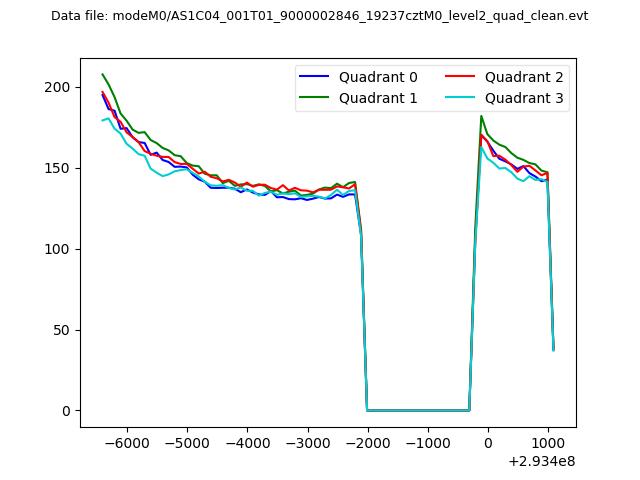 |
|
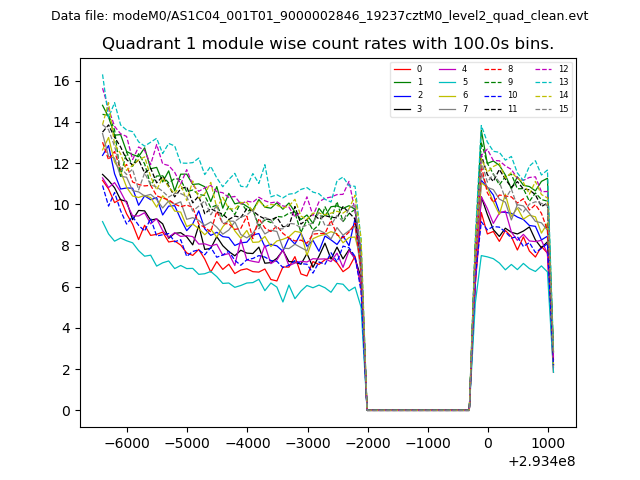
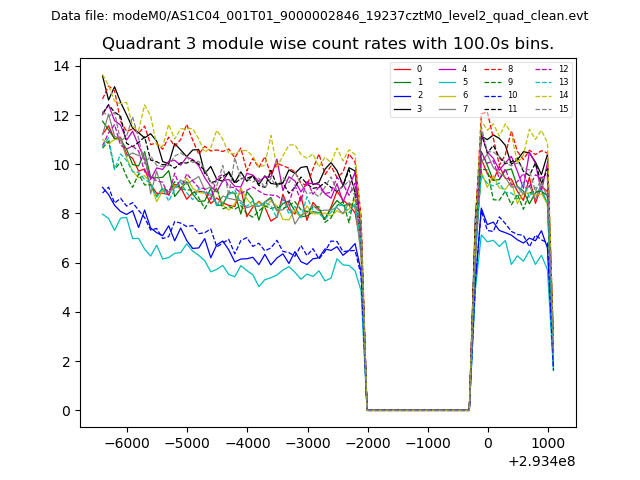
| Module-wise count rates for Quadrant A Data is divided into 100 sec bins |
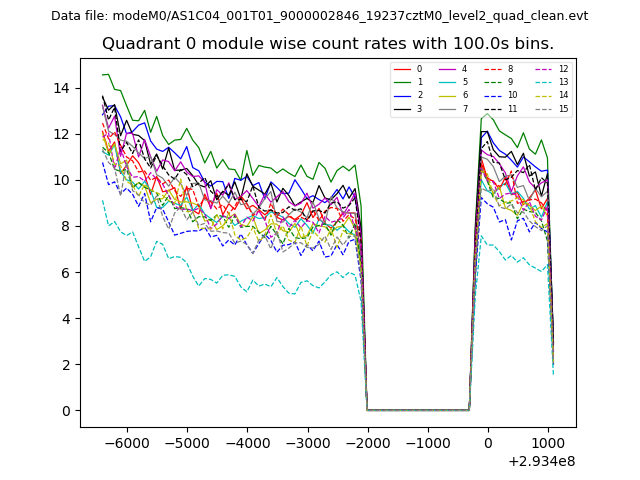 |
 |
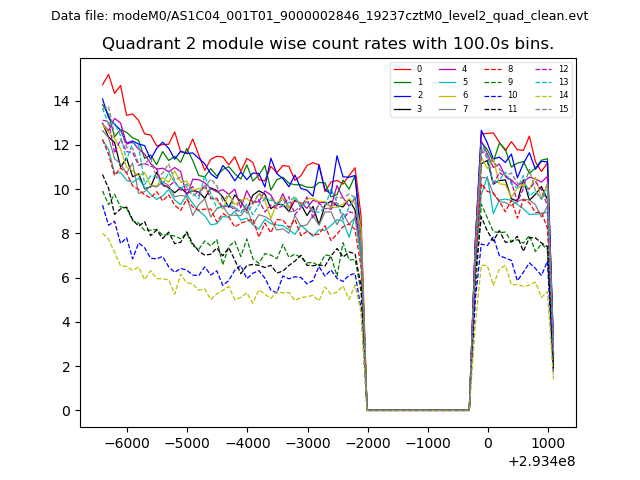
| Module-wise count rates for Quadrant B Data is divided into 100 sec bins |
 |
 |
| Module-wise count rates for Quadrant C Data is divided into 100 sec bins |
 |
 |
| Module-wise count rates for Quadrant D Data is divided into 100 sec bins |
 |
 |
| Parameter | Plot |
|---|---|
| CZT HV Monitor | 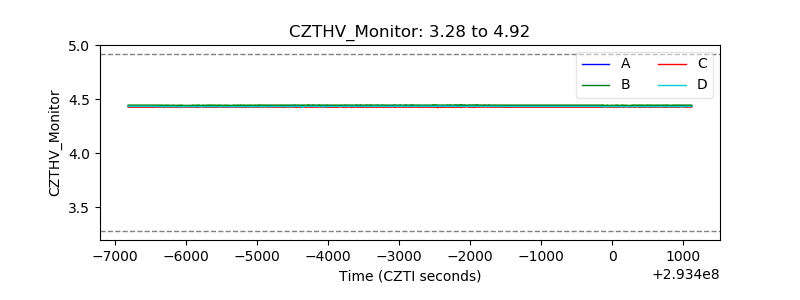 |
| D_VDD | 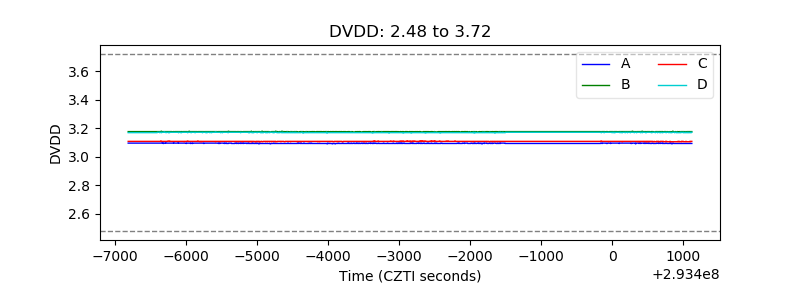 |
| Temperature 1 | 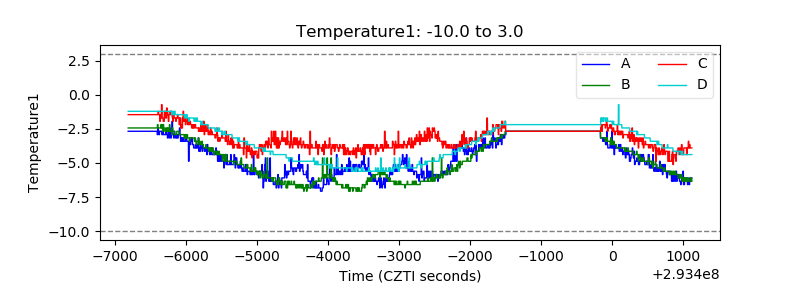 |
| Veto HV Monitor | 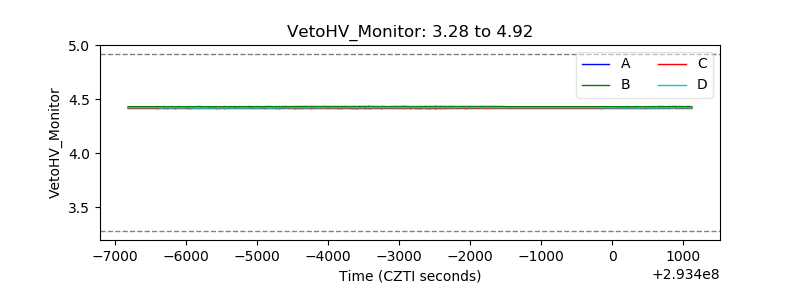 |
| Veto LLD | 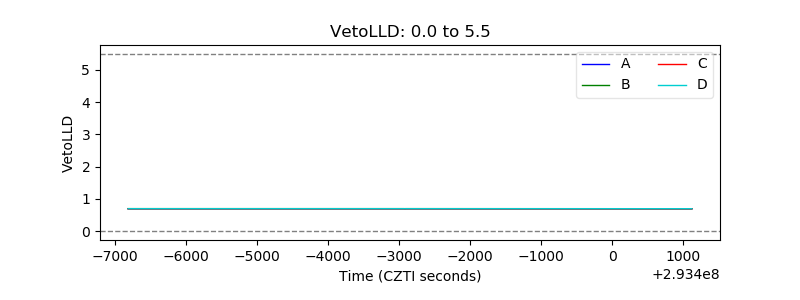 |
| Alpha Counter | 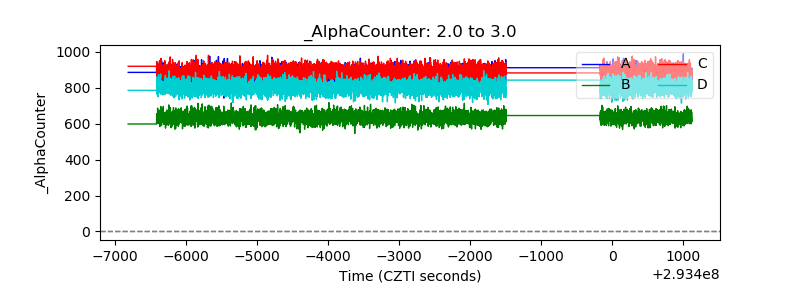 |
| _CPM_Rate | 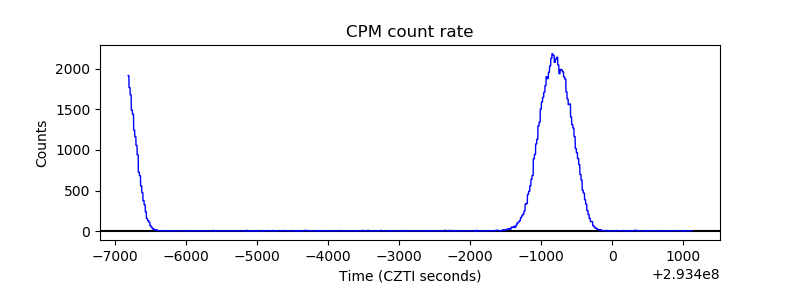 |
| CZT Counter | 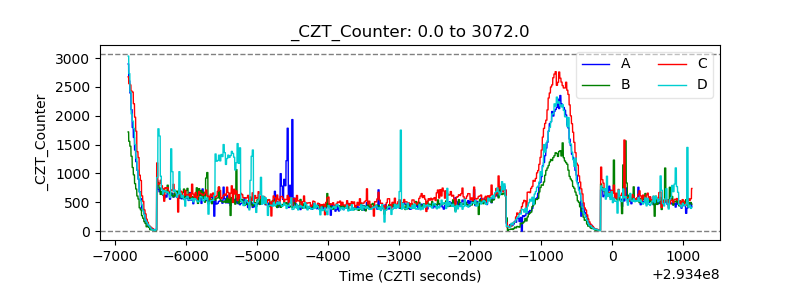 |
| +2.5 Volts monitor |  |
| +5 Volts monitor |  |
| _ROLL_ROT | 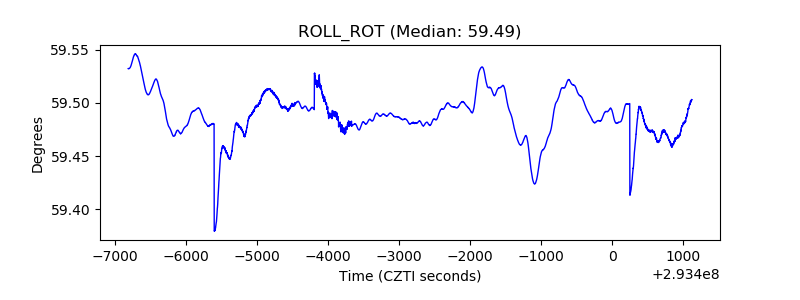 |
| _Roll_DEC | 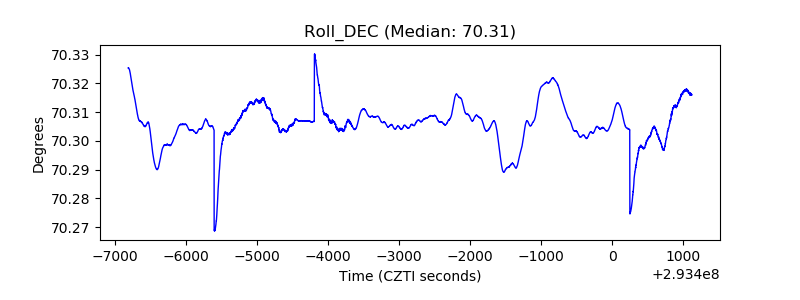 |
| _Roll_RA | 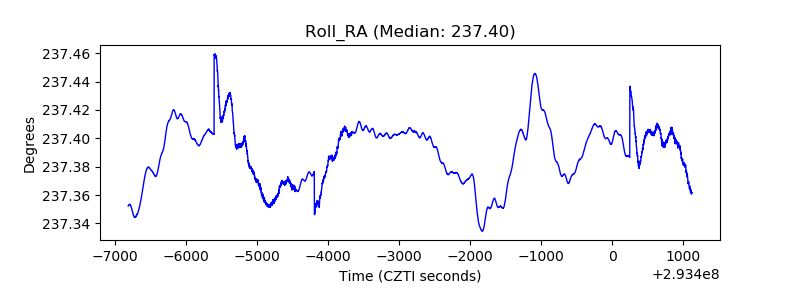 |
| Veto Counter | 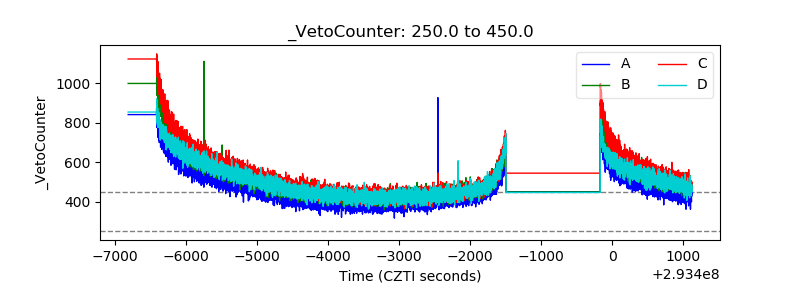 |