| Param | Original file | Final file |
|---|---|---|
| Filename | modeM0/AS1C04_001T01_9000002846_19241cztM0_level2.evt | modeM0/AS1C04_001T01_9000002846_19241cztM0_level2_quad_clean.evt |
| Size (bytes) | 774,918,720 | 129,669,120 |
| Size | 739.0 MB | 123.7 MB |
| Events in quadrant A | 3,789,890 | 871,275 |
| Events in quadrant B | 4,110,878 | 889,255 |
| Events in quadrant C | 4,465,887 | 866,930 |
| Events in quadrant D | 10,546,195 | 728,386 |
| Mode M9 | |||
|---|---|---|---|
| Quadrant | BADHDUFLAG | Total packets | Discarded packets |
| A | 0 | 5 | 0 |
| B | 0 | 5 | 0 |
| C | 0 | 5 | 0 |
| D | 0 | 5 | 0 |
| Mode SS | |||
|---|---|---|---|
| Quadrant | BADHDUFLAG | Total packets | Discarded packets |
| A | 0 | 168 | 0 |
| B | 0 | 168 | 0 |
| C | 0 | 168 | 0 |
| D | 0 | 168 | 0 |
| Mode M0 | |||
|---|---|---|---|
| Quadrant | BADHDUFLAG | Total packets | Discarded packets |
| A | 0 | 17046 | 2 |
| B | 0 | 17879 | 3 |
| C | 0 | 18697 | 2 |
| D | 0 | 36973 | 2 |
| Quadrant | Total seconds | Saturated seconds | Saturation percentage |
|---|---|---|---|
| A | 8209 | 91 | 1.108539% |
| B | 8209 | 213 | 2.594713% |
| C | 8209 | 224 | 2.728712% |
| D | 8209 | 2536 | 30.892922% |
Noise dominated data is calculated using 1-second bins in cleaned event files. If a bin has >2000 counts, and if more than 50% of those come from <1% of pixels, then it is considered to be noise-dominated and hence unusable.
| Quadrant | # 1 sec bins | Bins with >0 counts | Bins with >2000 counts | High rate bins dominated by noise | Noise dominated (total time) | Noise dominated (detector-on time) | Marked lightcurve |
|---|---|---|---|---|---|---|---|
| A | 8709 | 8212 | 0 | 0 | 0.00% | 0.00% | 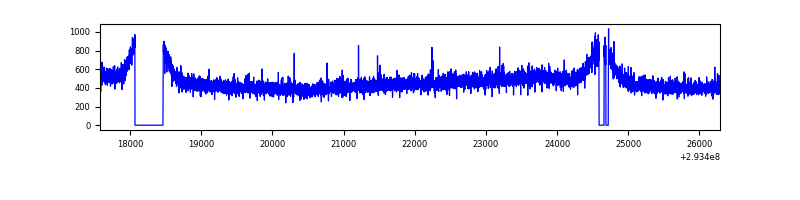 |
| B | 8709 | 8212 | 25 | 25 | 0.29% | 0.30% | 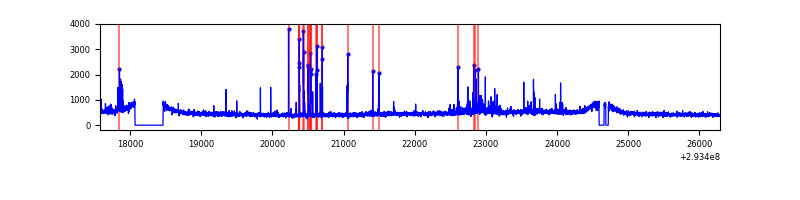 |
| C | 8709 | 8212 | 13 | 13 | 0.15% | 0.16% | 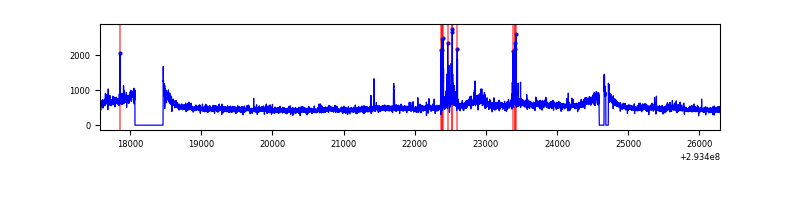 |
| D | 8709 | 8211 | 2254 | 2254 | 25.88% | 27.45% | 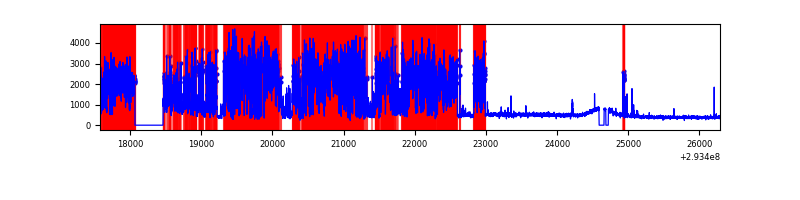 |
Top three noisy pixels from each quadrant. If the there are fewer than three noisy pixels in the level2.evt file, extra rows are filled as -1
| Pixel properties | Quadrant properties | ||||||
|---|---|---|---|---|---|---|---|
| Quadrant | DetID | PixID | Counts | Sigma | Mean | Median | Sigma |
| A | 13 | 254 | 11577 | 53.25 | 981 | 960 | 199.4 |
| A | 0 | 226 | 8345 | 37.04 | 981 | 960 | 199.4 |
| A | 3 | 137 | 8185 | 36.24 | 981 | 960 | 199.4 |
| B | 4 | 80 | 106740 | 559.3 | 985 | 956 | 189.1 |
| B | 7 | 220 | 98675 | 516.66 | 985 | 956 | 189.1 |
| B | 12 | 111 | 23352 | 118.41 | 985 | 956 | 189.1 |
| C | 3 | 233 | 482406 | 2163.93 | 953 | 956 | 222.5 |
| C | 14 | 238 | 146947 | 656.17 | 953 | 956 | 222.5 |
| C | 0 | 207 | 117569 | 524.13 | 953 | 956 | 222.5 |
| D | 5 | 222 | 7214829 | 35300.04 | 840 | 812 | 204.4 |
| D | 13 | 104 | 70027 | 338.69 | 840 | 812 | 204.4 |
| D | 1 | 52 | 66071 | 319.33 | 840 | 812 | 204.4 |
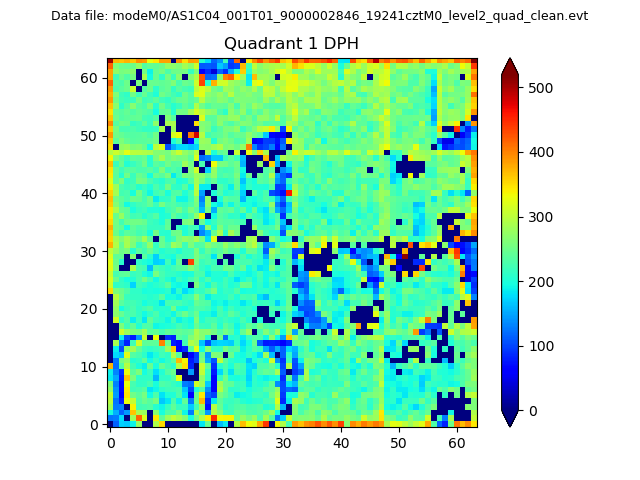
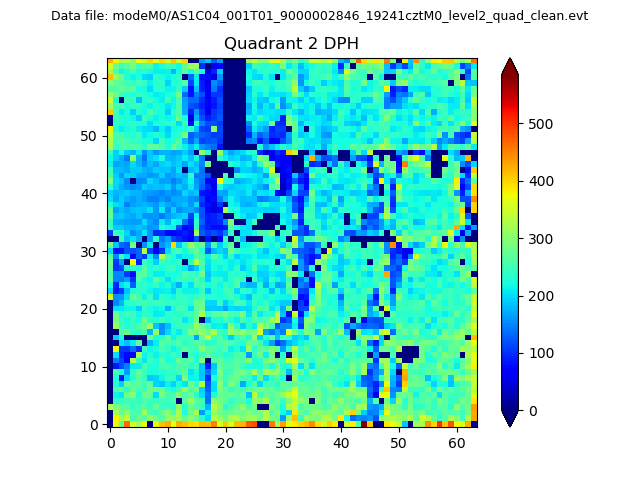
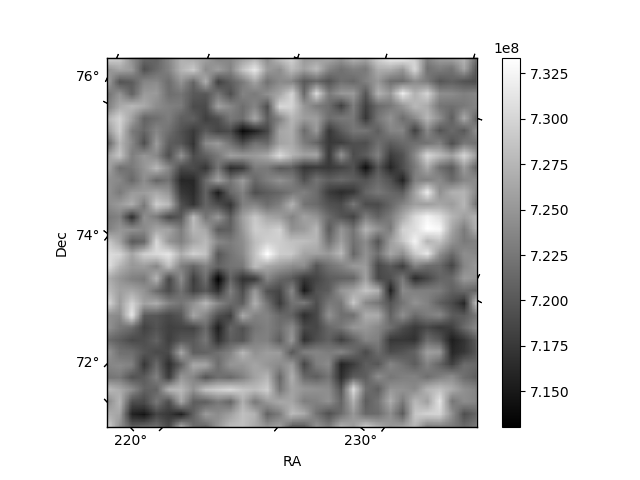
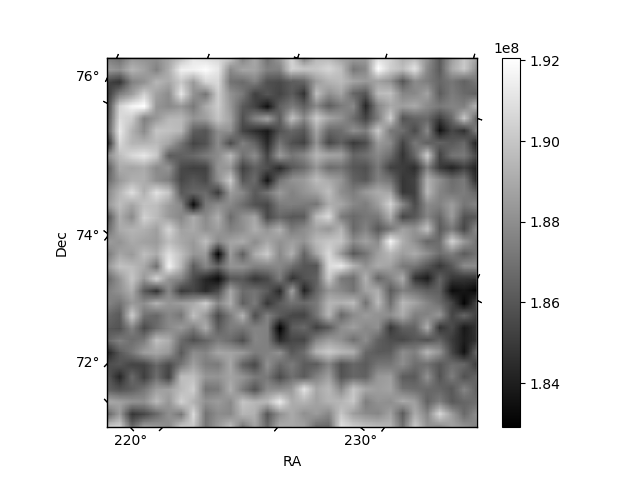
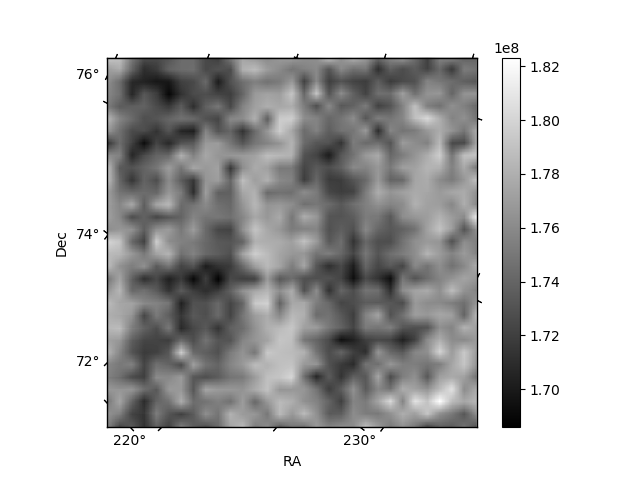
Histogram calculated using DETX and DETY for each event in the final _common_clean file
| Quadrant A |  |
 |
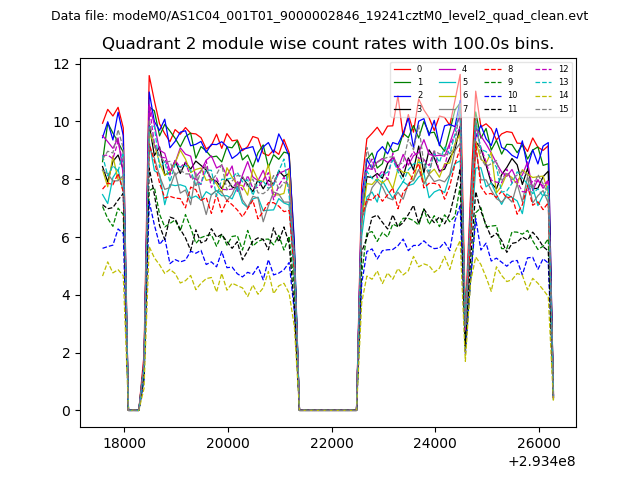
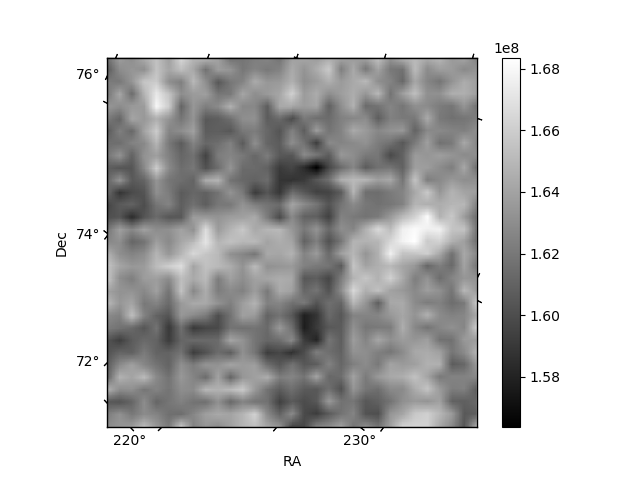
Quadrant B |
|---|---|---|---|
| Quadrant D | 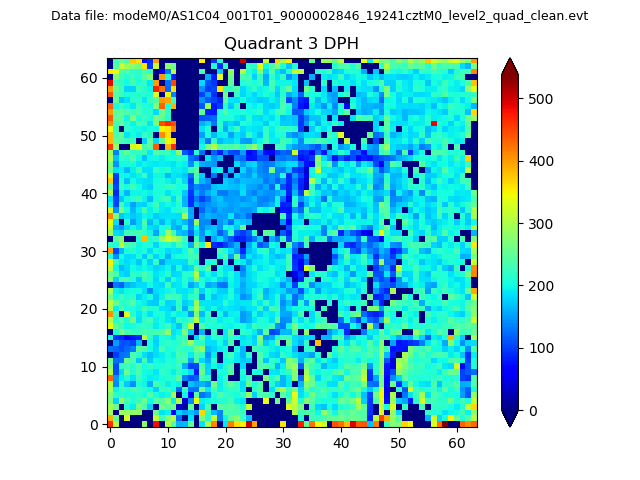 |
 |
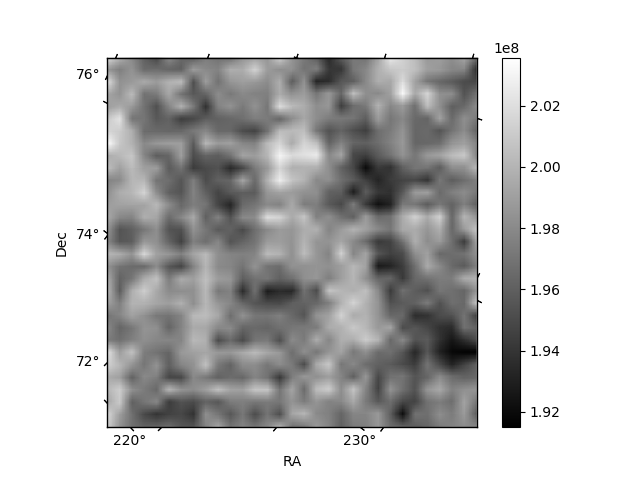
Quadrant C |
| Plot type | Count rate plots | Images |
|---|---|---|
| Comparison with Poisson distribution Blue bars denote a histogram of data divided into 1 sec bins. Red curve is a Poisson curve with rate = median count rate of data. |
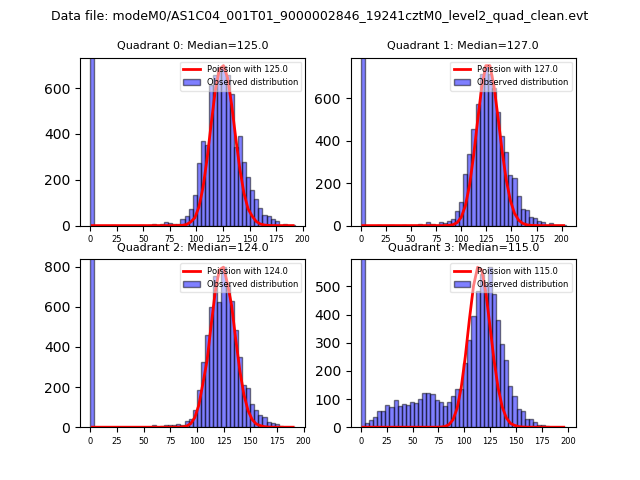 |
 |
| Quadrant-wise count rates Data is divided into 100 sec bins |
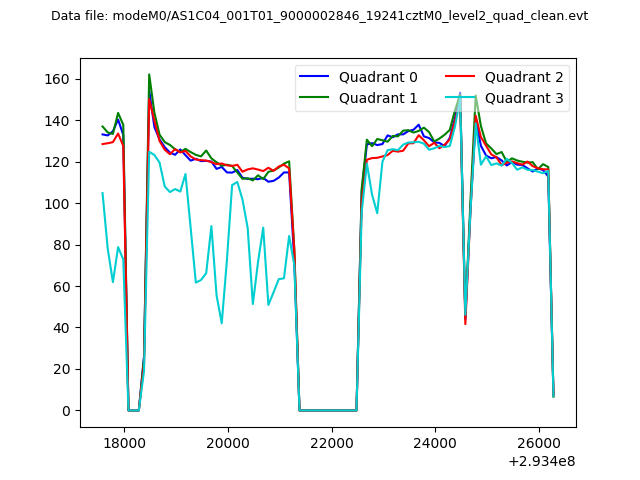 |
|
| Module-wise count rates for Quadrant A Data is divided into 100 sec bins |
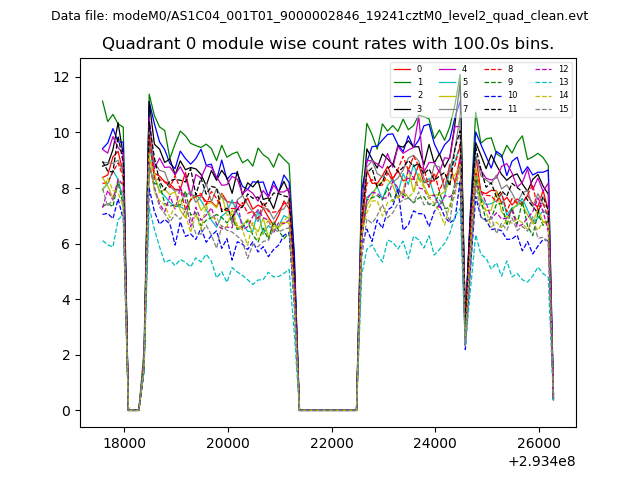 |
 |
| Module-wise count rates for Quadrant B Data is divided into 100 sec bins |
 |
 |
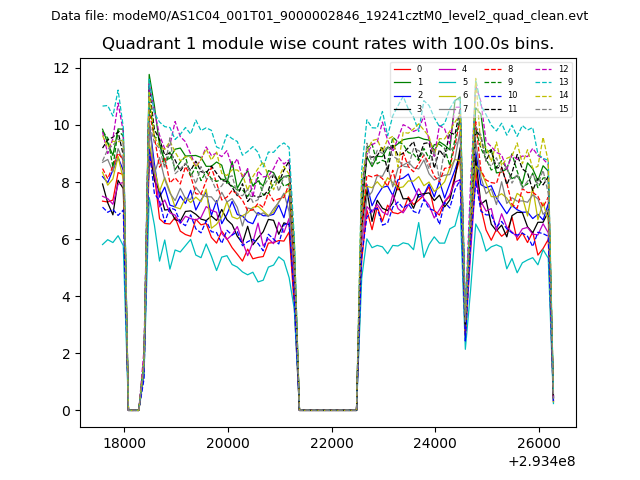
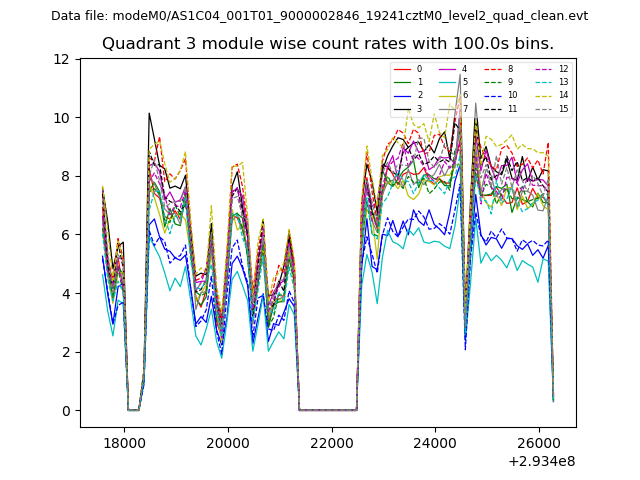
| Module-wise count rates for Quadrant C Data is divided into 100 sec bins |
 |
 |
| Module-wise count rates for Quadrant D Data is divided into 100 sec bins |
 |
 |
| Parameter | Plot |
|---|---|
| CZT HV Monitor | 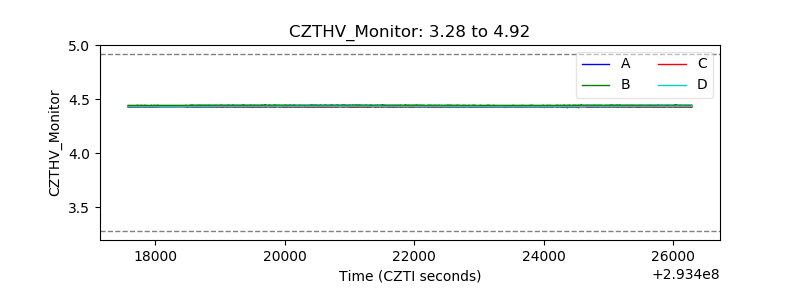 |
| D_VDD | 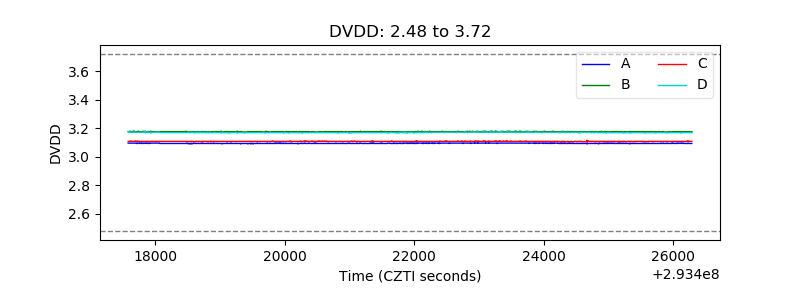 |
| Temperature 1 | 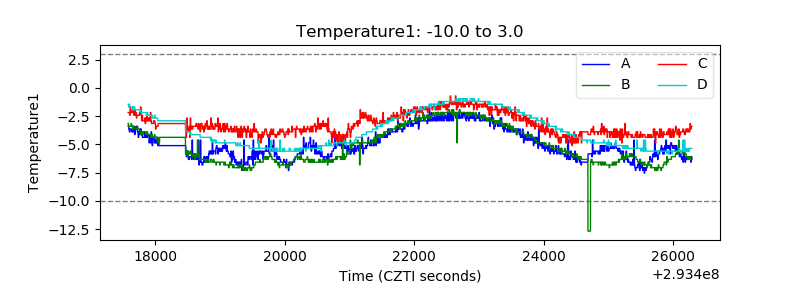 |
| Veto HV Monitor | 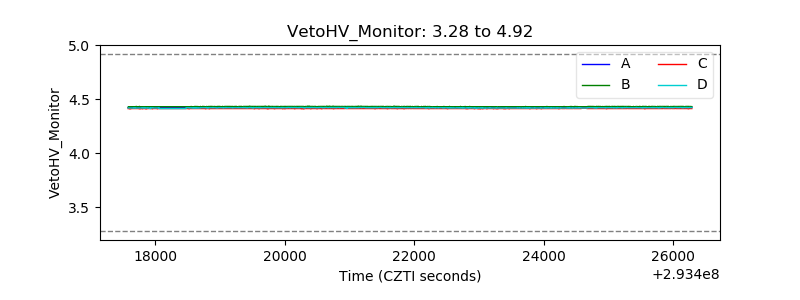 |
| Veto LLD | 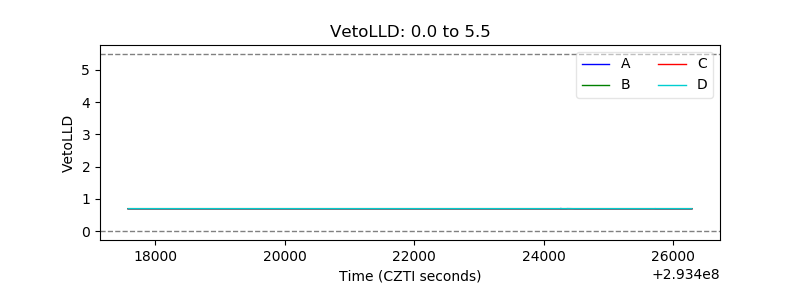 |
| Alpha Counter | 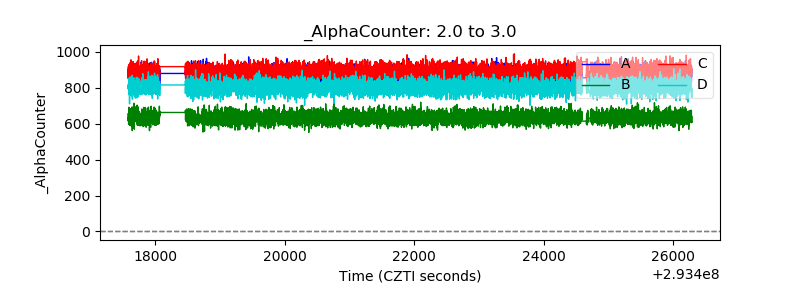 |
| _CPM_Rate | 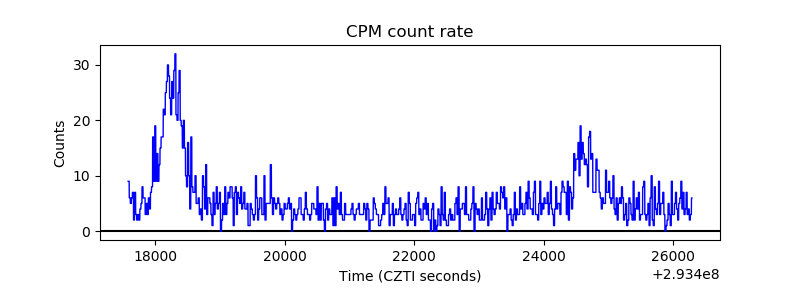 |
| CZT Counter | 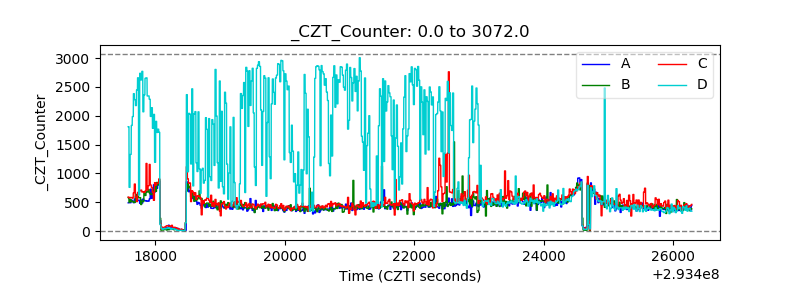 |
| +2.5 Volts monitor |  |
| +5 Volts monitor | 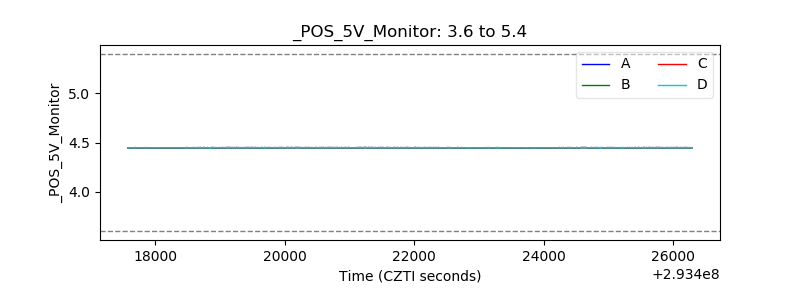 |
| _ROLL_ROT | 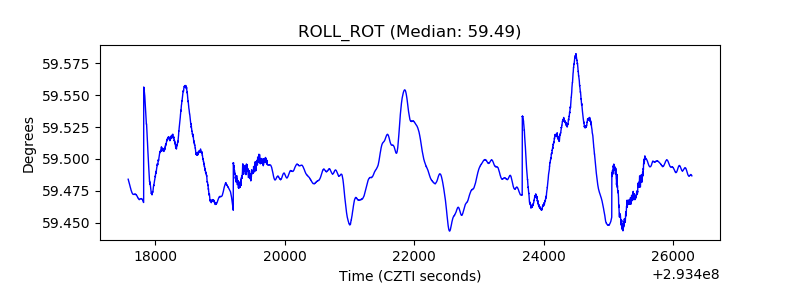 |
| _Roll_DEC | 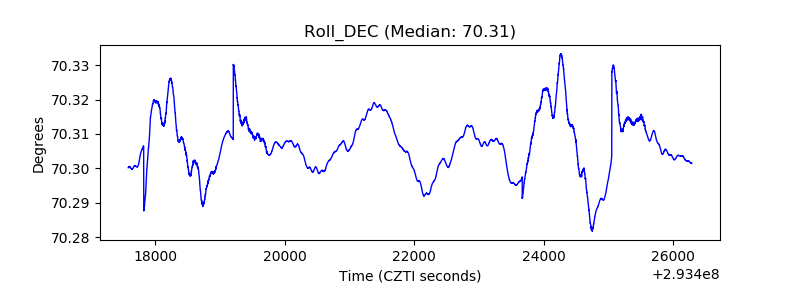 |
| _Roll_RA | 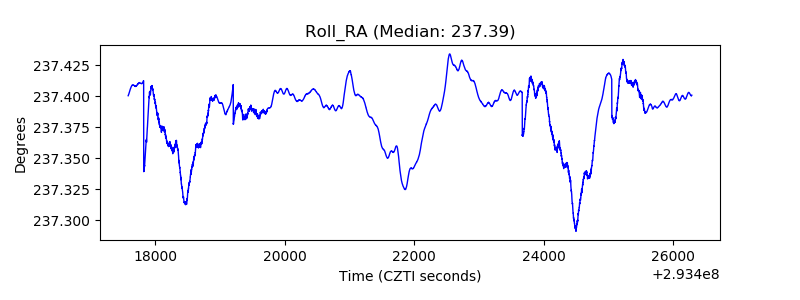 |
| Veto Counter | 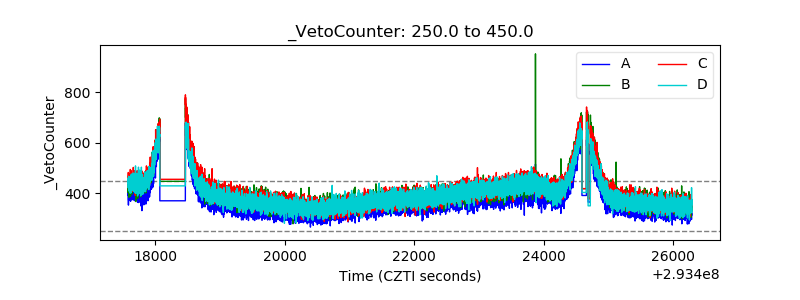 |