| Param | Original file | Final file |
|---|---|---|
| Filename | modeM0/AS1C04_001T01_9000002846_19245cztM0_level2.evt | modeM0/AS1C04_001T01_9000002846_19245cztM0_level2_quad_clean.evt |
| Size (bytes) | 1,136,214,720 | 247,417,920 |
| Size | 1.1 GB | 236.0 MB |
| Events in quadrant A | 7,860,627 | 1,585,495 |
| Events in quadrant B | 8,182,840 | 1,613,985 |
| Events in quadrant C | 8,754,608 | 1,555,278 |
| Events in quadrant D | 8,428,399 | 1,533,419 |
| Mode M9 | |||
|---|---|---|---|
| Quadrant | BADHDUFLAG | Total packets | Discarded packets |
| A | 0 | 21 | 0 |
| B | 0 | 21 | 0 |
| C | 0 | 21 | 0 |
| D | 0 | 21 | 0 |
| Mode SS | |||
|---|---|---|---|
| Quadrant | BADHDUFLAG | Total packets | Discarded packets |
| A | 0 | 356 | 0 |
| B | 0 | 356 | 0 |
| C | 0 | 356 | 0 |
| D | 0 | 356 | 0 |
| Mode M0 | |||
|---|---|---|---|
| Quadrant | BADHDUFLAG | Total packets | Discarded packets |
| A | 0 | 35274 | 3 |
| B | 0 | 35736 | 3 |
| C | 0 | 36160 | 3 |
| D | 0 | 37401 | 3 |
| Quadrant | Total seconds | Saturated seconds | Saturation percentage |
|---|---|---|---|
| A | 17491 | 96 | 0.548854% |
| B | 17492 | 135 | 0.771781% |
| C | 17492 | 155 | 0.886119% |
| D | 17492 | 187 | 1.069060% |
Noise dominated data is calculated using 1-second bins in cleaned event files. If a bin has >2000 counts, and if more than 50% of those come from <1% of pixels, then it is considered to be noise-dominated and hence unusable.
| Quadrant | # 1 sec bins | Bins with >0 counts | Bins with >2000 counts | High rate bins dominated by noise | Noise dominated (total time) | Noise dominated (detector-on time) | Marked lightcurve |
|---|---|---|---|---|---|---|---|
| A | 19586 | 17494 | 0 | 0 | 0.00% | 0.00% | 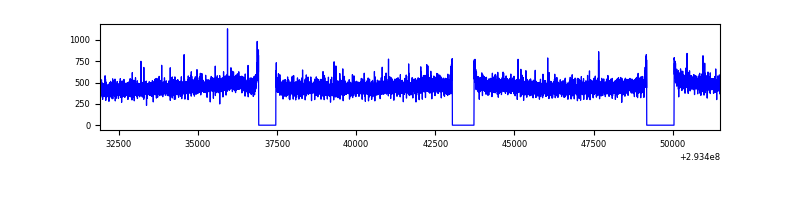 |
| B | 19587 | 17494 | 21 | 21 | 0.11% | 0.12% | 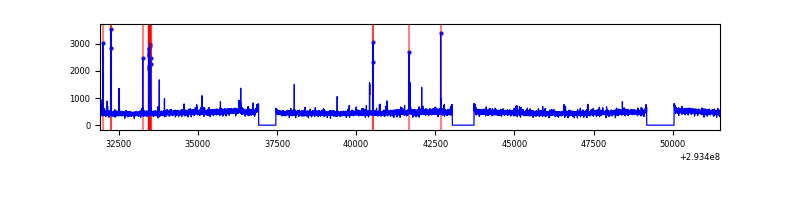 |
| C | 19587 | 17495 | 4 | 4 | 0.02% | 0.02% | 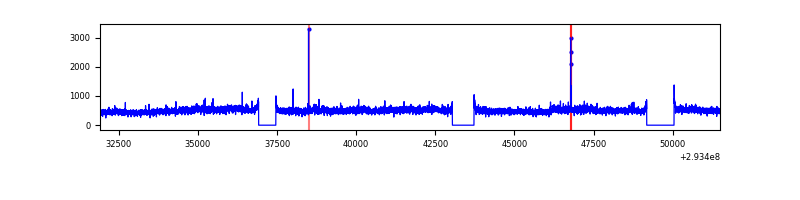 |
| D | 19587 | 17495 | 107 | 107 | 0.55% | 0.61% | 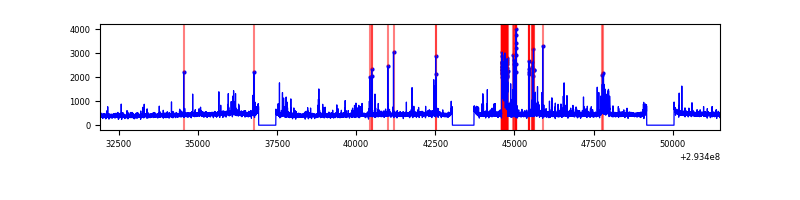 |
Top three noisy pixels from each quadrant. If the there are fewer than three noisy pixels in the level2.evt file, extra rows are filled as -1
| Pixel properties | Quadrant properties | ||||||
|---|---|---|---|---|---|---|---|
| Quadrant | DetID | PixID | Counts | Sigma | Mean | Median | Sigma |
| A | 13 | 254 | 24783 | 55.59 | 2038 | 1990 | 410.0 |
| A | 0 | 226 | 17539 | 37.92 | 2038 | 1990 | 410.0 |
| A | 3 | 137 | 16750 | 36.0 | 2038 | 1990 | 410.0 |
| B | 4 | 80 | 86891 | 220.47 | 2034 | 1979 | 385.1 |
| B | 3 | 64 | 56302 | 141.05 | 2034 | 1979 | 385.1 |
| B | 12 | 111 | 48097 | 119.75 | 2034 | 1979 | 385.1 |
| C | 3 | 233 | 760689 | 1666.79 | 1961 | 1975 | 455.2 |
| C | 14 | 238 | 304919 | 665.53 | 1961 | 1975 | 455.2 |
| C | 0 | 207 | 16246 | 31.35 | 1961 | 1975 | 455.2 |
| D | 5 | 222 | 421609 | 869.46 | 1986 | 1926 | 482.7 |
| D | 1 | 52 | 378243 | 779.62 | 1986 | 1926 | 482.7 |
| D | 2 | 234 | 76662 | 154.83 | 1986 | 1926 | 482.7 |
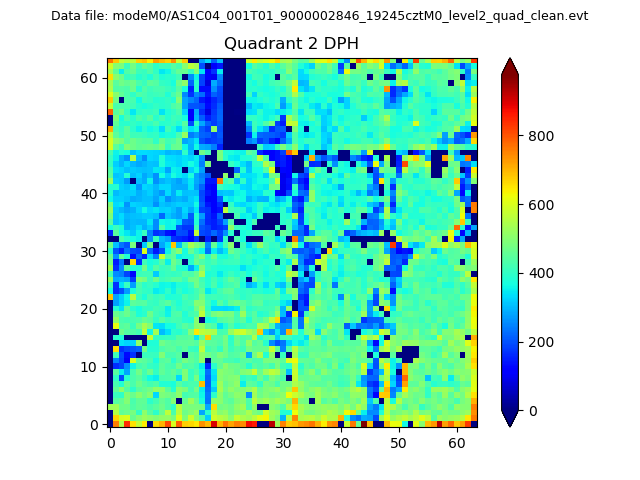
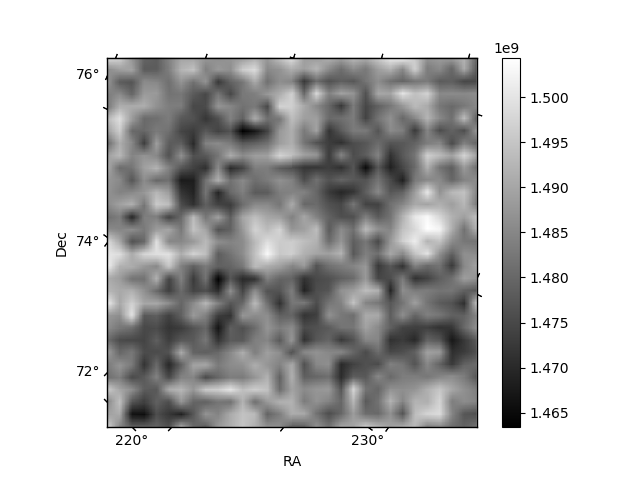
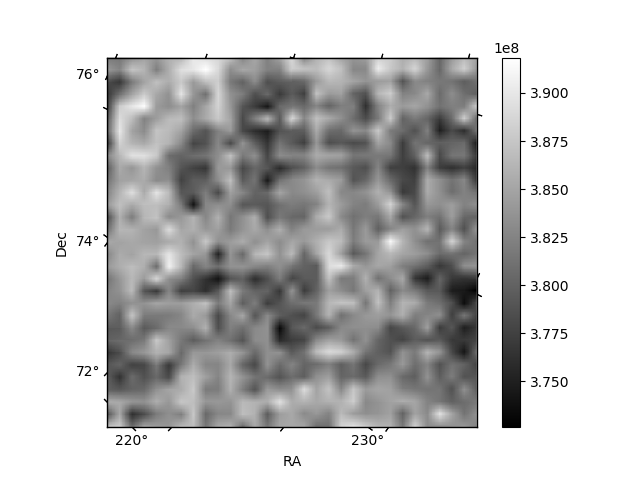
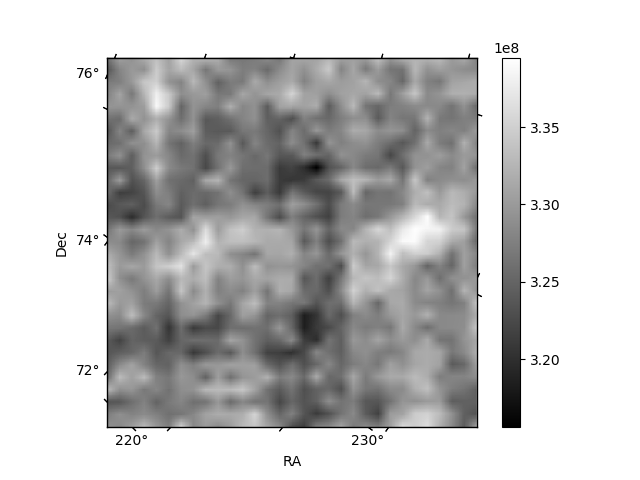
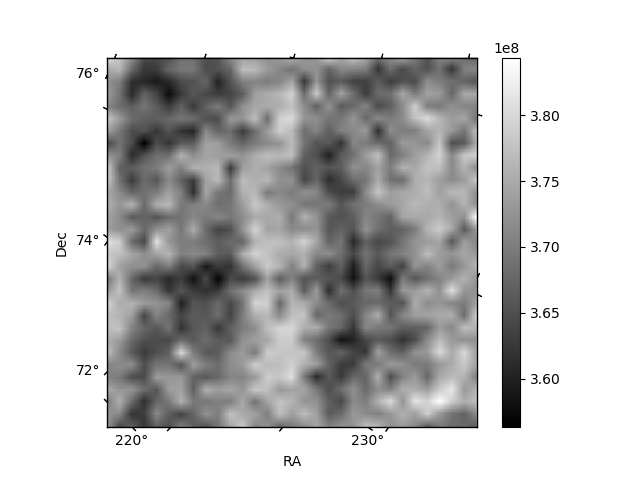
Histogram calculated using DETX and DETY for each event in the final _common_clean file
| Quadrant A | 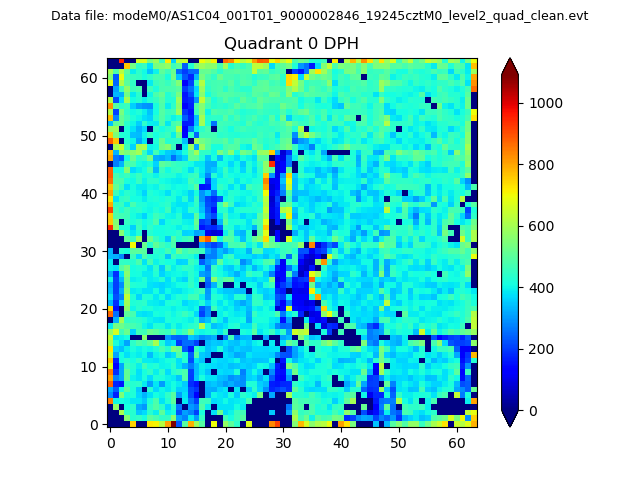 |
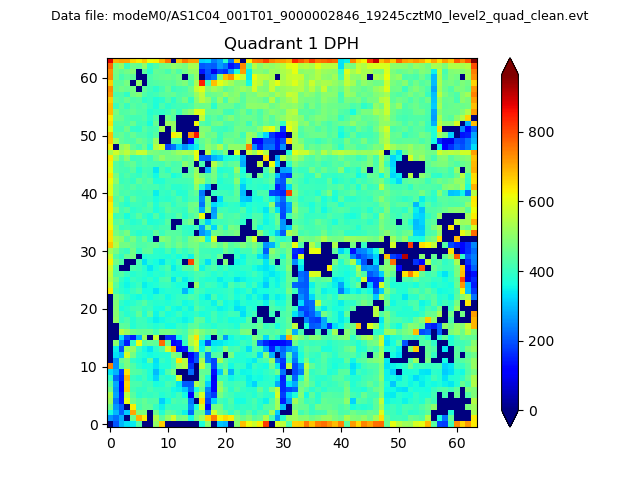 |
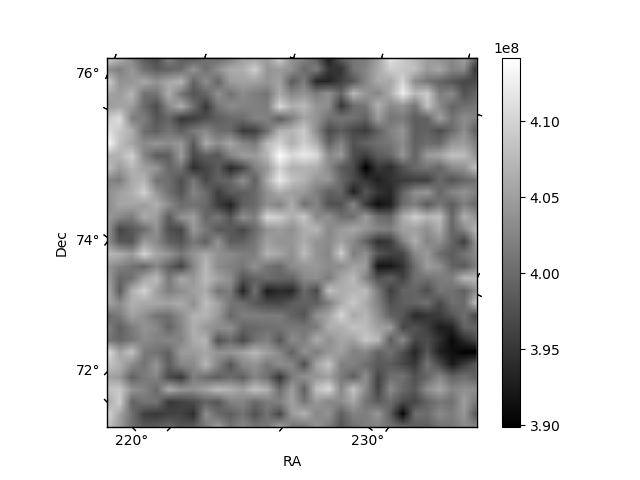
Quadrant B |
|---|---|---|---|
| Quadrant D | 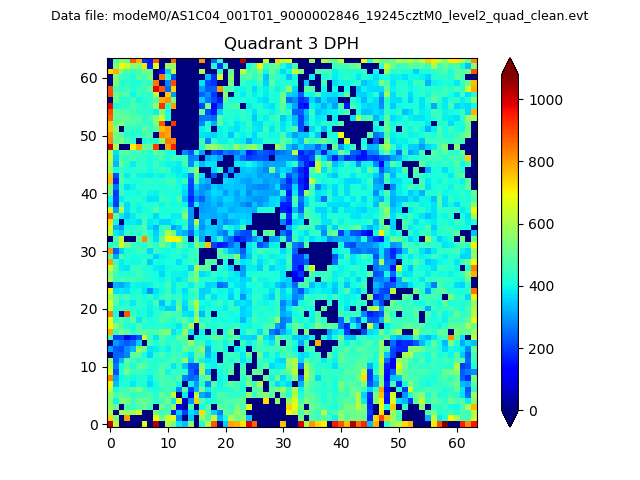 |
 |
Quadrant C |
| Plot type | Count rate plots | Images |
|---|---|---|
| Comparison with Poisson distribution Blue bars denote a histogram of data divided into 1 sec bins. Red curve is a Poisson curve with rate = median count rate of data. |
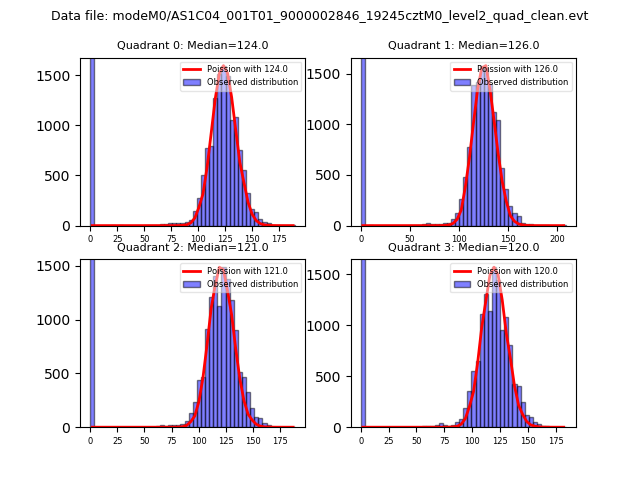 |
 |
| Quadrant-wise count rates Data is divided into 100 sec bins |
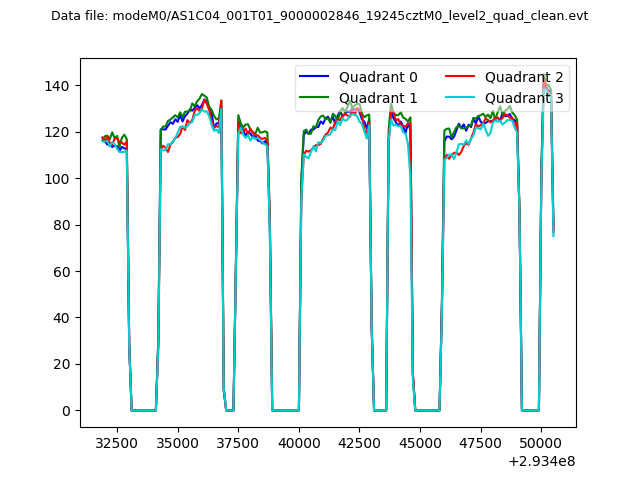 |
|
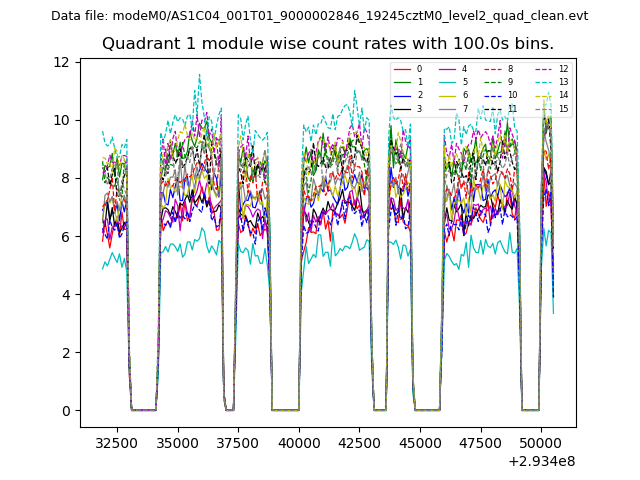
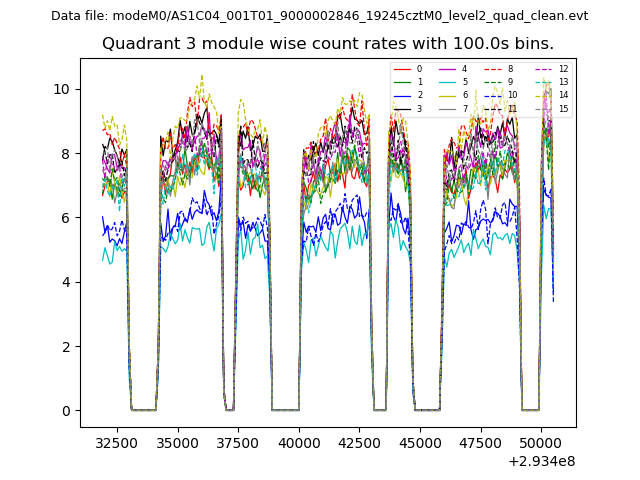
| Module-wise count rates for Quadrant A Data is divided into 100 sec bins |
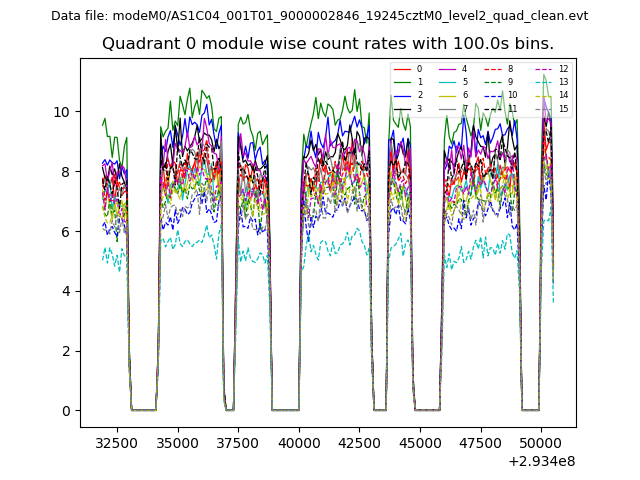 |
 |
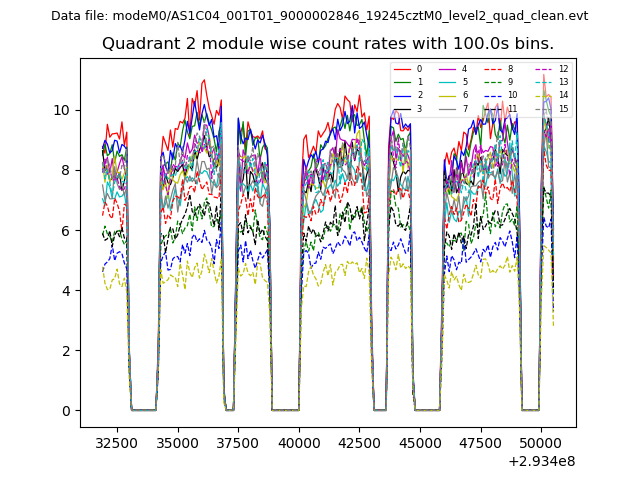
| Module-wise count rates for Quadrant B Data is divided into 100 sec bins |
 |
 |
| Module-wise count rates for Quadrant C Data is divided into 100 sec bins |
 |
 |
| Module-wise count rates for Quadrant D Data is divided into 100 sec bins |
 |
 |
| Parameter | Plot |
|---|---|
| CZT HV Monitor |  |
| D_VDD | 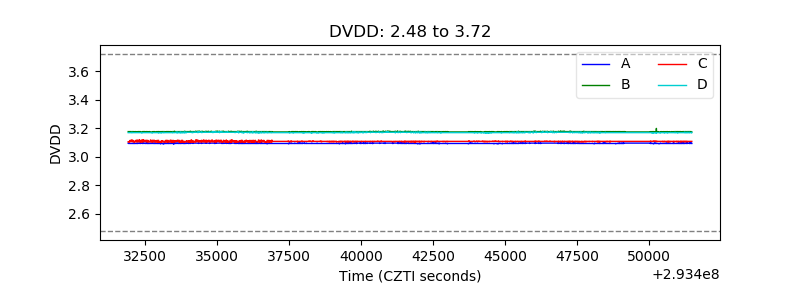 |
| Temperature 1 | 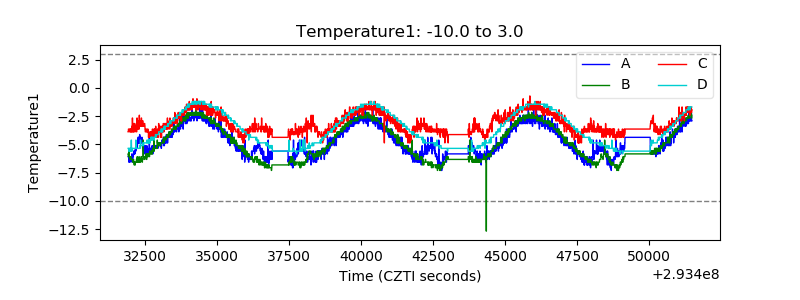 |
| Veto HV Monitor |  |
| Veto LLD | 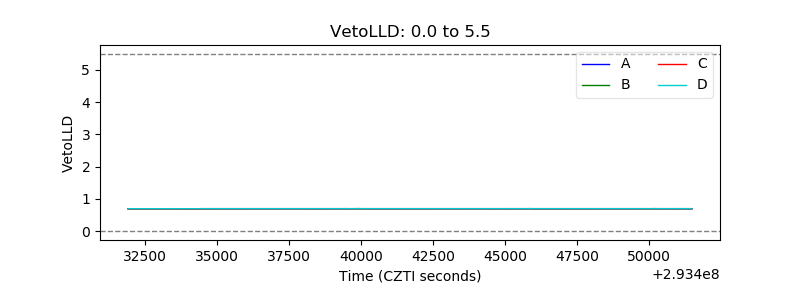 |
| Alpha Counter | 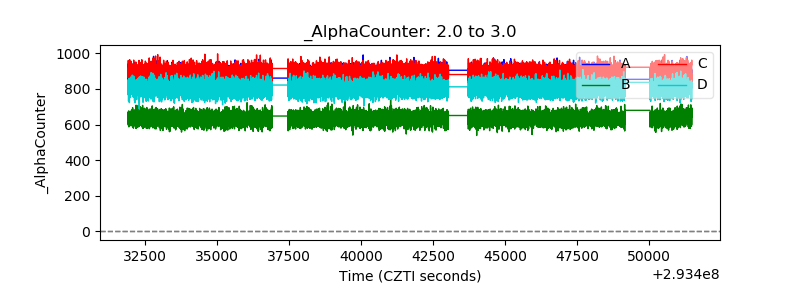 |
| _CPM_Rate | 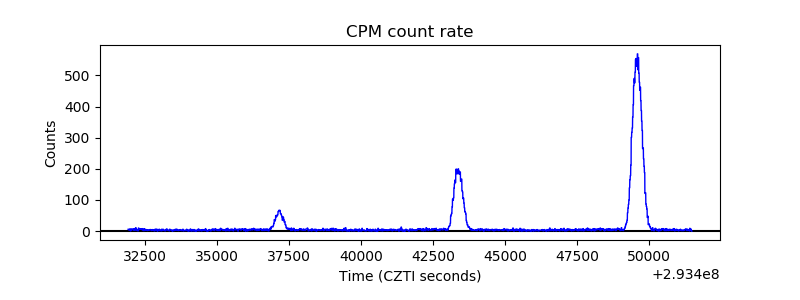 |
| CZT Counter | 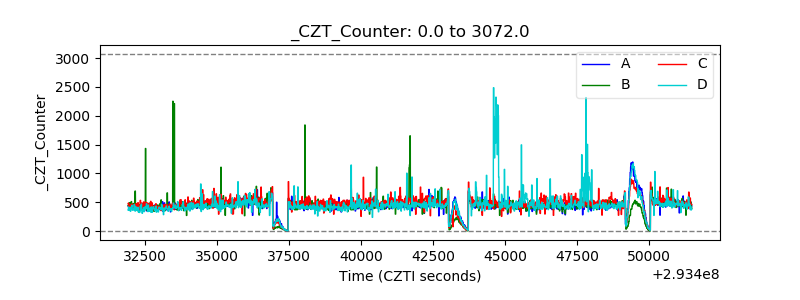 |
| +2.5 Volts monitor |  |
| +5 Volts monitor |  |
| _ROLL_ROT | 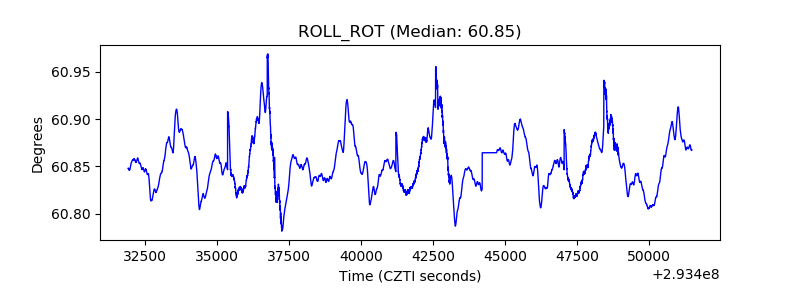 |
| _Roll_DEC | 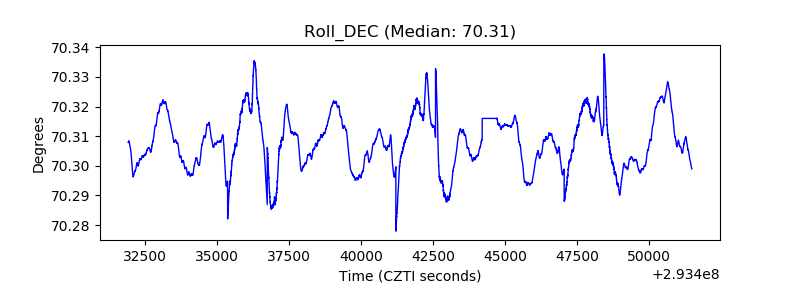 |
| _Roll_RA | 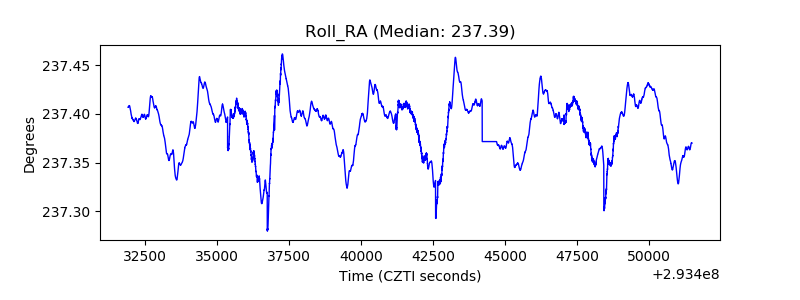 |
| Veto Counter | 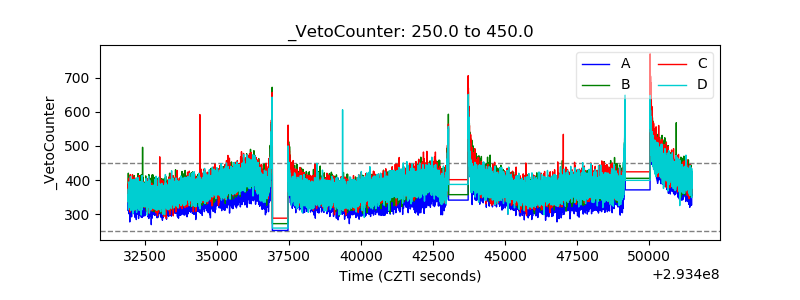 |