| Param | Original file | Final file |
|---|---|---|
| Filename | modeM0/AS1C04_001T01_9000002846_19248cztM0_level2.evt | modeM0/AS1C04_001T01_9000002846_19248cztM0_level2_quad_clean.evt |
| Size (bytes) | 441,031,680 | 89,481,600 |
| Size | 420.6 MB | 85.3 MB |
| Events in quadrant A | 3,113,128 | 575,551 |
| Events in quadrant B | 3,194,637 | 580,978 |
| Events in quadrant C | 3,452,338 | 554,884 |
| Events in quadrant D | 3,163,038 | 553,435 |
| Mode M9 | |||
|---|---|---|---|
| Quadrant | BADHDUFLAG | Total packets | Discarded packets |
| A | 0 | 12 | 0 |
| B | 0 | 12 | 0 |
| C | 0 | 12 | 0 |
| D | 0 | 12 | 0 |
| Mode SS | |||
|---|---|---|---|
| Quadrant | BADHDUFLAG | Total packets | Discarded packets |
| A | 0 | 128 | 0 |
| B | 0 | 128 | 0 |
| C | 0 | 128 | 0 |
| D | 0 | 128 | 0 |
| Mode M0 | |||
|---|---|---|---|
| Quadrant | BADHDUFLAG | Total packets | Discarded packets |
| A | 0 | 13448 | 1 |
| B | 0 | 13594 | 1 |
| C | 0 | 14199 | 1 |
| D | 0 | 13667 | 1 |
| Quadrant | Total seconds | Saturated seconds | Saturation percentage |
|---|---|---|---|
| A | 6380 | 66 | 1.034483% |
| B | 6381 | 85 | 1.332080% |
| C | 6381 | 113 | 1.770882% |
| D | 6381 | 50 | 0.783576% |
Noise dominated data is calculated using 1-second bins in cleaned event files. If a bin has >2000 counts, and if more than 50% of those come from <1% of pixels, then it is considered to be noise-dominated and hence unusable.
| Quadrant | # 1 sec bins | Bins with >0 counts | Bins with >2000 counts | High rate bins dominated by noise | Noise dominated (total time) | Noise dominated (detector-on time) | Marked lightcurve |
|---|---|---|---|---|---|---|---|
| A | 7505 | 6380 | 0 | 0 | 0.00% | 0.00% |  |
| B | 7506 | 6381 | 7 | 7 | 0.09% | 0.11% |  |
| C | 7506 | 6381 | 3 | 3 | 0.04% | 0.05% |  |
| D | 7506 | 6381 | 5 | 5 | 0.07% | 0.08% |  |
Top three noisy pixels from each quadrant. If the there are fewer than three noisy pixels in the level2.evt file, extra rows are filled as -1
| Pixel properties | Quadrant properties | ||||||
|---|---|---|---|---|---|---|---|
| Quadrant | DetID | PixID | Counts | Sigma | Mean | Median | Sigma |
| A | 13 | 254 | 8550 | 48.23 | 804 | 786 | 161.0 |
| A | 11 | 29 | 8500 | 47.92 | 804 | 786 | 161.0 |
| A | 0 | 226 | 7113 | 39.3 | 804 | 786 | 161.0 |
| B | 3 | 64 | 31549 | 206.84 | 796 | 777 | 148.8 |
| B | 0 | 190 | 20975 | 135.77 | 796 | 777 | 148.8 |
| B | 12 | 111 | 17481 | 112.28 | 796 | 777 | 148.8 |
| C | 3 | 233 | 304816 | 1703.58 | 771 | 776 | 178.5 |
| C | 14 | 238 | 122747 | 683.42 | 771 | 776 | 178.5 |
| C | 0 | 207 | 18123 | 97.2 | 771 | 776 | 178.5 |
| D | 1 | 52 | 138954 | 734.33 | 785 | 763 | 188.2 |
| D | 2 | 234 | 27529 | 142.23 | 785 | 763 | 188.2 |
| D | 7 | 96 | 23041 | 118.38 | 785 | 763 | 188.2 |
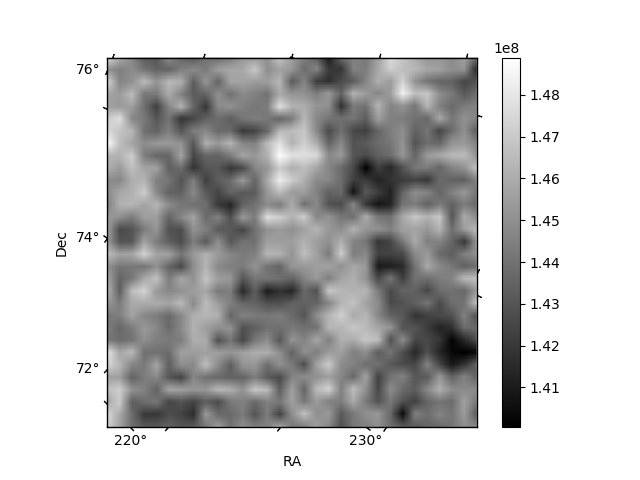
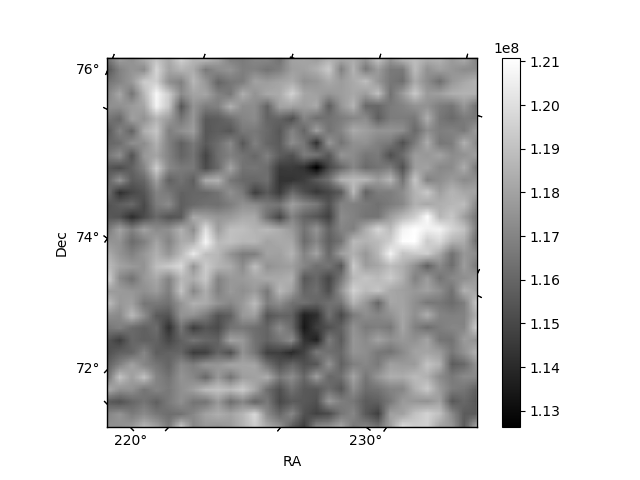
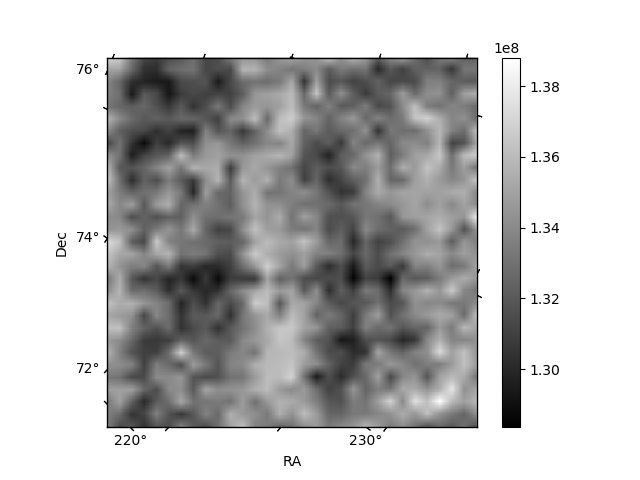
Histogram calculated using DETX and DETY for each event in the final _common_clean file
| Quadrant A | 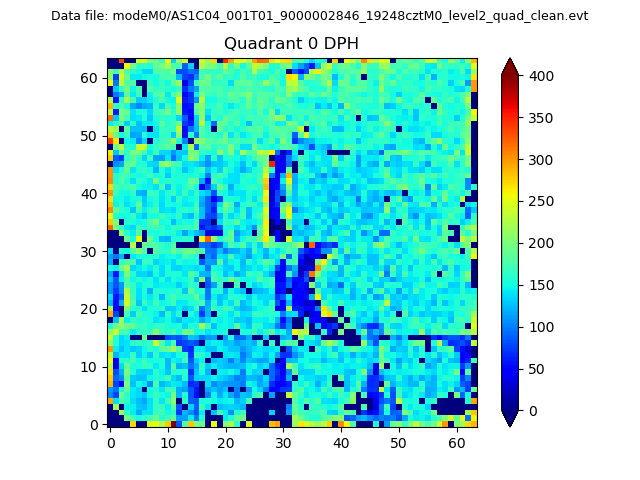 |
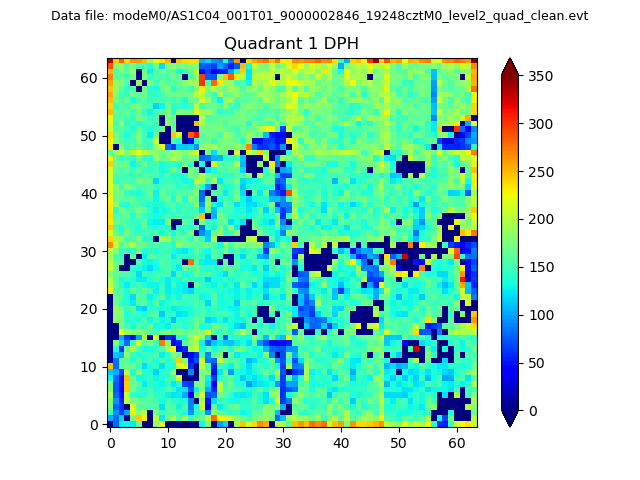 |
Quadrant B |
|---|---|---|---|
| Quadrant D | 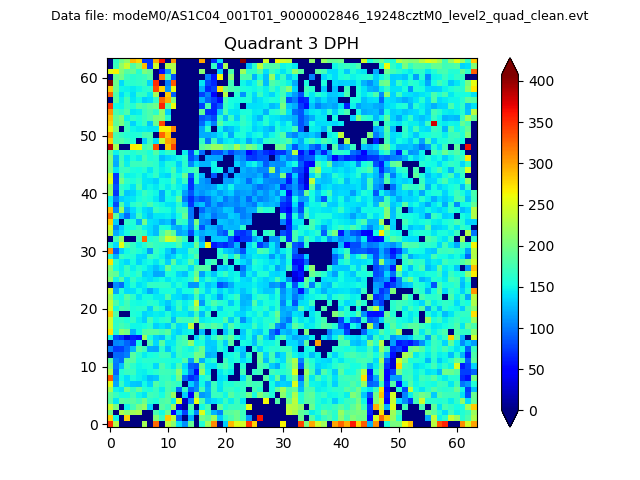 |
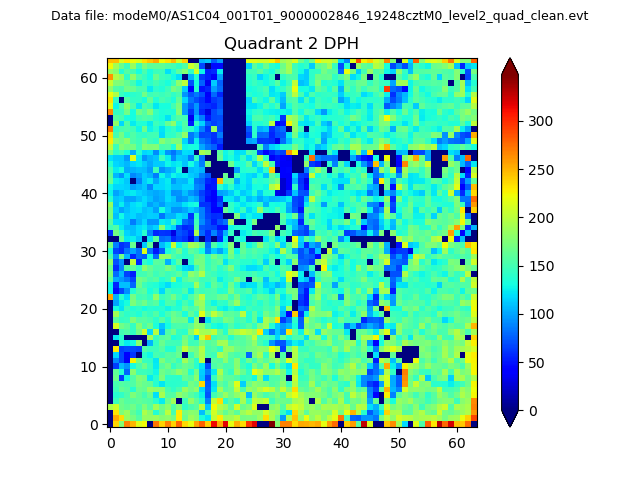 |
Quadrant C |
| Plot type | Count rate plots | Images |
|---|---|---|
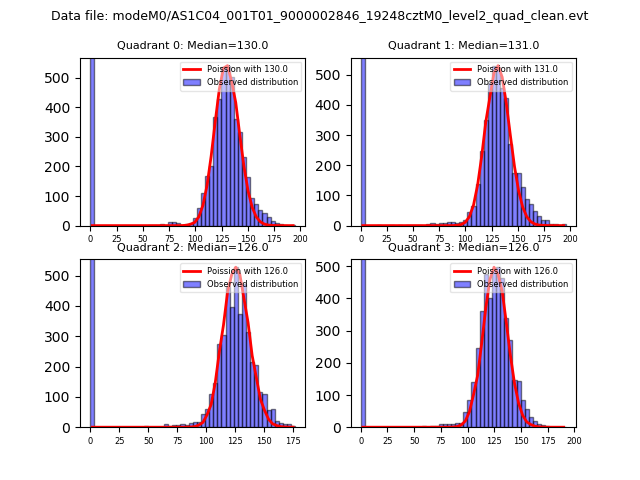
| Comparison with Poisson distribution Blue bars denote a histogram of data divided into 1 sec bins. Red curve is a Poisson curve with rate = median count rate of data. |
 |
 |
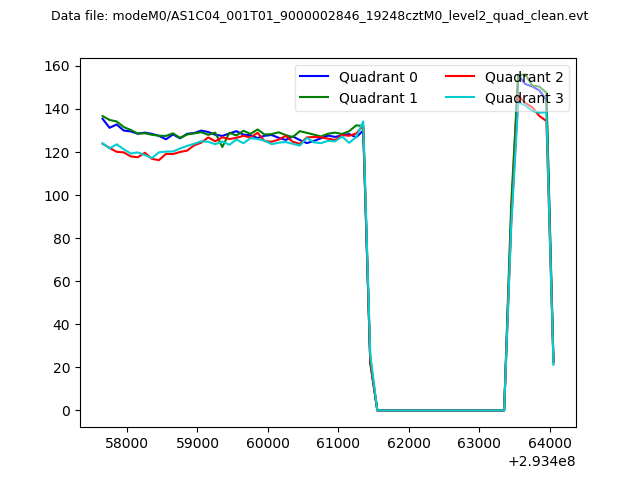
| Quadrant-wise count rates Data is divided into 100 sec bins |
 |
|
| Module-wise count rates for Quadrant A Data is divided into 100 sec bins |
 |
 |
| Module-wise count rates for Quadrant B Data is divided into 100 sec bins |
 |
 |
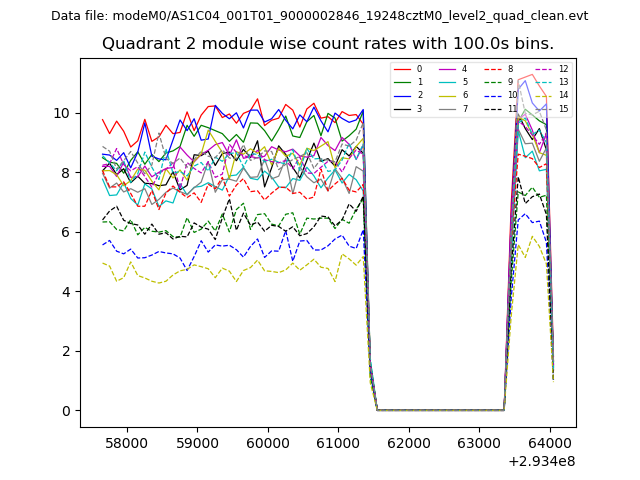
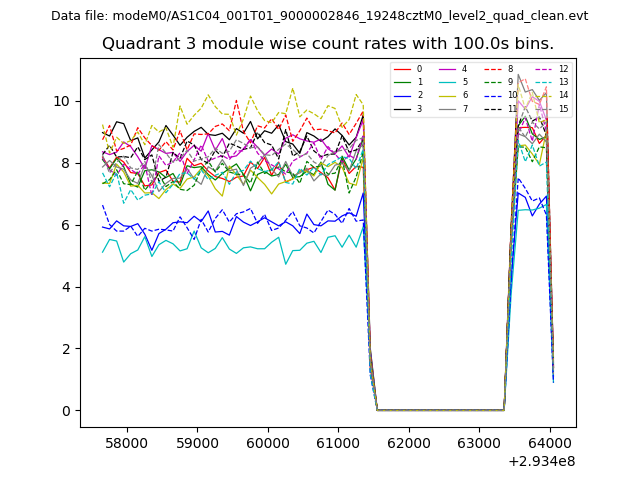
| Module-wise count rates for Quadrant C Data is divided into 100 sec bins |
 |
 |
| Module-wise count rates for Quadrant D Data is divided into 100 sec bins |
 |
 |
| Parameter | Plot |
|---|---|
| CZT HV Monitor | 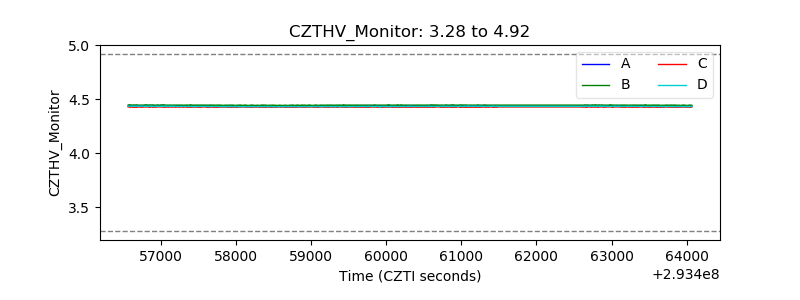 |
| D_VDD | 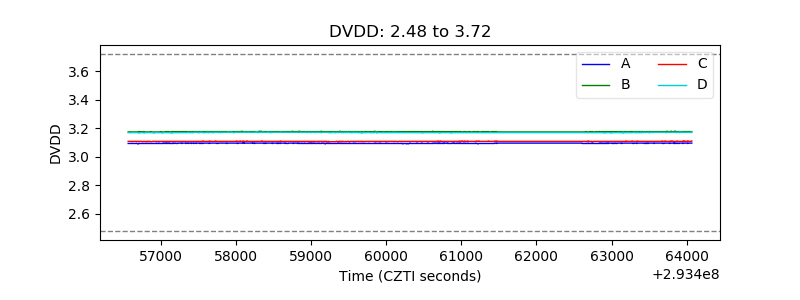 |
| Temperature 1 | 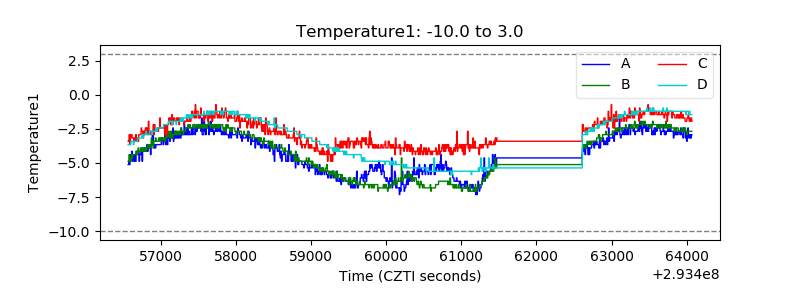 |
| Veto HV Monitor | 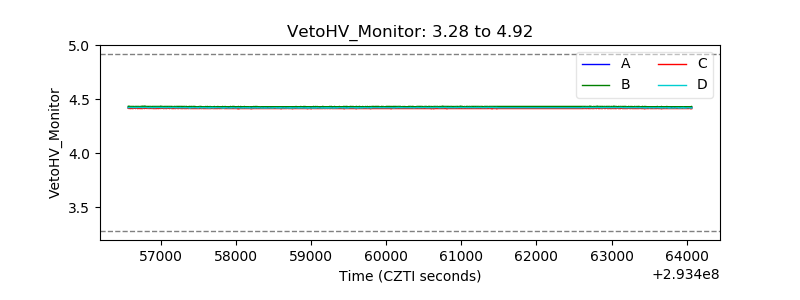 |
| Veto LLD | 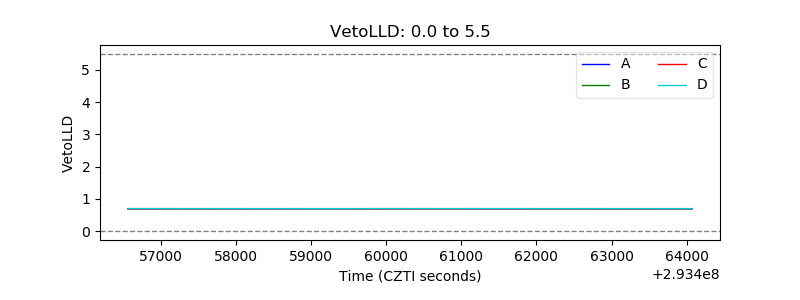 |
| Alpha Counter | 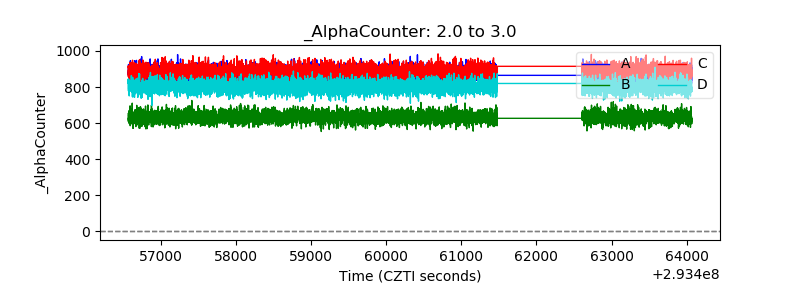 |
| _CPM_Rate | 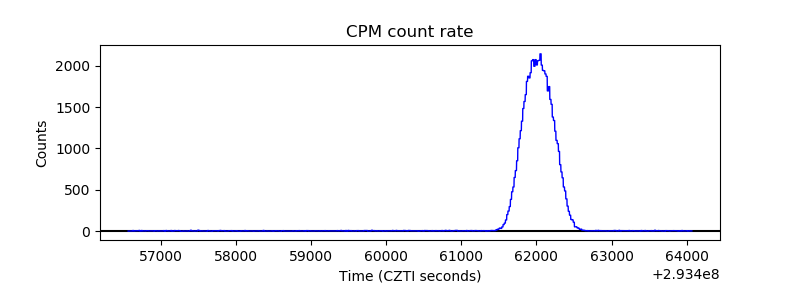 |
| CZT Counter | 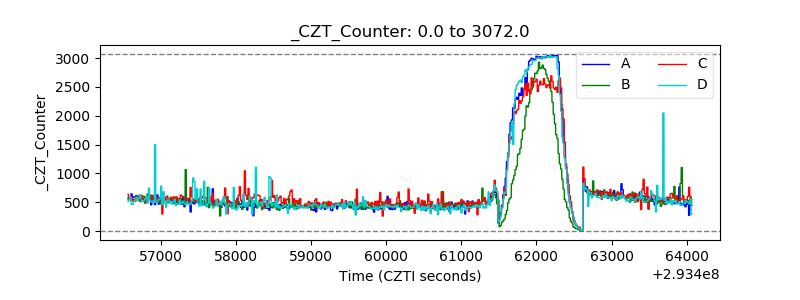 |
| +2.5 Volts monitor |  |
| +5 Volts monitor |  |
| _ROLL_ROT |  |
| _Roll_DEC | 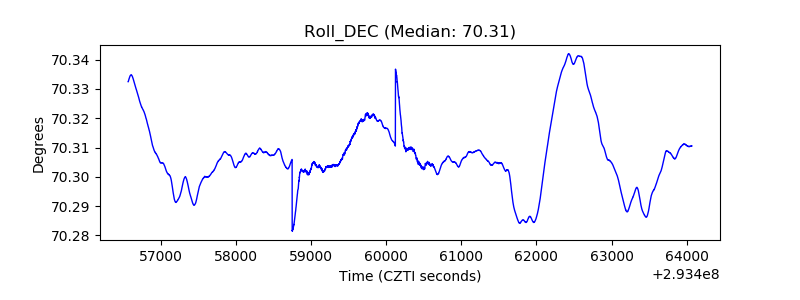 |
| _Roll_RA | 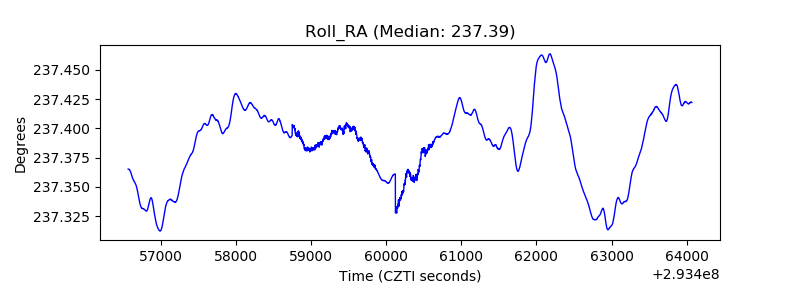 |
| Veto Counter |  |