| Param | Original file | Final file |
|---|---|---|
| Filename | modeM0/AS1C04_001T01_9000002846_19249cztM0_level2.evt | modeM0/AS1C04_001T01_9000002846_19249cztM0_level2_quad_clean.evt |
| Size (bytes) | 165,326,400 | 28,725,120 |
| Size | 157.7 MB | 27.4 MB |
| Events in quadrant A | 1,162,493 | 184,076 |
| Events in quadrant B | 1,202,757 | 184,825 |
| Events in quadrant C | 1,284,833 | 172,643 |
| Events in quadrant D | 1,208,089 | 171,789 |
| Mode M9 | |||
|---|---|---|---|
| Quadrant | BADHDUFLAG | Total packets | Discarded packets |
| A | 0 | 2 | 0 |
| B | 0 | 2 | 0 |
| C | 0 | 2 | 0 |
| D | 0 | 3 | 0 |
| Mode SS | |||
|---|---|---|---|
| Quadrant | BADHDUFLAG | Total packets | Discarded packets |
| A | 0 | 42 | 0 |
| B | 0 | 42 | 0 |
| C | 0 | 42 | 0 |
| D | 0 | 42 | 0 |
| Mode M0 | |||
|---|---|---|---|
| Quadrant | BADHDUFLAG | Total packets | Discarded packets |
| A | 0 | 4837 | 1 |
| B | 0 | 4931 | 1 |
| C | 0 | 5226 | 1 |
| D | 0 | 4878 | 1 |
| Quadrant | Total seconds | Saturated seconds | Saturation percentage |
|---|---|---|---|
| A | 2158 | 11 | 0.509731% |
| B | 2158 | 19 | 0.880445% |
| C | 2158 | 42 | 1.946247% |
| D | 2158 | 10 | 0.463392% |
Noise dominated data is calculated using 1-second bins in cleaned event files. If a bin has >2000 counts, and if more than 50% of those come from <1% of pixels, then it is considered to be noise-dominated and hence unusable.
| Quadrant | # 1 sec bins | Bins with >0 counts | Bins with >2000 counts | High rate bins dominated by noise | Noise dominated (total time) | Noise dominated (detector-on time) | Marked lightcurve |
|---|---|---|---|---|---|---|---|
| A | 2158 | 2158 | 0 | 0 | 0.00% | 0.00% | 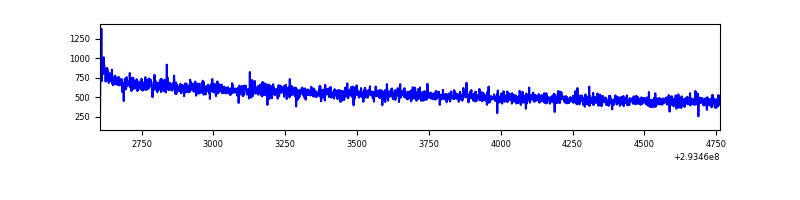 |
| B | 2158 | 2158 | 2 | 2 | 0.09% | 0.09% | 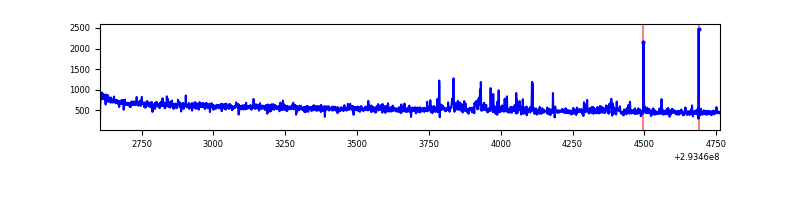 |
| C | 2158 | 2158 | 1 | 1 | 0.05% | 0.05% | 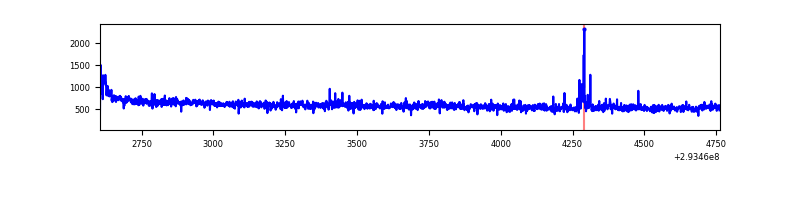 |
| D | 2158 | 2158 | 4 | 4 | 0.19% | 0.19% | 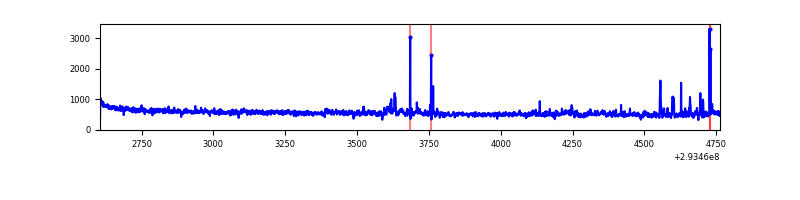 |
Top three noisy pixels from each quadrant. If the there are fewer than three noisy pixels in the level2.evt file, extra rows are filled as -1
| Pixel properties | Quadrant properties | ||||||
|---|---|---|---|---|---|---|---|
| Quadrant | DetID | PixID | Counts | Sigma | Mean | Median | Sigma |
| A | 9 | 143 | 2812 | 41.07 | 301 | 295 | 61.3 |
| A | 13 | 254 | 2797 | 40.82 | 301 | 295 | 61.3 |
| A | 0 | 226 | 2679 | 38.9 | 301 | 295 | 61.3 |
| B | 0 | 190 | 20777 | 364.31 | 295 | 288 | 56.2 |
| B | 7 | 220 | 14092 | 245.45 | 295 | 288 | 56.2 |
| B | 6 | 36 | 8863 | 152.47 | 295 | 288 | 56.2 |
| C | 3 | 233 | 101486 | 1513.98 | 286 | 288 | 66.8 |
| C | 14 | 238 | 46034 | 684.39 | 286 | 288 | 66.8 |
| C | 0 | 207 | 20502 | 302.41 | 286 | 288 | 66.8 |
| D | 1 | 52 | 78635 | 1093.46 | 294 | 285 | 71.7 |
| D | 2 | 120 | 8980 | 121.35 | 294 | 285 | 71.7 |
| D | 2 | 234 | 8775 | 118.49 | 294 | 285 | 71.7 |
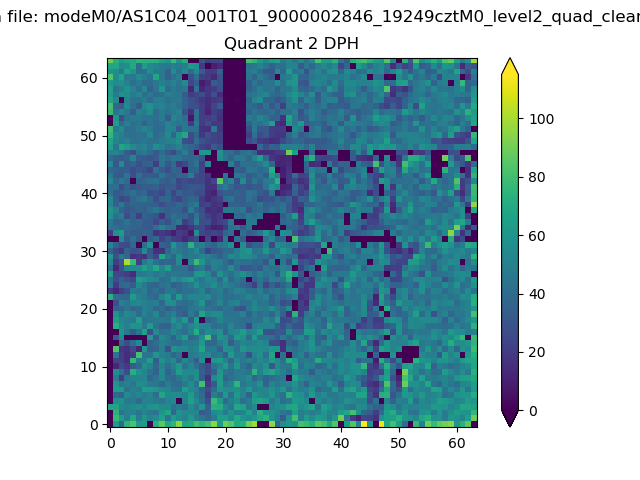
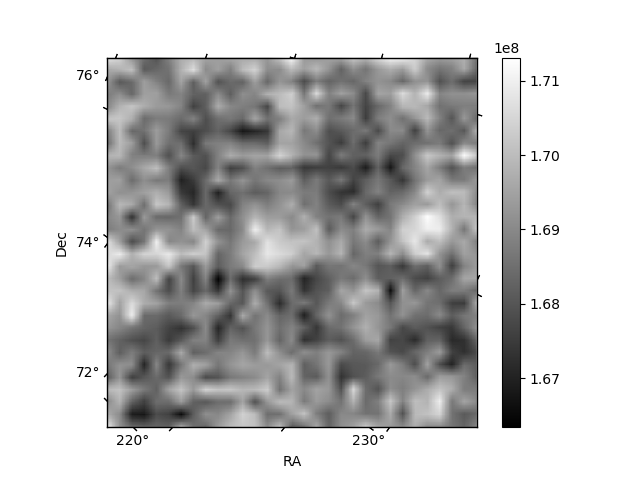
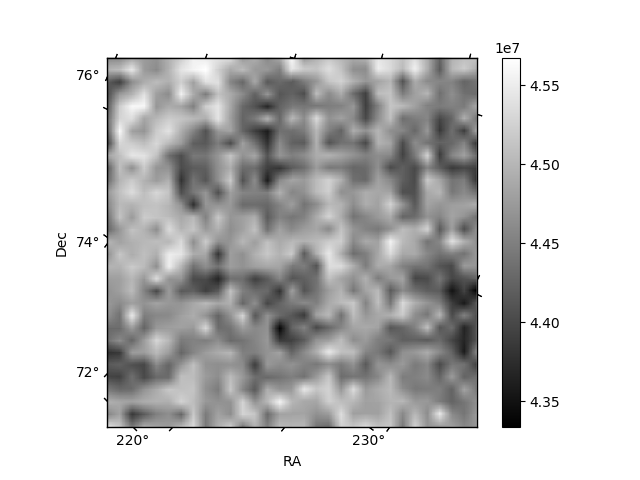
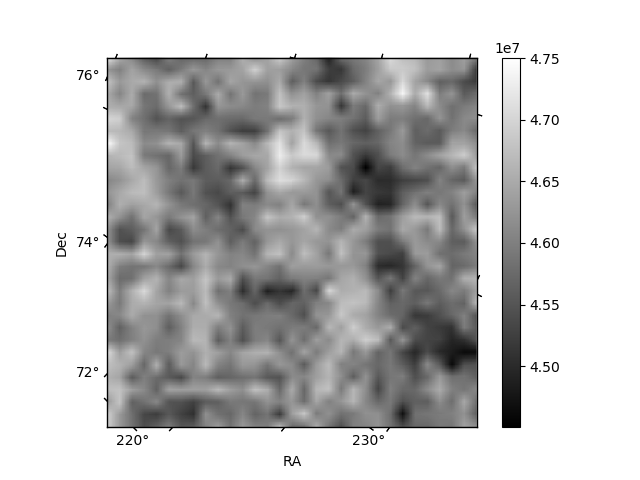
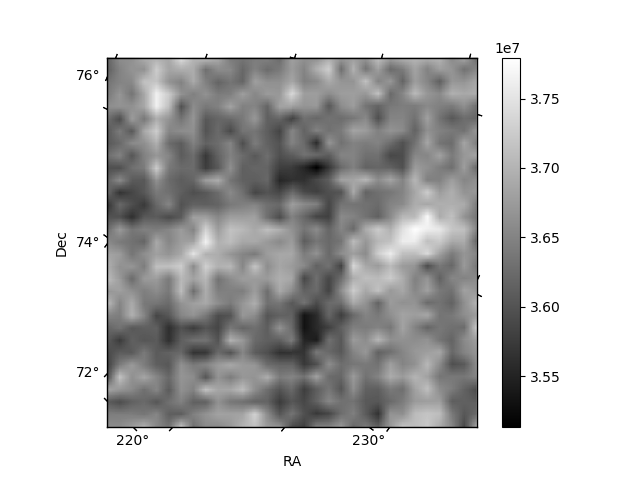
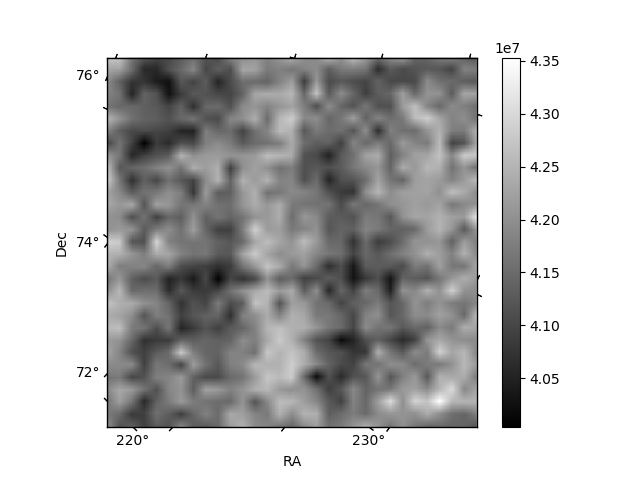
Histogram calculated using DETX and DETY for each event in the final _common_clean file
| Quadrant A | 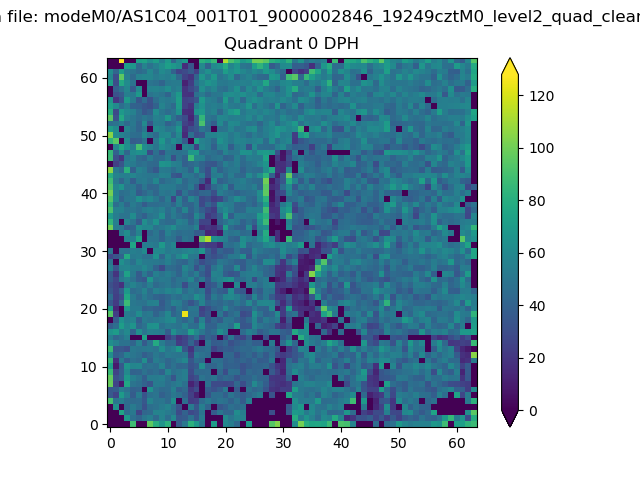 |
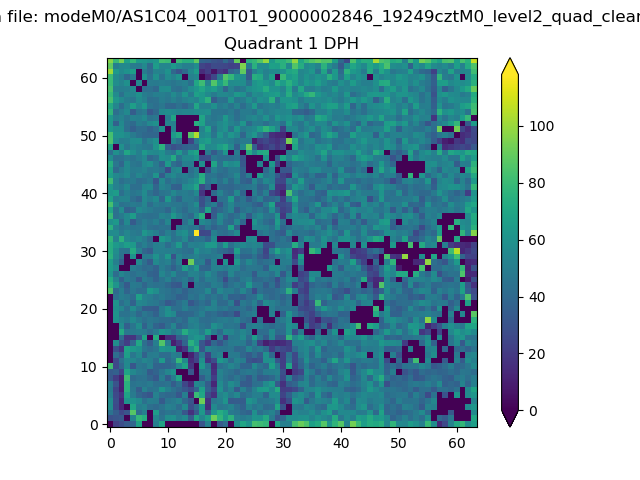 |
Quadrant B |
|---|---|---|---|
| Quadrant D | 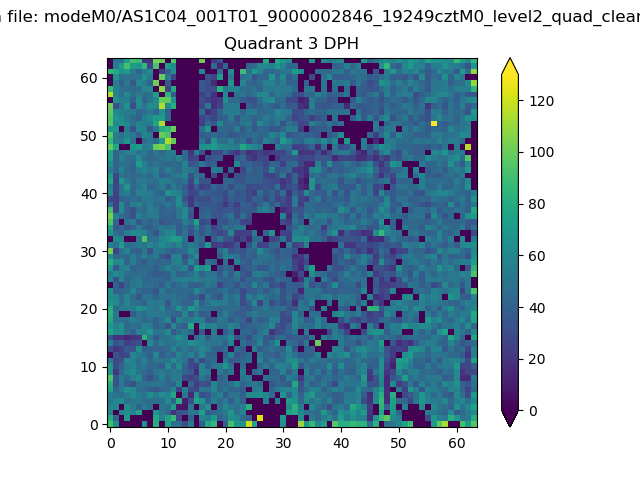 |
 |
Quadrant C |
| Plot type | Count rate plots | Images |
|---|---|---|
| Comparison with Poisson distribution Blue bars denote a histogram of data divided into 1 sec bins. Red curve is a Poisson curve with rate = median count rate of data. |
 |
 |
| Quadrant-wise count rates Data is divided into 100 sec bins |
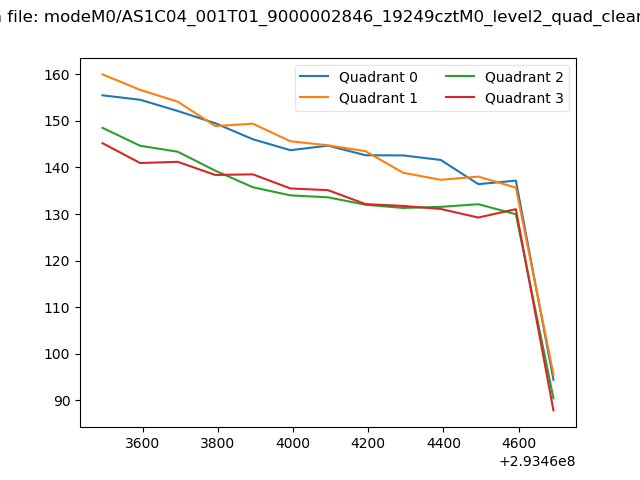 |
|
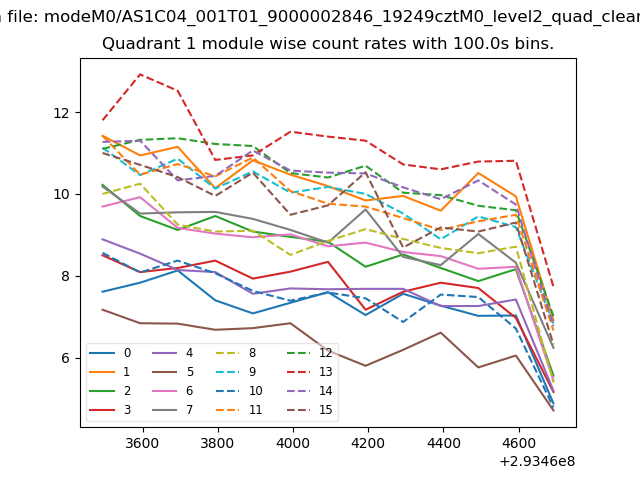
| Module-wise count rates for Quadrant A Data is divided into 100 sec bins |
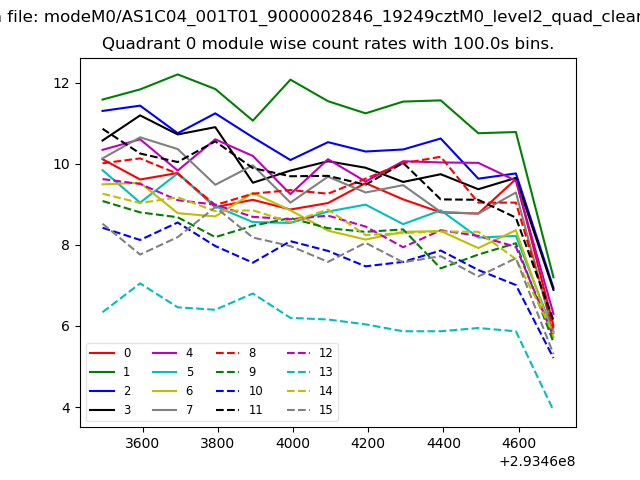 |
 |
| Module-wise count rates for Quadrant B Data is divided into 100 sec bins |
 |
 |
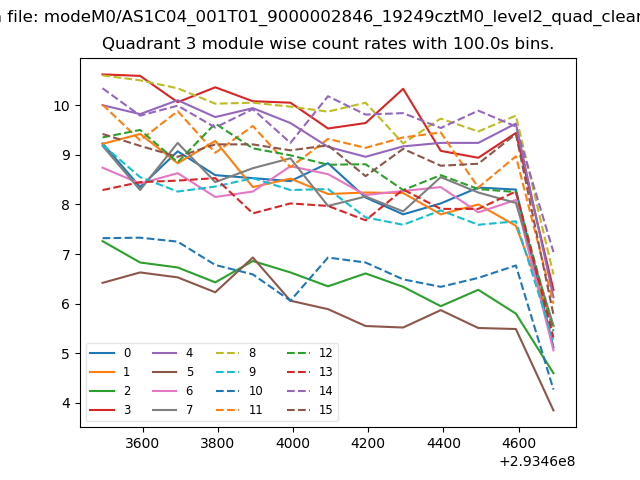
| Module-wise count rates for Quadrant C Data is divided into 100 sec bins |
 |
 |
| Module-wise count rates for Quadrant D Data is divided into 100 sec bins |
 |
 |
| Parameter | Plot |
|---|---|
| CZT HV Monitor |  |
| D_VDD | 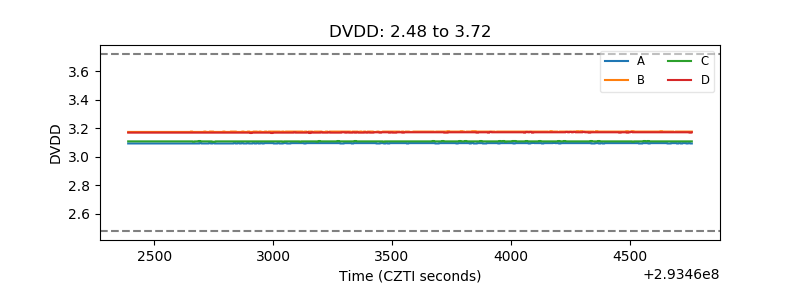 |
| Temperature 1 | 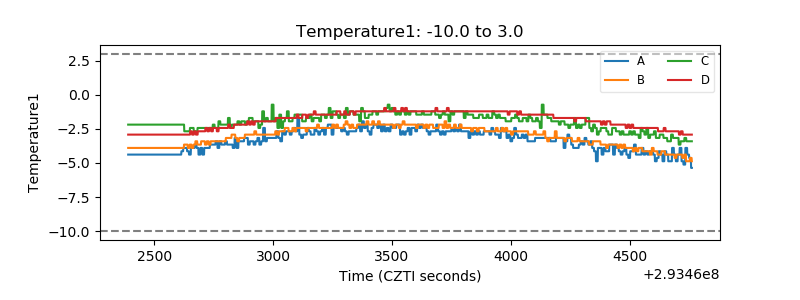 |
| Veto HV Monitor | 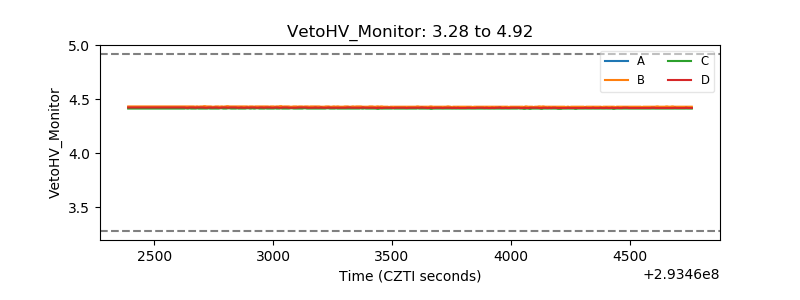 |
| Veto LLD | 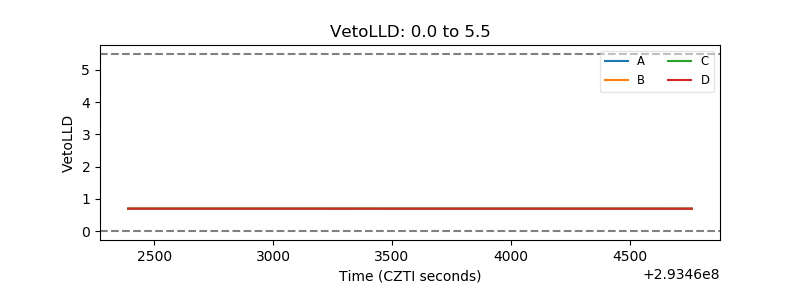 |
| Alpha Counter | 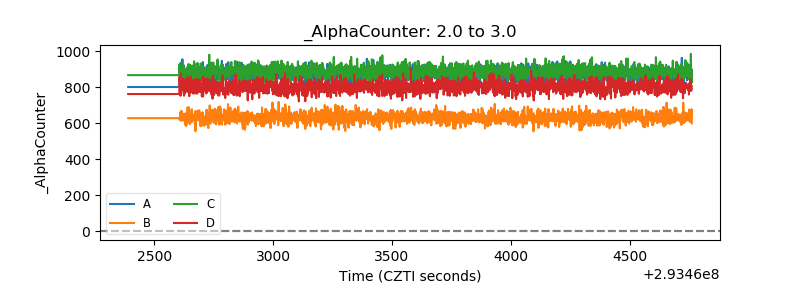 |
| _CPM_Rate | 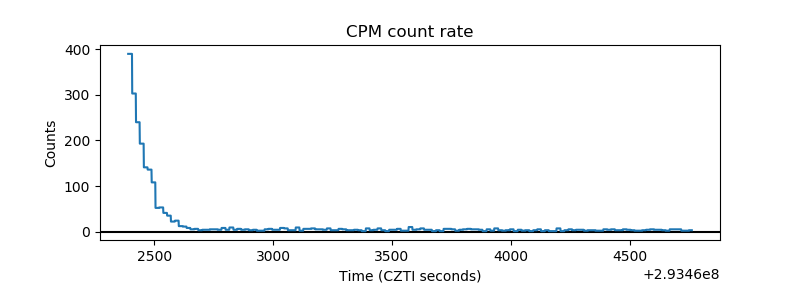 |
| CZT Counter | 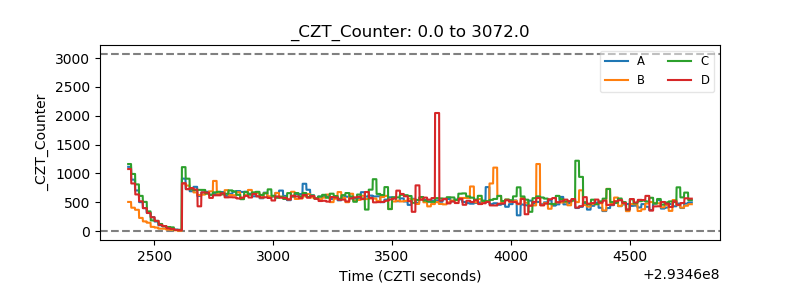 |
| +2.5 Volts monitor |  |
| +5 Volts monitor |  |
| _ROLL_ROT | 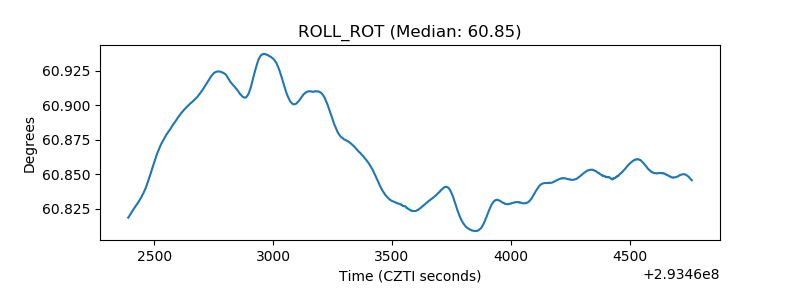 |
| _Roll_DEC |  |
| _Roll_RA | 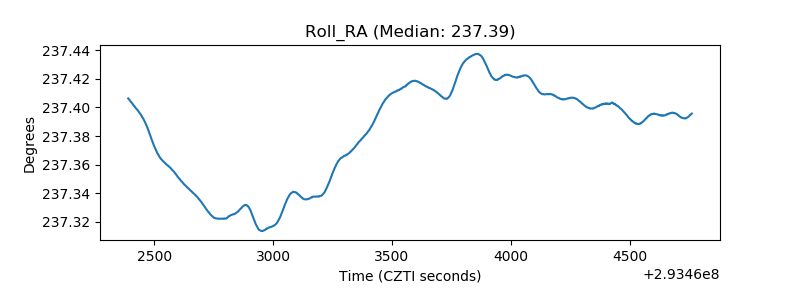 |
| Veto Counter | 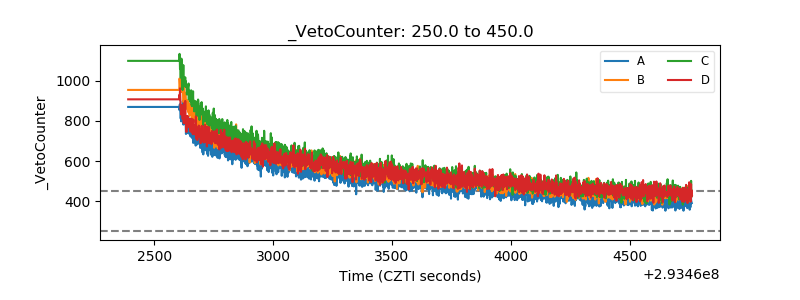 |