| Param | Original file | Final file |
|---|---|---|
| Filename | modeM0/AS1A05_115T01_9000002848cztM0_level2.fits | modeM0/AS1A05_115T01_9000002848cztM0_level2_quad_clean.evt |
| Size (bytes) | 607,063,680 | 463,340,160 |
| Size | 578.9 MB | 441.9 MB |
| Events in quadrant A | 3,717,668 | 2,543,861 |
| Events in quadrant B | 3,598,288 | 2,568,580 |
| Events in quadrant C | 3,671,712 | 2,447,787 |
| Events in quadrant D | 3,188,000 | 2,260,847 |
| Mode SS | |||
|---|---|---|---|
| Quadrant | BADHDUFLAG | Total packets | Discarded packets |
| A | 0 | 1256 | 0 |
| B | 0 | 1256 | 0 |
| C | 0 | 1256 | 0 |
| D | 0 | 1256 | 0 |
| Mode M9 | |||
|---|---|---|---|
| Quadrant | BADHDUFLAG | Total packets | Discarded packets |
| A | 0 | 87 | 0 |
| B | 0 | 87 | 0 |
| C | 0 | 87 | 0 |
| D | 0 | 87 | 0 |
| Mode M0 | |||
|---|---|---|---|
| Quadrant | BADHDUFLAG | Total packets | Discarded packets |
| A | 0 | 128901 | 0 |
| B | 0 | 127666 | 0 |
| C | 0 | 132142 | 0 |
| D | 0 | 150947 | 0 |
| Quadrant | Total seconds | Saturated seconds | Saturation percentage |
|---|---|---|---|
| A | 61345 | 614 | 1.000897% |
| B | 61345 | 744 | 1.212813% |
| C | 61345 | 1013 | 1.651316% |
| D | 61345 | 1723 | 2.808705% |
Noise dominated data is calculated using 1-second bins in cleaned event files. If a bin has >2000 counts, and if more than 50% of those come from <1% of pixels, then it is considered to be noise-dominated and hence unusable.
| Quadrant | # 1 sec bins | Bins with >0 counts | Bins with >2000 counts | High rate bins dominated by noise | Noise dominated (total time) | Noise dominated (detector-on time) | Marked lightcurve |
|---|---|---|---|---|---|---|---|
| A | 70385 | 61340 | 0 | 0 | 0.00% | 0.00% |  |
| B | 70385 | 61340 | 0 | 0 | 0.00% | 0.00% |  |
| C | 70385 | 61340 | 0 | 0 | 0.00% | 0.00% |  |
| D | 70385 | 61332 | 0 | 0 | 0.00% | 0.00% |  |
Top three noisy pixels from each quadrant. If the there are fewer than three noisy pixels in the level2.evt file, extra rows are filled as -1
| Pixel properties | Quadrant properties | ||||||
|---|---|---|---|---|---|---|---|
| Quadrant | DetID | PixID | Counts | Sigma | Mean | Median | Sigma |
| A | 0 | 29 | 3642 | 11.57 | 965 | 907 | 236.4 |
| A | 7 | 110 | 3000 | 8.86 | 965 | 907 | 236.4 |
| A | 0 | 30 | 2830 | 8.14 | 965 | 907 | 236.4 |
| B | 2 | 9 | 2920 | 10.66 | 947 | 900 | 189.5 |
| B | 2 | 8 | 2445 | 8.15 | 947 | 900 | 189.5 |
| B | 5 | 232 | 2405 | 7.94 | 947 | 900 | 189.5 |
| C | 1 | 80 | 2774 | 7.56 | 968 | 908 | 246.8 |
| C | 1 | 81 | 2719 | 7.34 | 968 | 908 | 246.8 |
| C | 3 | 126 | 2498 | 6.44 | 968 | 908 | 246.8 |
| D | 10 | 190 | 2377 | 6.34 | 910 | 830 | 243.9 |
| D | 10 | 189 | 2244 | 5.8 | 910 | 830 | 243.9 |
| D | 7 | 3 | 2242 | 5.79 | 910 | 830 | 243.9 |
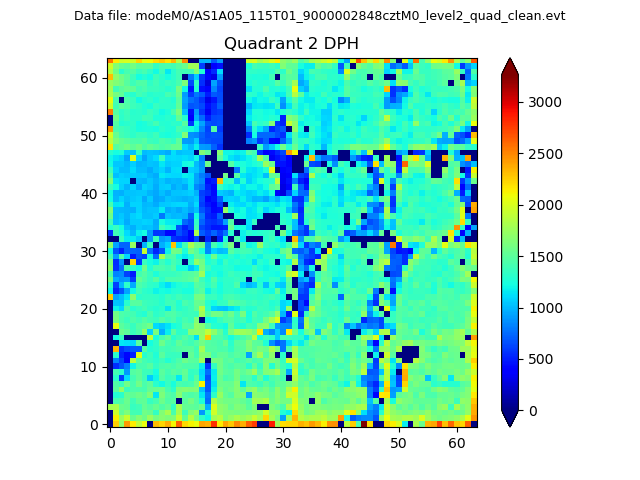
Histogram calculated using DETX and DETY for each event in the final _common_clean file
| Quadrant A |  |
 |
Quadrant B |
|---|---|---|---|
| Quadrant D |  |
 |
Quadrant C |
| Plot type | Count rate plots | Images |
|---|---|---|
| Comparison with Poisson distribution Blue bars denote a histogram of data divided into 1 sec bins. Red curve is a Poisson curve with rate = median count rate of data. |
 |
 |
| Quadrant-wise count rates Data is divided into 100 sec bins |
 |
|
| Module-wise count rates for Quadrant A Data is divided into 100 sec bins |
 |
 |
| Module-wise count rates for Quadrant B Data is divided into 100 sec bins |
 |
 |
| Module-wise count rates for Quadrant C Data is divided into 100 sec bins |
 |
 |
| Module-wise count rates for Quadrant D Data is divided into 100 sec bins |
 |
 |
| Parameter | Plot |
|---|---|
| CZT HV Monitor |  |
| D_VDD |  |
| Temperature 1 |  |
| Veto HV Monitor |  |
| Veto LLD |  |
| Alpha Counter |  |
| _CPM_Rate |  |
| CZT Counter |  |
| +2.5 Volts monitor |  |
| +5 Volts monitor |  |
| _ROLL_ROT |  |
| _Roll_DEC |  |
| _Roll_RA | 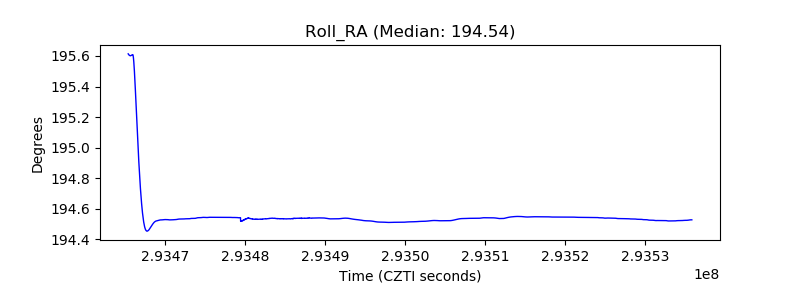 |
| Veto Counter |  |