| Param | Original file | Final file |
|---|---|---|
| Filename | modeM0/AS1A05_115T01_9000002848_19249cztM0_level2.evt | modeM0/AS1A05_115T01_9000002848_19249cztM0_level2_quad_clean.evt |
| Size (bytes) | 269,582,400 | 55,370,880 |
| Size | 257.1 MB | 52.8 MB |
| Events in quadrant A | 1,897,326 | 359,569 |
| Events in quadrant B | 1,829,817 | 367,252 |
| Events in quadrant C | 1,967,413 | 355,779 |
| Events in quadrant D | 2,232,923 | 348,182 |
| Mode SS | |||
|---|---|---|---|
| Quadrant | BADHDUFLAG | Total packets | Discarded packets |
| A | 0 | 72 | 0 |
| B | 0 | 72 | 0 |
| C | 0 | 72 | 0 |
| D | 0 | 72 | 0 |
| Mode M9 | |||
|---|---|---|---|
| Quadrant | BADHDUFLAG | Total packets | Discarded packets |
| A | 0 | 12 | 0 |
| B | 0 | 12 | 0 |
| C | 0 | 12 | 0 |
| D | 0 | 12 | 0 |
| Mode M0 | |||
|---|---|---|---|
| Quadrant | BADHDUFLAG | Total packets | Discarded packets |
| A | 0 | 8017 | 2 |
| B | 0 | 7760 | 1 |
| C | 0 | 8182 | 1 |
| D | 0 | 8981 | 1 |
| Quadrant | Total seconds | Saturated seconds | Saturation percentage |
|---|---|---|---|
| A | 3464 | 54 | 1.558891% |
| B | 3464 | 54 | 1.558891% |
| C | 3464 | 83 | 2.396074% |
| D | 3464 | 58 | 1.674365% |
Noise dominated data is calculated using 1-second bins in cleaned event files. If a bin has >2000 counts, and if more than 50% of those come from <1% of pixels, then it is considered to be noise-dominated and hence unusable.
| Quadrant | # 1 sec bins | Bins with >0 counts | Bins with >2000 counts | High rate bins dominated by noise | Noise dominated (total time) | Noise dominated (detector-on time) | Marked lightcurve |
|---|---|---|---|---|---|---|---|
| A | 4714 | 3464 | 4 | 4 | 0.08% | 0.12% | 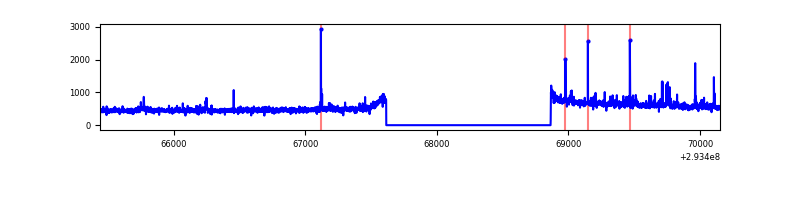 |
| B | 4714 | 3465 | 0 | 0 | 0.00% | 0.00% | 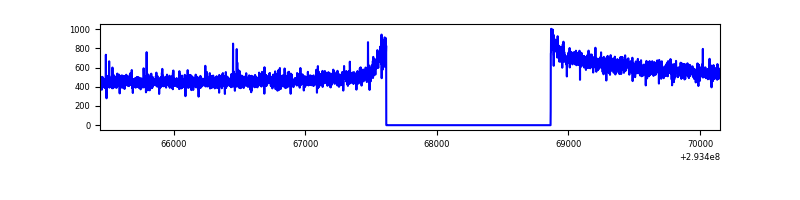 |
| C | 4714 | 3464 | 0 | 0 | 0.00% | 0.00% | 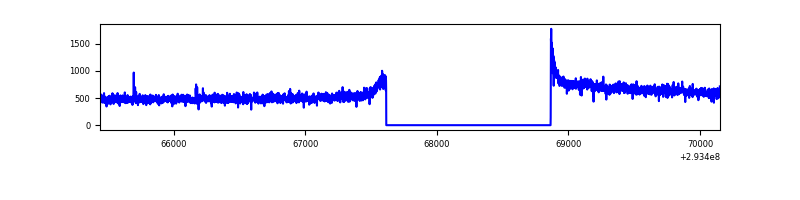 |
| D | 4714 | 3464 | 26 | 26 | 0.55% | 0.75% | 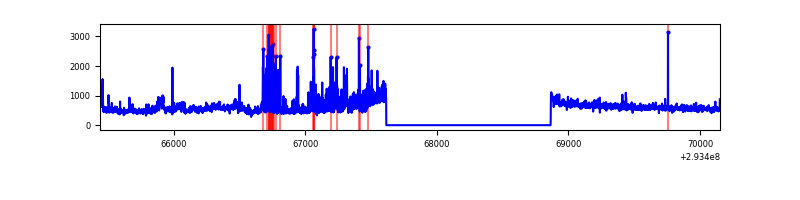 |
Top three noisy pixels from each quadrant. If the there are fewer than three noisy pixels in the level2.evt file, extra rows are filled as -1
| Pixel properties | Quadrant properties | ||||||
|---|---|---|---|---|---|---|---|
| Quadrant | DetID | PixID | Counts | Sigma | Mean | Median | Sigma |
| A | 12 | 96 | 49892 | 520.03 | 471 | 462 | 95.1 |
| A | 9 | 143 | 19124 | 196.33 | 471 | 462 | 95.1 |
| A | 13 | 252 | 10638 | 107.06 | 471 | 462 | 95.1 |
| B | 12 | 111 | 10618 | 113.59 | 467 | 457 | 89.5 |
| B | 11 | 111 | 9307 | 98.93 | 467 | 457 | 89.5 |
| B | 14 | 111 | 8462 | 89.49 | 467 | 457 | 89.5 |
| C | 3 | 233 | 114569 | 1071.89 | 456 | 460 | 106.5 |
| C | 14 | 238 | 71496 | 667.28 | 456 | 460 | 106.5 |
| C | 9 | 54 | 4081 | 34.01 | 456 | 460 | 106.5 |
| D | 5 | 222 | 243099 | 2177.97 | 459 | 447 | 111.4 |
| D | 1 | 52 | 240536 | 2154.97 | 459 | 447 | 111.4 |
| D | 2 | 234 | 13487 | 117.04 | 459 | 447 | 111.4 |
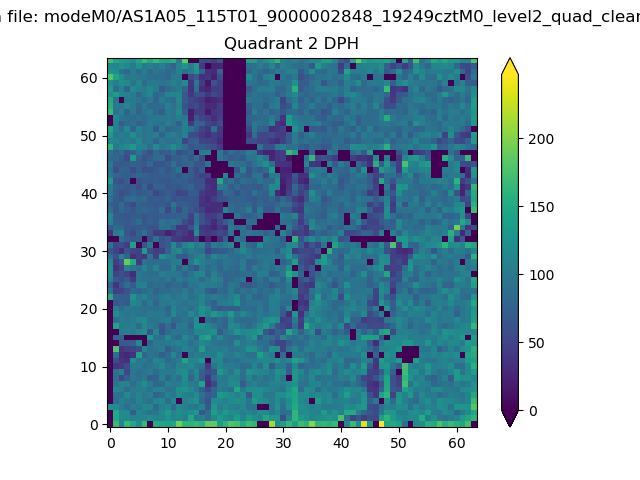
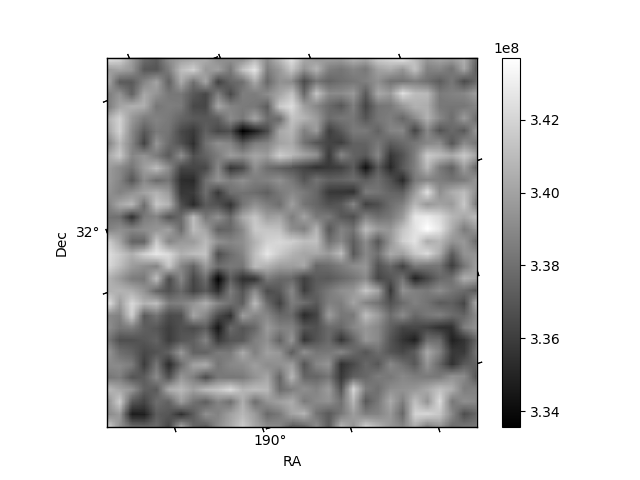
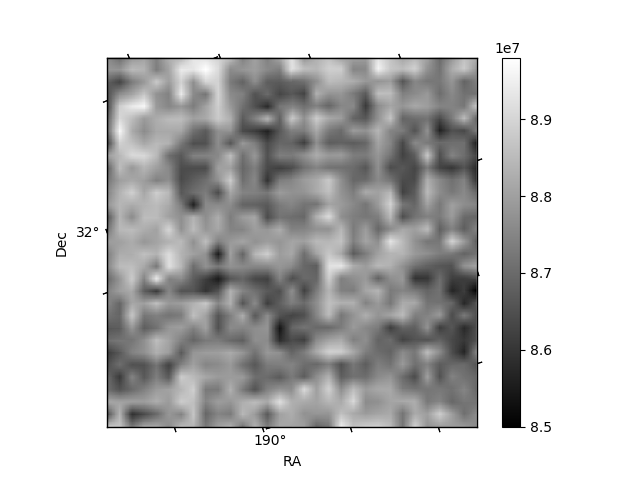
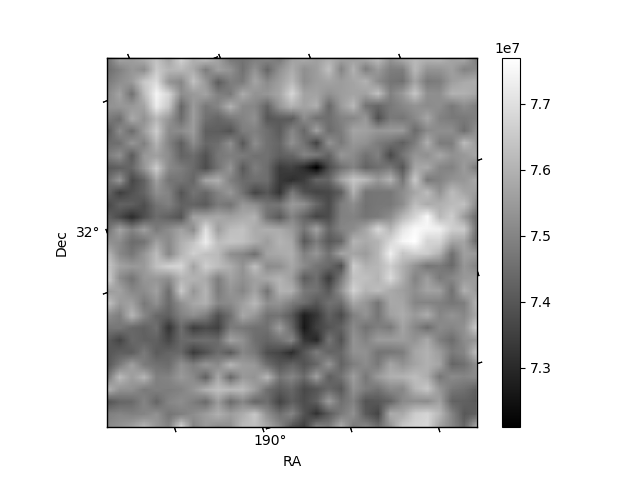
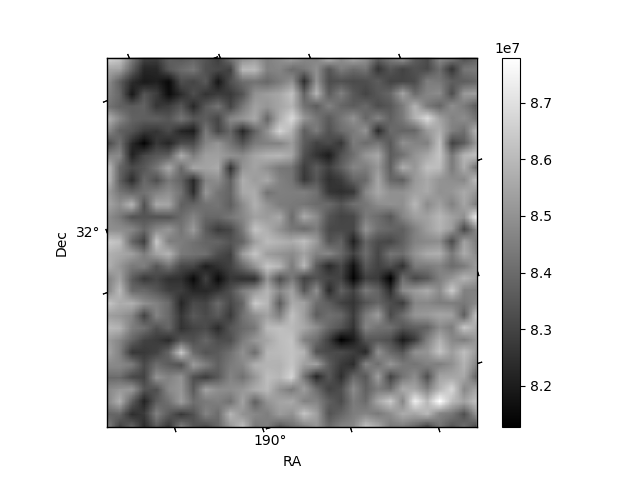
Histogram calculated using DETX and DETY for each event in the final _common_clean file
| Quadrant A | 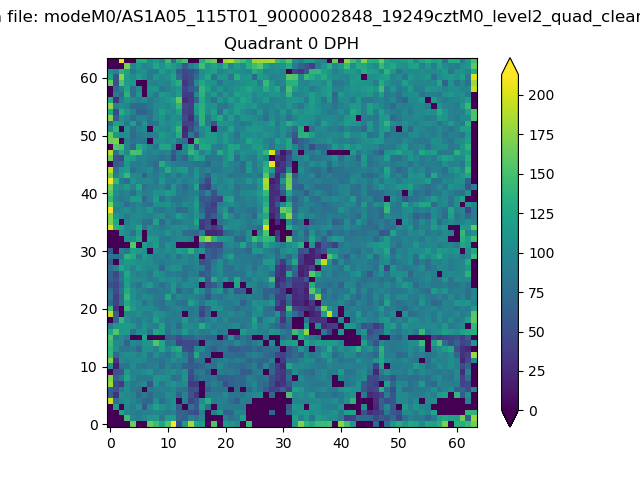 |
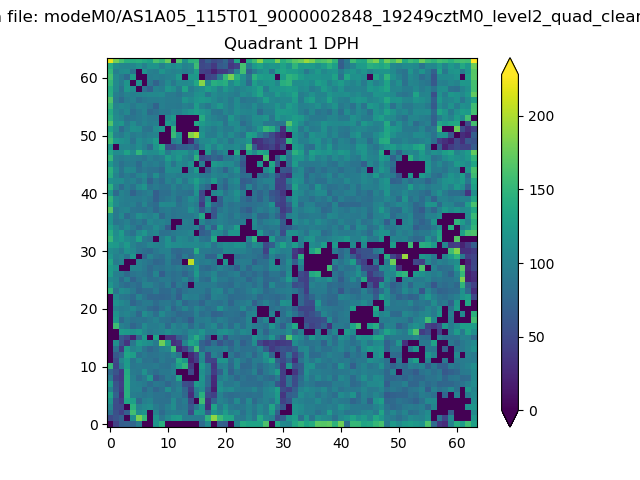 |
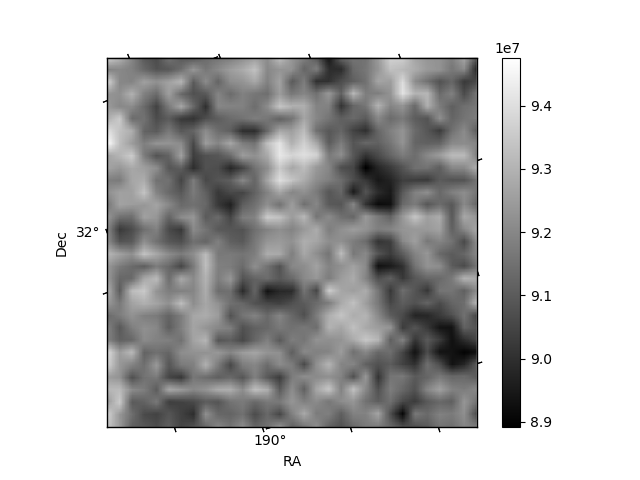
Quadrant B |
|---|---|---|---|
| Quadrant D | 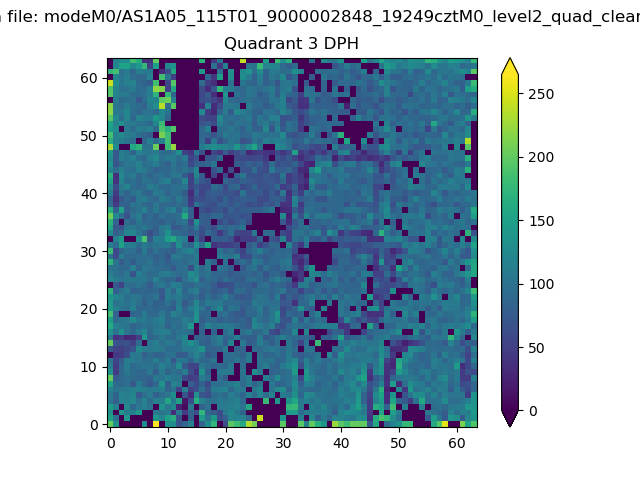 |
 |
Quadrant C |
| Plot type | Count rate plots | Images |
|---|---|---|
| Comparison with Poisson distribution Blue bars denote a histogram of data divided into 1 sec bins. Red curve is a Poisson curve with rate = median count rate of data. |
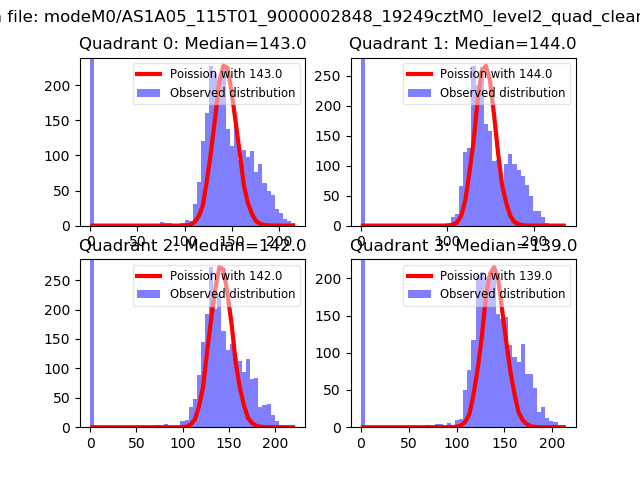 |
 |
| Quadrant-wise count rates Data is divided into 100 sec bins |
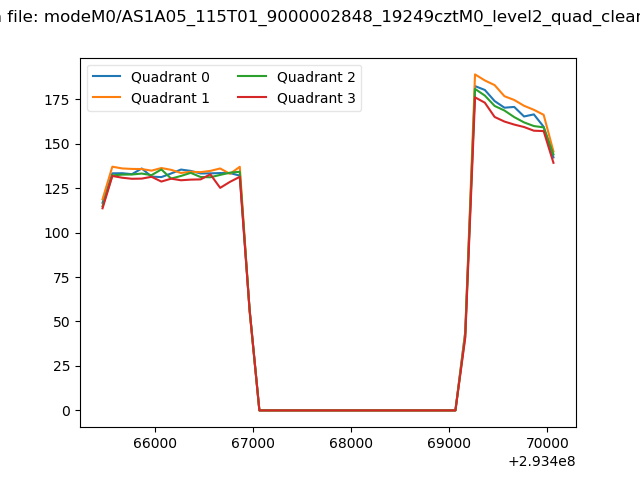 |
|
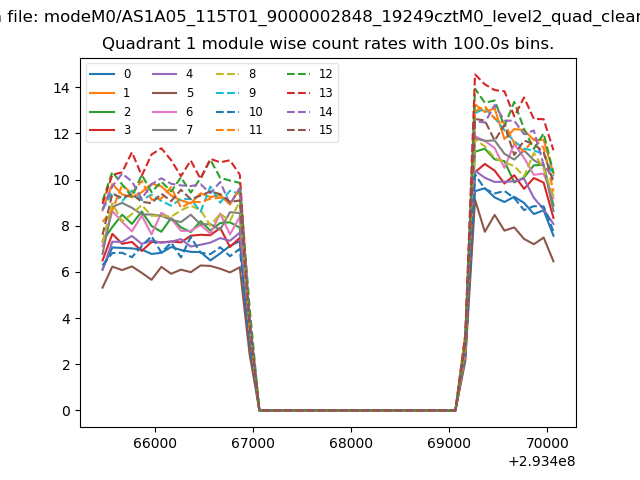
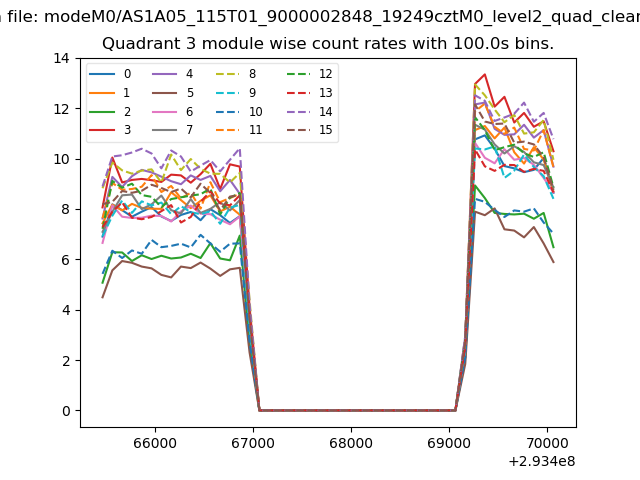
| Module-wise count rates for Quadrant A Data is divided into 100 sec bins |
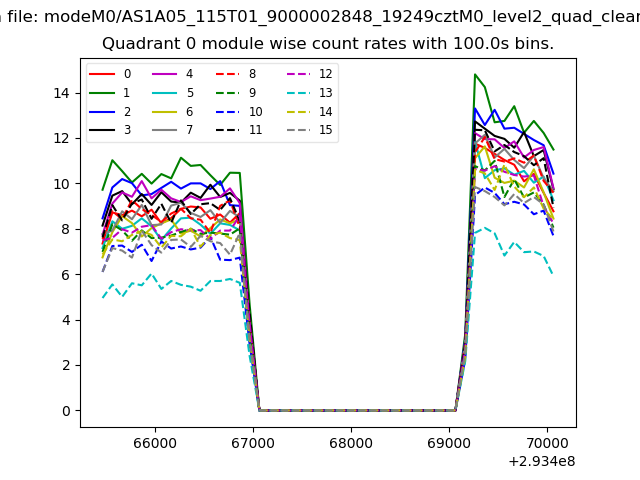 |
 |
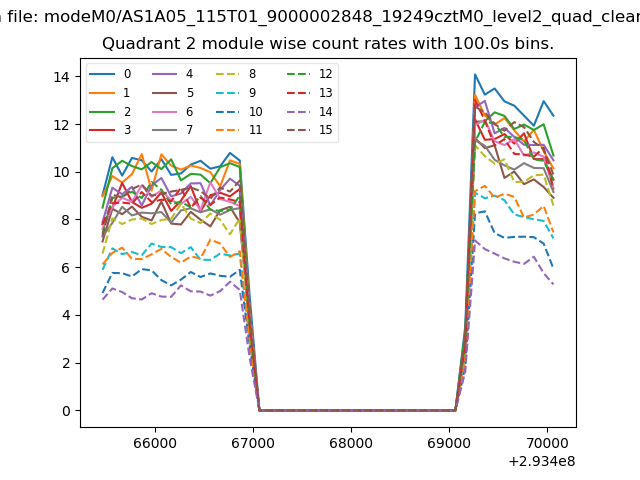
| Module-wise count rates for Quadrant B Data is divided into 100 sec bins |
 |
 |
| Module-wise count rates for Quadrant C Data is divided into 100 sec bins |
 |
 |
| Module-wise count rates for Quadrant D Data is divided into 100 sec bins |
 |
 |
| Parameter | Plot |
|---|---|
| CZT HV Monitor |  |
| D_VDD | 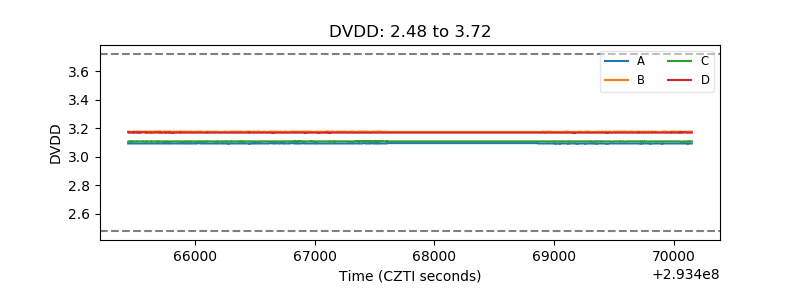 |
| Temperature 1 | 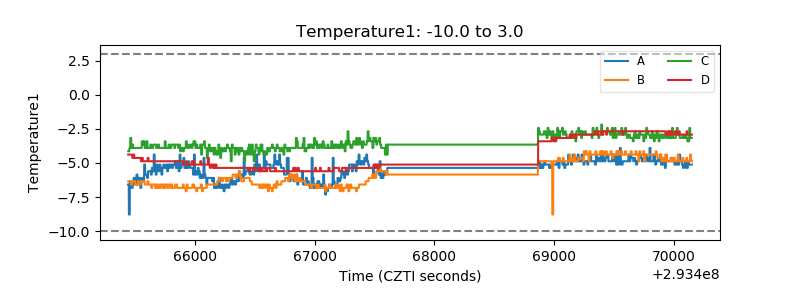 |
| Veto HV Monitor | 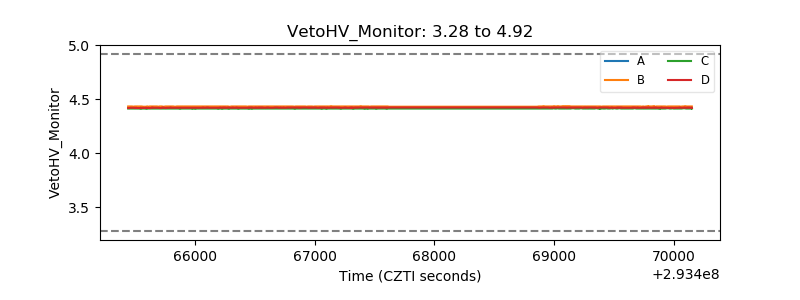 |
| Veto LLD | 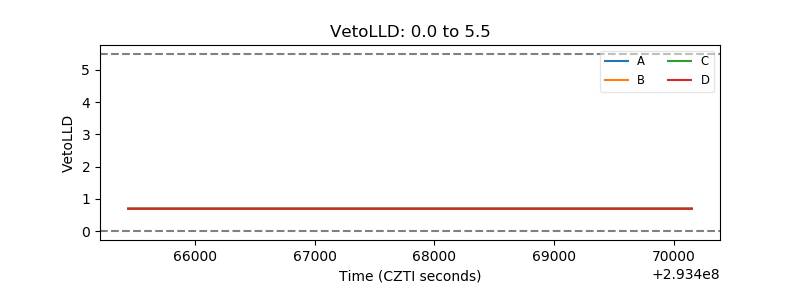 |
| Alpha Counter | 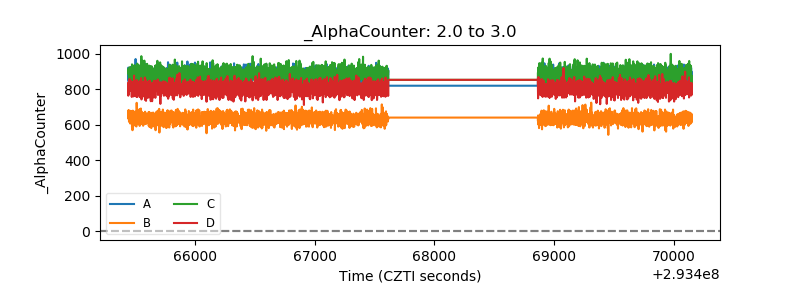 |
| _CPM_Rate | 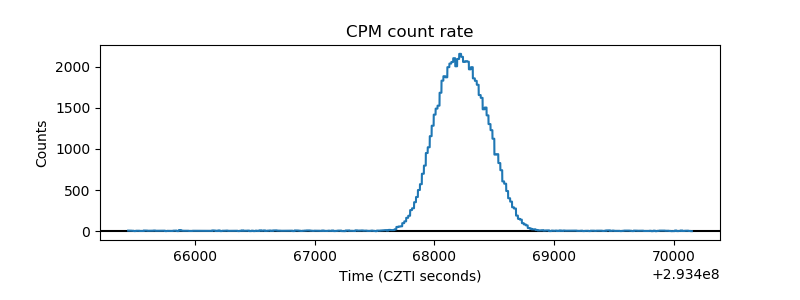 |
| CZT Counter | 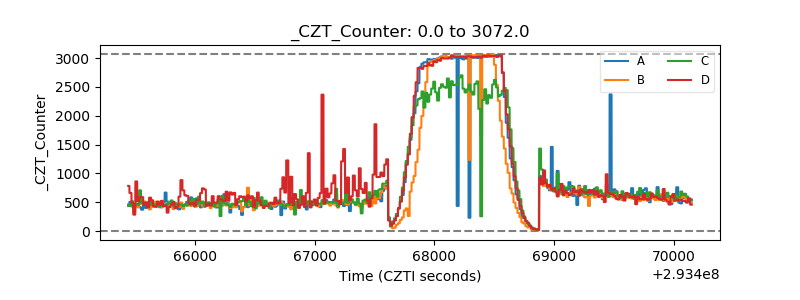 |
| +2.5 Volts monitor |  |
| +5 Volts monitor |  |
| _ROLL_ROT | 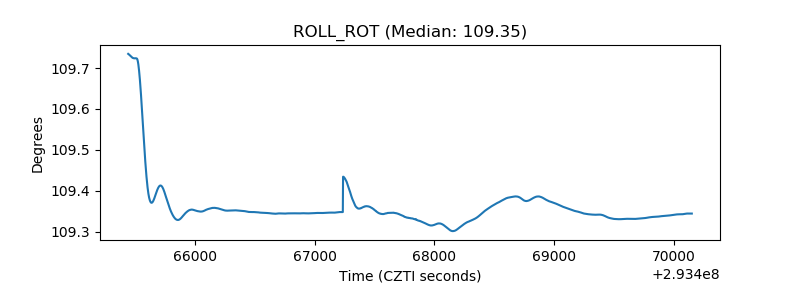 |
| _Roll_DEC | 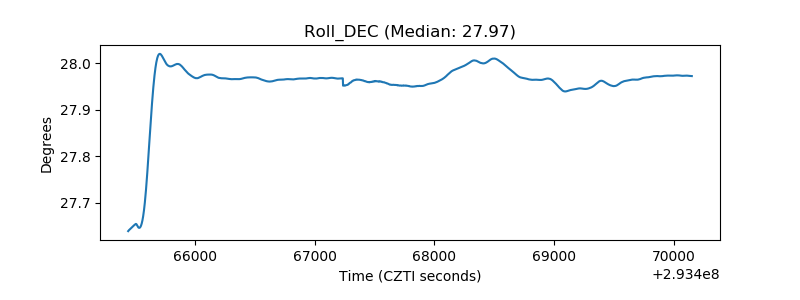 |
| _Roll_RA | 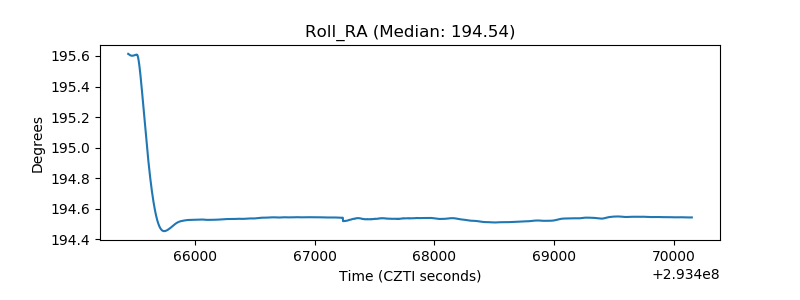 |
| Veto Counter | 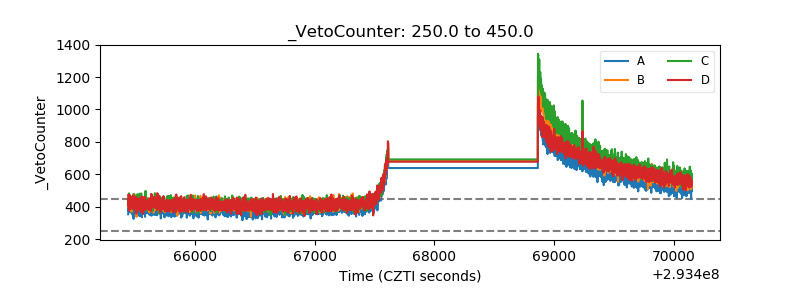 |