| Param | Original file | Final file |
|---|---|---|
| Filename | modeM0/AS1A05_115T01_9000002848_19251cztM0_level2.evt | modeM0/AS1A05_115T01_9000002848_19251cztM0_level2_quad_clean.evt |
| Size (bytes) | 536,414,400 | 115,701,120 |
| Size | 511.6 MB | 110.3 MB |
| Events in quadrant A | 3,462,392 | 771,153 |
| Events in quadrant B | 3,477,345 | 792,841 |
| Events in quadrant C | 3,809,679 | 766,979 |
| Events in quadrant D | 5,053,387 | 718,107 |
| Mode SS | |||
|---|---|---|---|
| Quadrant | BADHDUFLAG | Total packets | Discarded packets |
| A | 0 | 136 | 0 |
| B | 0 | 136 | 0 |
| C | 0 | 136 | 0 |
| D | 0 | 136 | 0 |
| Mode M9 | |||
|---|---|---|---|
| Quadrant | BADHDUFLAG | Total packets | Discarded packets |
| A | 0 | 26 | 0 |
| B | 0 | 26 | 0 |
| C | 0 | 26 | 0 |
| D | 0 | 26 | 0 |
| Mode M0 | |||
|---|---|---|---|
| Quadrant | BADHDUFLAG | Total packets | Discarded packets |
| A | 0 | 14416 | 2 |
| B | 0 | 14436 | 2 |
| C | 0 | 15460 | 2 |
| D | 0 | 19353 | 3 |
| Quadrant | Total seconds | Saturated seconds | Saturation percentage |
|---|---|---|---|
| A | 6518 | 112 | 1.718319% |
| B | 6519 | 143 | 2.193588% |
| C | 6519 | 226 | 3.466789% |
| D | 6518 | 592 | 9.082541% |
Noise dominated data is calculated using 1-second bins in cleaned event files. If a bin has >2000 counts, and if more than 50% of those come from <1% of pixels, then it is considered to be noise-dominated and hence unusable.
| Quadrant | # 1 sec bins | Bins with >0 counts | Bins with >2000 counts | High rate bins dominated by noise | Noise dominated (total time) | Noise dominated (detector-on time) | Marked lightcurve |
|---|---|---|---|---|---|---|---|
| A | 9188 | 6519 | 0 | 0 | 0.00% | 0.00% | 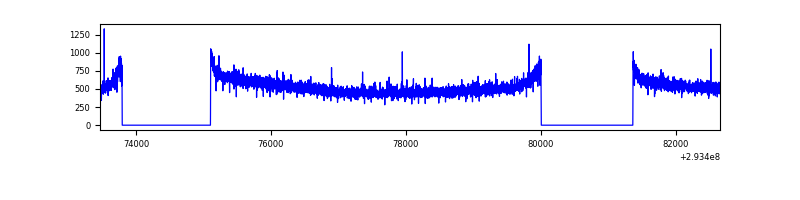 |
| B | 9189 | 6521 | 0 | 0 | 0.00% | 0.00% | 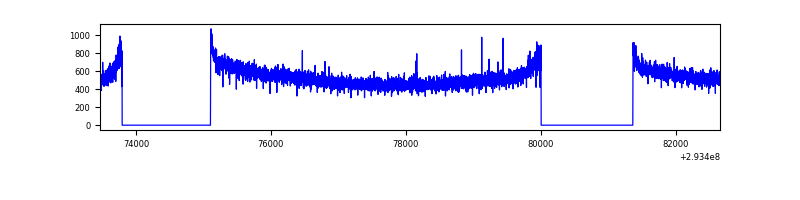 |
| C | 9189 | 6520 | 0 | 0 | 0.00% | 0.00% | 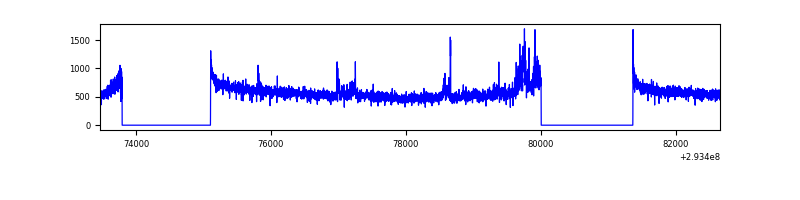 |
| D | 9188 | 6519 | 437 | 437 | 4.76% | 6.70% | 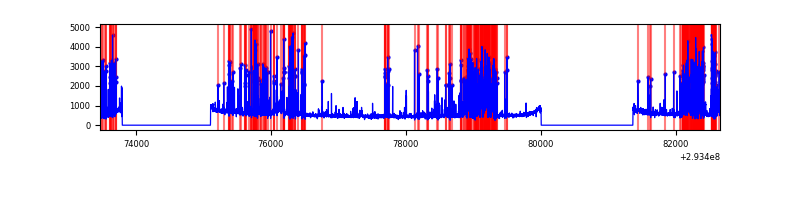 |
Top three noisy pixels from each quadrant. If the there are fewer than three noisy pixels in the level2.evt file, extra rows are filled as -1
| Pixel properties | Quadrant properties | ||||||
|---|---|---|---|---|---|---|---|
| Quadrant | DetID | PixID | Counts | Sigma | Mean | Median | Sigma |
| A | 13 | 254 | 8019 | 40.01 | 895 | 878 | 178.5 |
| A | 0 | 226 | 7821 | 38.9 | 895 | 878 | 178.5 |
| A | 3 | 137 | 6696 | 32.6 | 895 | 878 | 178.5 |
| B | 12 | 111 | 19861 | 113.89 | 889 | 869 | 166.8 |
| B | 11 | 111 | 17689 | 100.86 | 889 | 869 | 166.8 |
| B | 14 | 111 | 16047 | 91.02 | 889 | 869 | 166.8 |
| C | 3 | 233 | 244294 | 1211.72 | 875 | 885 | 200.9 |
| C | 14 | 238 | 136930 | 677.25 | 875 | 885 | 200.9 |
| C | 5 | 112 | 15475 | 72.63 | 875 | 885 | 200.9 |
| D | 1 | 52 | 1037652 | 5056.87 | 861 | 841 | 205.0 |
| D | 7 | 238 | 728468 | 3548.88 | 861 | 841 | 205.0 |
| D | 2 | 234 | 22901 | 107.59 | 861 | 841 | 205.0 |
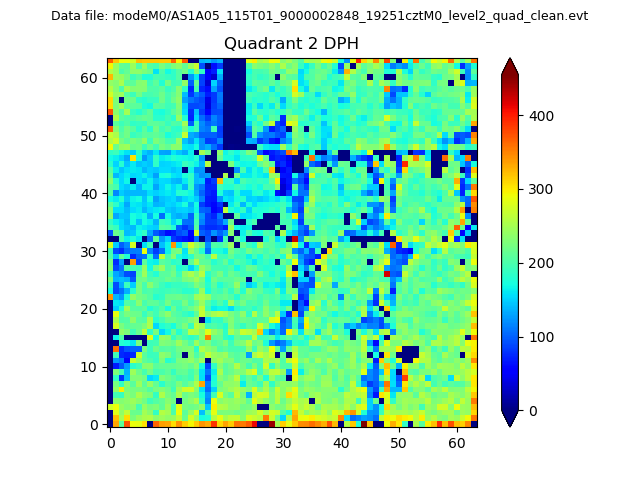
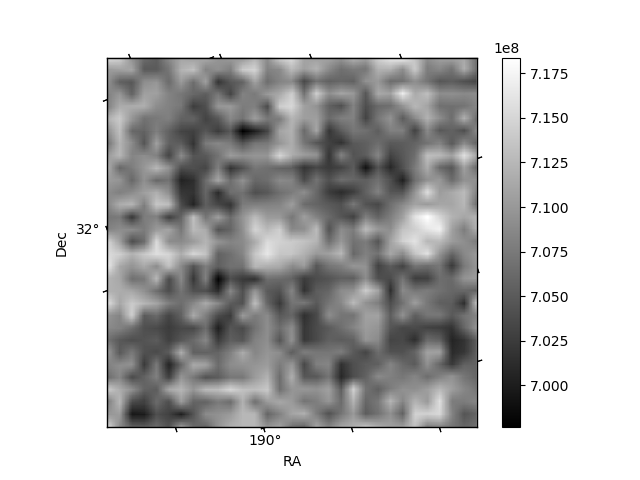
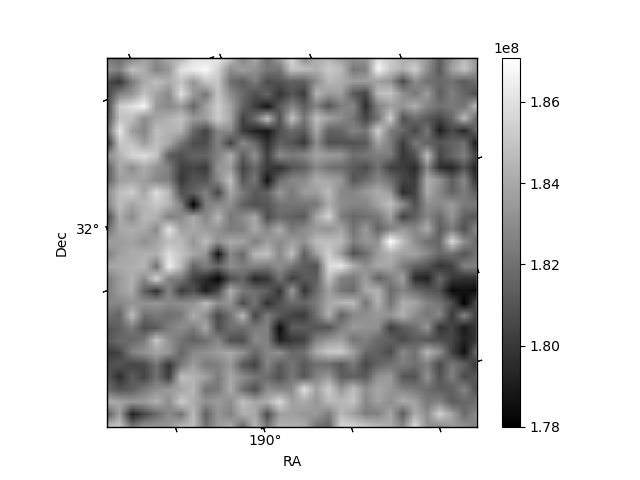
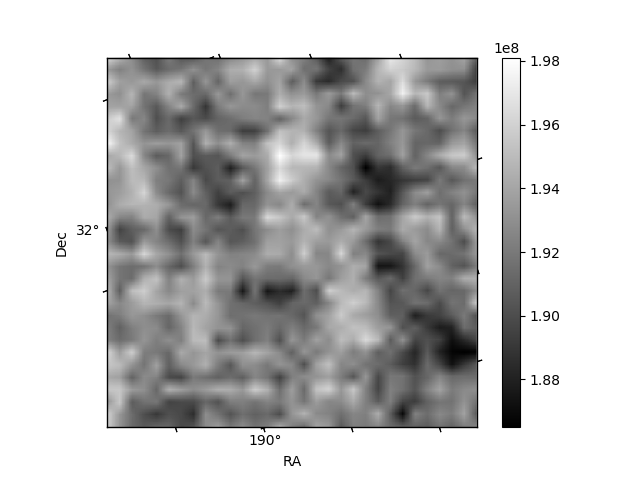
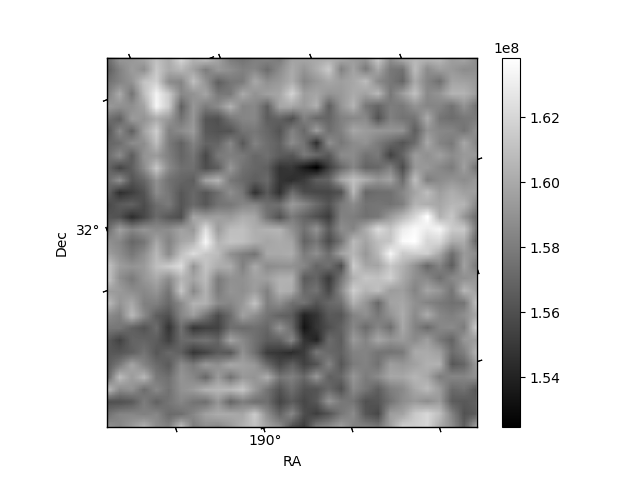
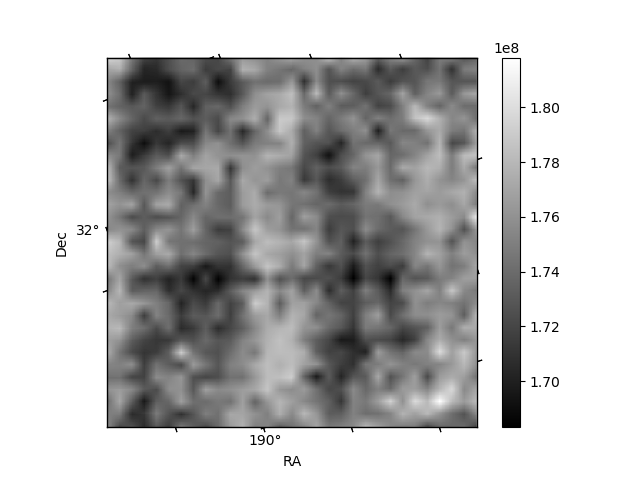
Histogram calculated using DETX and DETY for each event in the final _common_clean file
| Quadrant A | 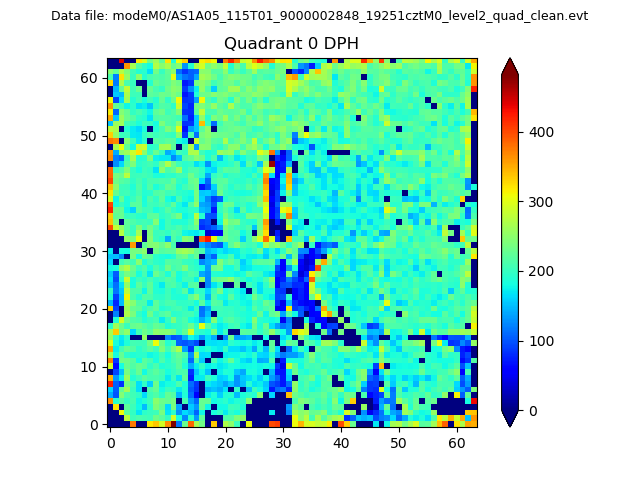 |
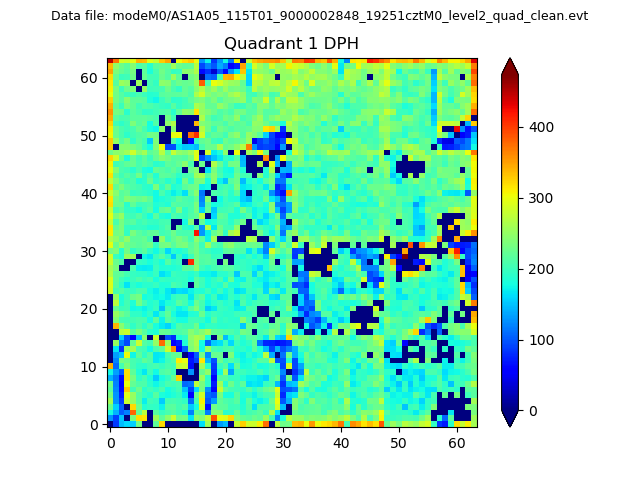 |
Quadrant B |
|---|---|---|---|
| Quadrant D | 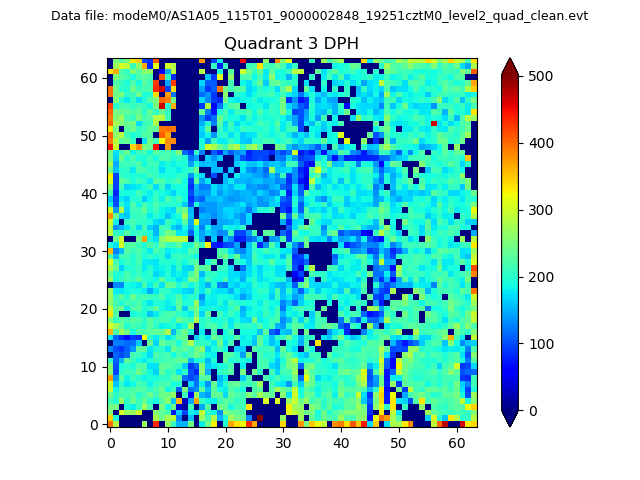 |
 |
Quadrant C |
| Plot type | Count rate plots | Images |
|---|---|---|
| Comparison with Poisson distribution Blue bars denote a histogram of data divided into 1 sec bins. Red curve is a Poisson curve with rate = median count rate of data. |
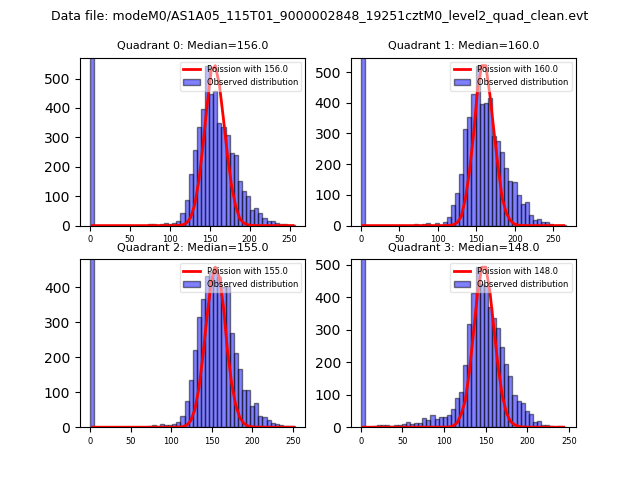 |
 |
| Quadrant-wise count rates Data is divided into 100 sec bins |
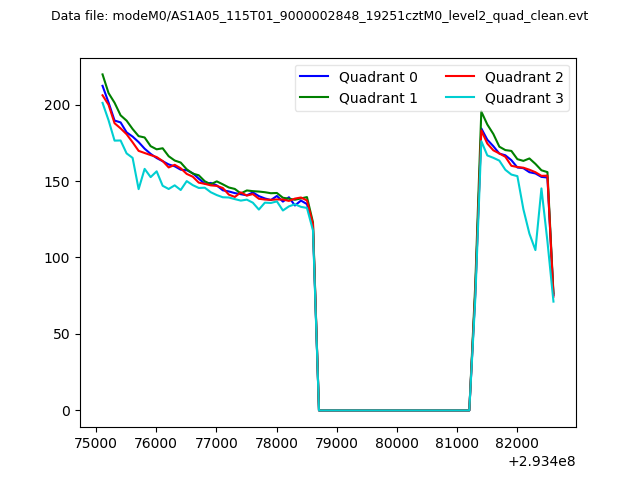 |
|
| Module-wise count rates for Quadrant A Data is divided into 100 sec bins |
 |
 |
| Module-wise count rates for Quadrant B Data is divided into 100 sec bins |
 |
 |
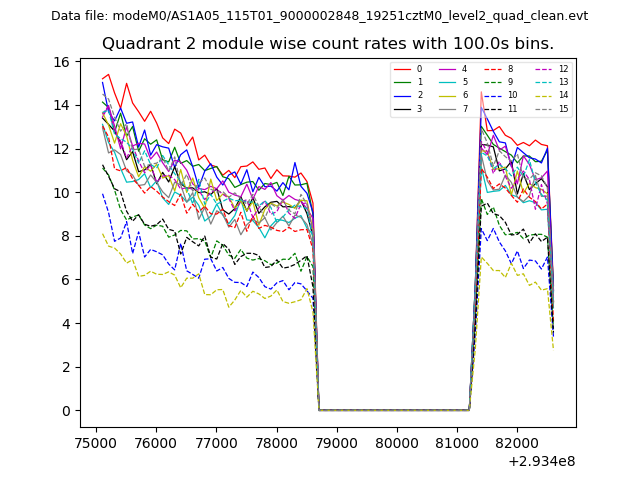
| Module-wise count rates for Quadrant C Data is divided into 100 sec bins |
 |
 |
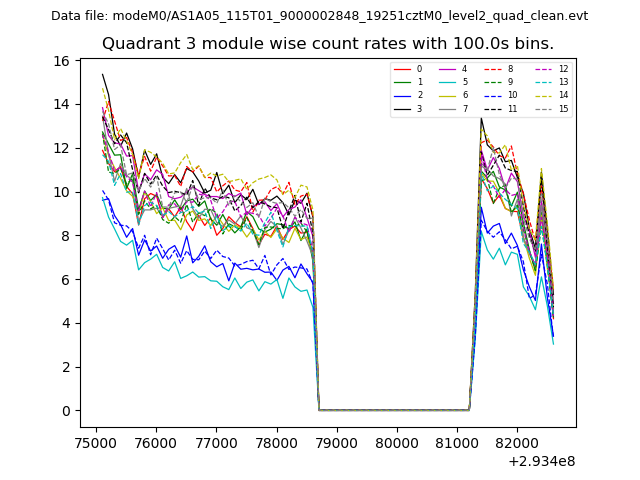
| Module-wise count rates for Quadrant D Data is divided into 100 sec bins |
 |
 |
| Parameter | Plot |
|---|---|
| CZT HV Monitor |  |
| D_VDD | 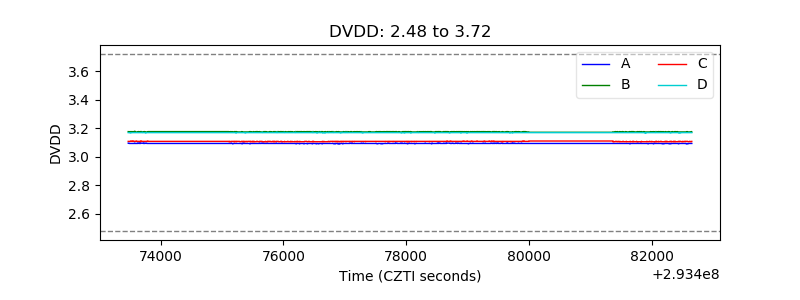 |
| Temperature 1 | 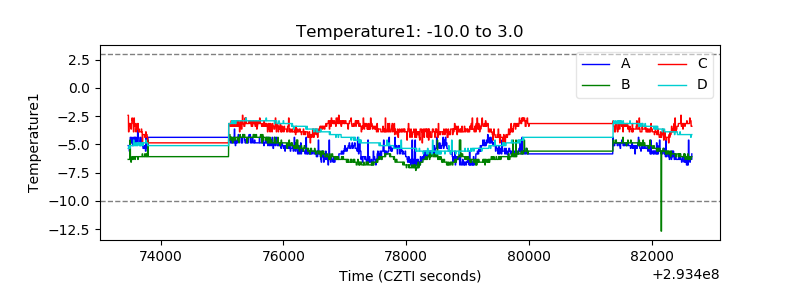 |
| Veto HV Monitor | 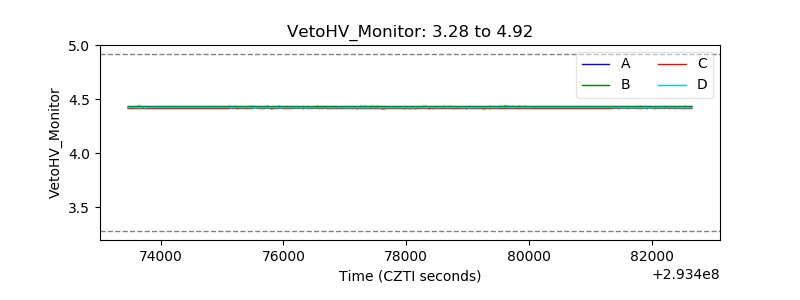 |
| Veto LLD | 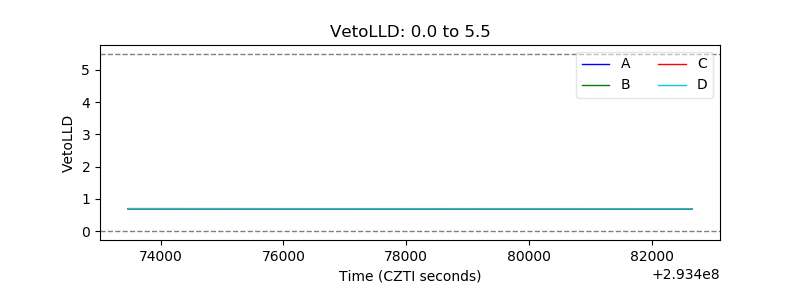 |
| Alpha Counter | 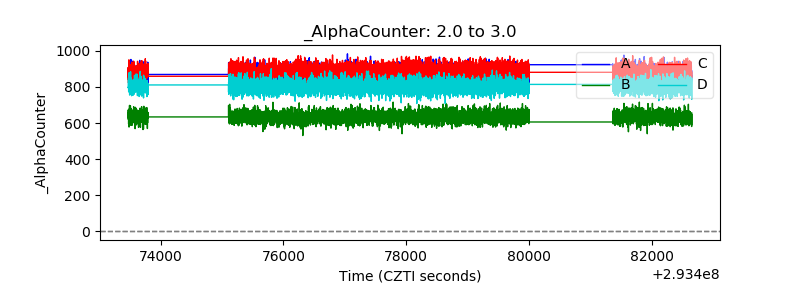 |
| _CPM_Rate | 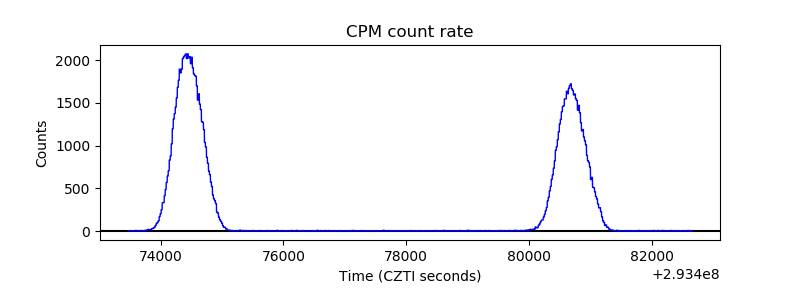 |
| CZT Counter | 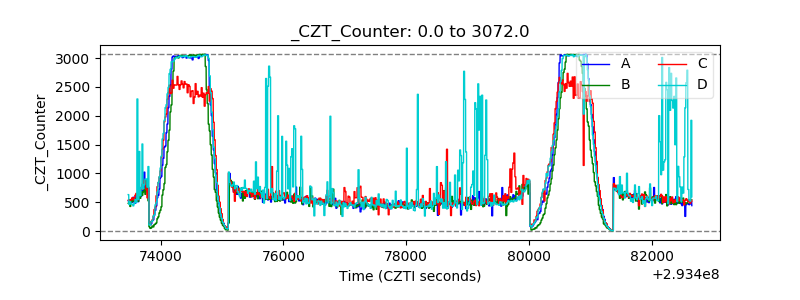 |
| +2.5 Volts monitor |  |
| +5 Volts monitor |  |
| _ROLL_ROT | 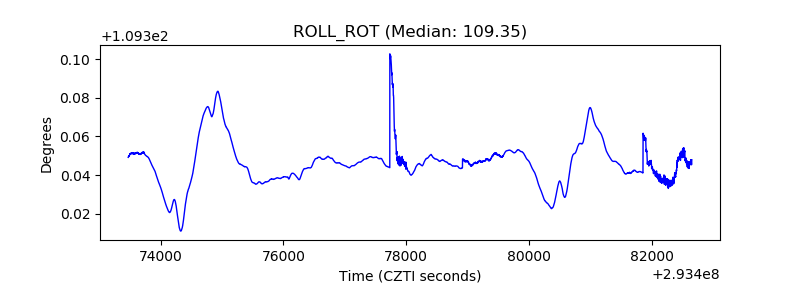 |
| _Roll_DEC | 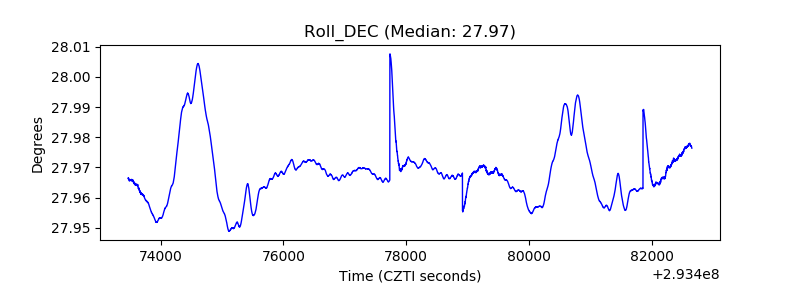 |
| _Roll_RA | 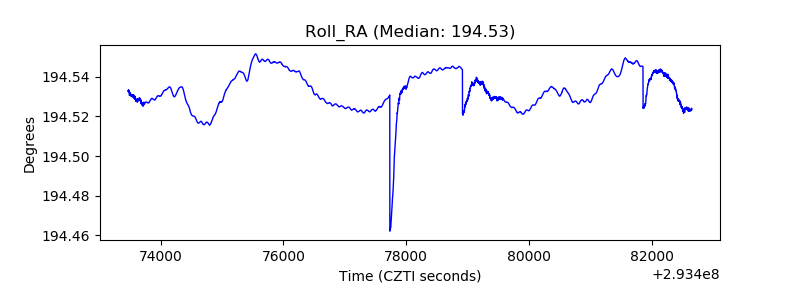 |
| Veto Counter |  |