| Param | Original file | Final file |
|---|---|---|
| Filename | modeM0/AS1A05_115T01_9000002848_19252cztM0_level2.evt | modeM0/AS1A05_115T01_9000002848_19252cztM0_level2_quad_clean.evt |
| Size (bytes) | 479,280,960 | 103,343,040 |
| Size | 457.1 MB | 98.6 MB |
| Events in quadrant A | 3,234,242 | 677,869 |
| Events in quadrant B | 3,253,297 | 695,925 |
| Events in quadrant C | 3,501,673 | 672,226 |
| Events in quadrant D | 4,094,201 | 640,217 |
| Mode SS | |||
|---|---|---|---|
| Quadrant | BADHDUFLAG | Total packets | Discarded packets |
| A | 0 | 130 | 0 |
| B | 0 | 130 | 0 |
| C | 0 | 130 | 0 |
| D | 0 | 130 | 0 |
| Mode M9 | |||
|---|---|---|---|
| Quadrant | BADHDUFLAG | Total packets | Discarded packets |
| A | 0 | 12 | 0 |
| B | 0 | 12 | 0 |
| C | 0 | 12 | 0 |
| D | 0 | 12 | 0 |
| Mode M0 | |||
|---|---|---|---|
| Quadrant | BADHDUFLAG | Total packets | Discarded packets |
| A | 0 | 13653 | 2 |
| B | 0 | 13593 | 2 |
| C | 0 | 14410 | 2 |
| D | 0 | 16260 | 2 |
| Quadrant | Total seconds | Saturated seconds | Saturation percentage |
|---|---|---|---|
| A | 6352 | 58 | 0.913098% |
| B | 6352 | 87 | 1.369647% |
| C | 6352 | 134 | 2.109572% |
| D | 6353 | 283 | 4.454588% |
Noise dominated data is calculated using 1-second bins in cleaned event files. If a bin has >2000 counts, and if more than 50% of those come from <1% of pixels, then it is considered to be noise-dominated and hence unusable.
| Quadrant | # 1 sec bins | Bins with >0 counts | Bins with >2000 counts | High rate bins dominated by noise | Noise dominated (total time) | Noise dominated (detector-on time) | Marked lightcurve |
|---|---|---|---|---|---|---|---|
| A | 7607 | 6353 | 2 | 2 | 0.03% | 0.03% | 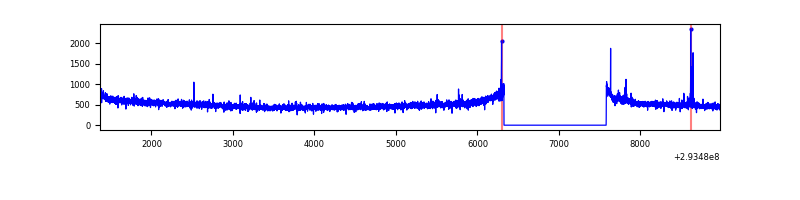 |
| B | 7607 | 6353 | 2 | 2 | 0.03% | 0.03% | 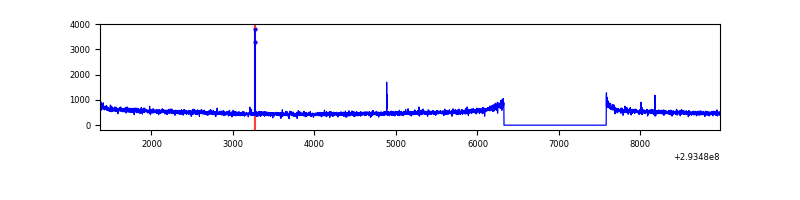 |
| C | 7607 | 6353 | 7 | 7 | 0.09% | 0.11% | 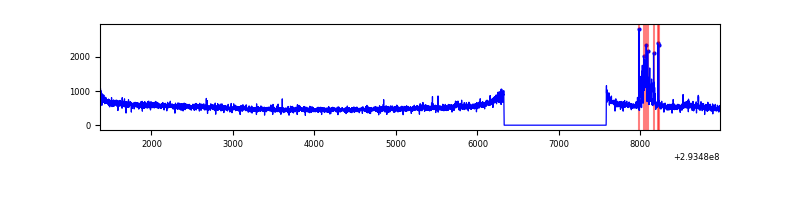 |
| D | 7608 | 6354 | 202 | 202 | 2.66% | 3.18% | 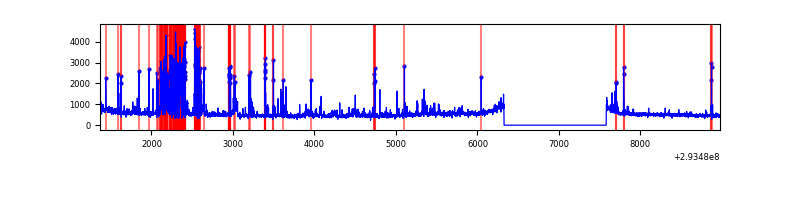 |
Top three noisy pixels from each quadrant. If the there are fewer than three noisy pixels in the level2.evt file, extra rows are filled as -1
| Pixel properties | Quadrant properties | ||||||
|---|---|---|---|---|---|---|---|
| Quadrant | DetID | PixID | Counts | Sigma | Mean | Median | Sigma |
| A | 12 | 96 | 25701 | 149.99 | 828 | 811 | 165.9 |
| A | 11 | 29 | 17485 | 100.48 | 828 | 811 | 165.9 |
| A | 0 | 226 | 7176 | 38.36 | 828 | 811 | 165.9 |
| B | 12 | 111 | 18415 | 112.86 | 828 | 807 | 156.0 |
| B | 11 | 111 | 16537 | 100.82 | 828 | 807 | 156.0 |
| B | 14 | 111 | 14843 | 89.96 | 828 | 807 | 156.0 |
| C | 14 | 238 | 125382 | 662.98 | 812 | 822 | 187.9 |
| C | 6 | 96 | 113888 | 601.81 | 812 | 822 | 187.9 |
| C | 3 | 233 | 92401 | 487.44 | 812 | 822 | 187.9 |
| D | 1 | 52 | 681315 | 3477.68 | 810 | 790 | 195.7 |
| D | 5 | 222 | 167284 | 850.83 | 810 | 790 | 195.7 |
| D | 7 | 238 | 113981 | 578.44 | 810 | 790 | 195.7 |
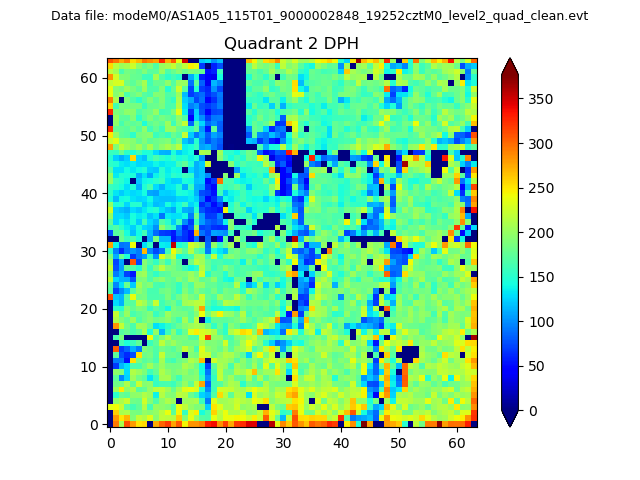
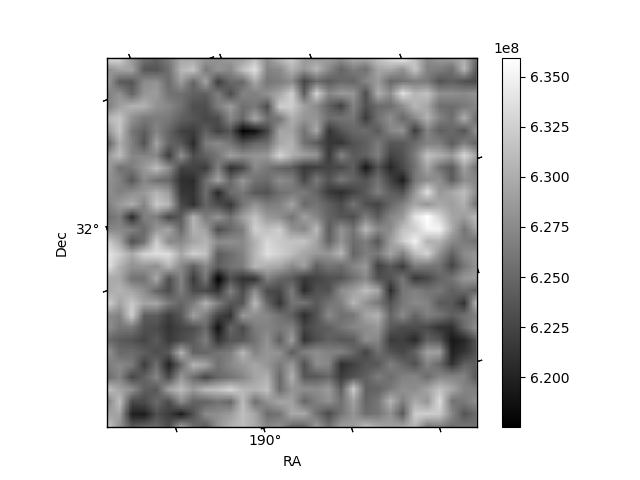
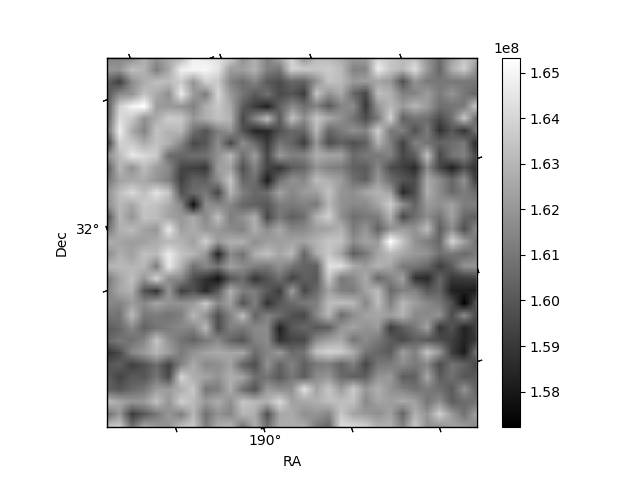
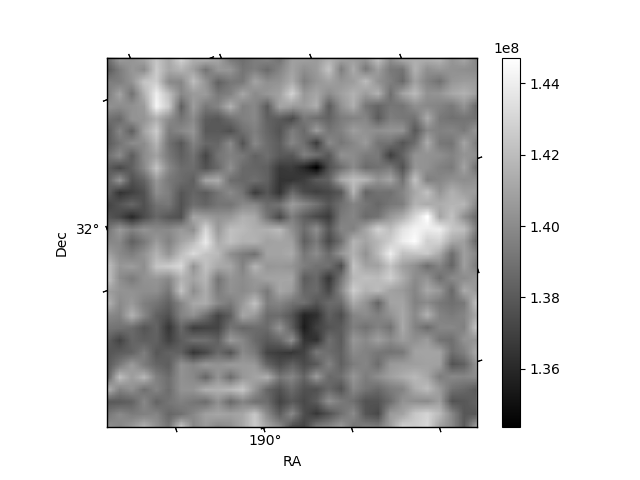
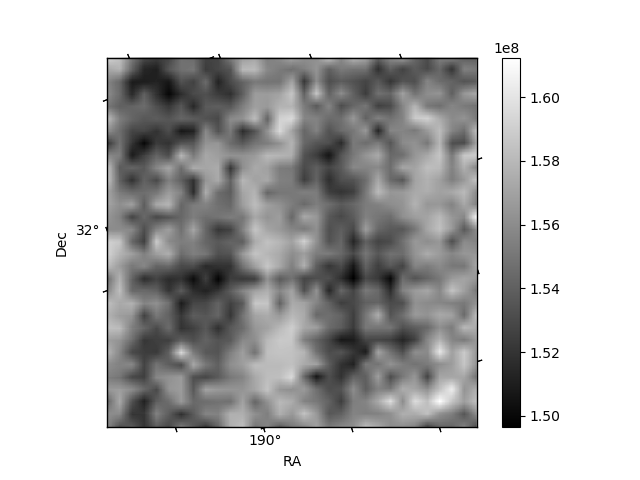
Histogram calculated using DETX and DETY for each event in the final _common_clean file
| Quadrant A | 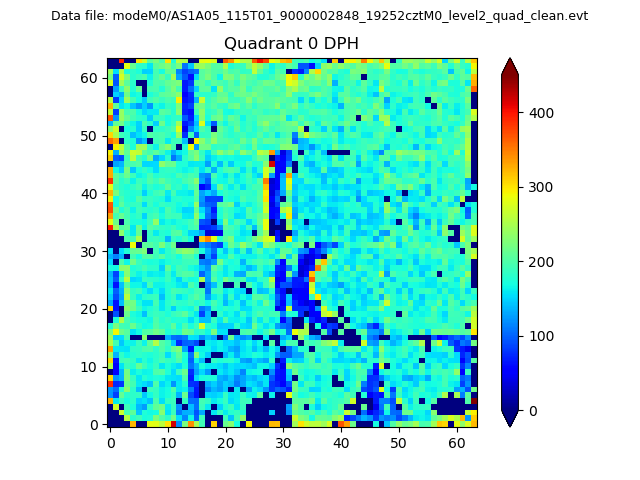 |
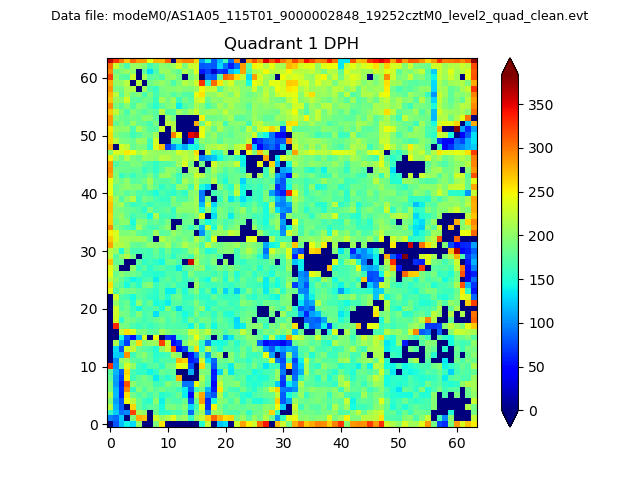 |
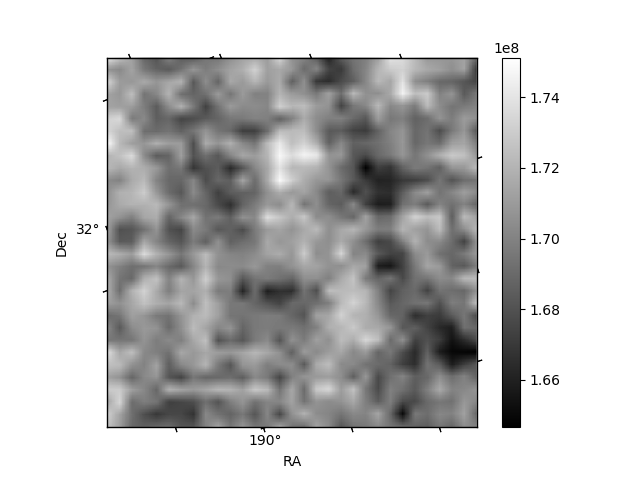
Quadrant B |
|---|---|---|---|
| Quadrant D | 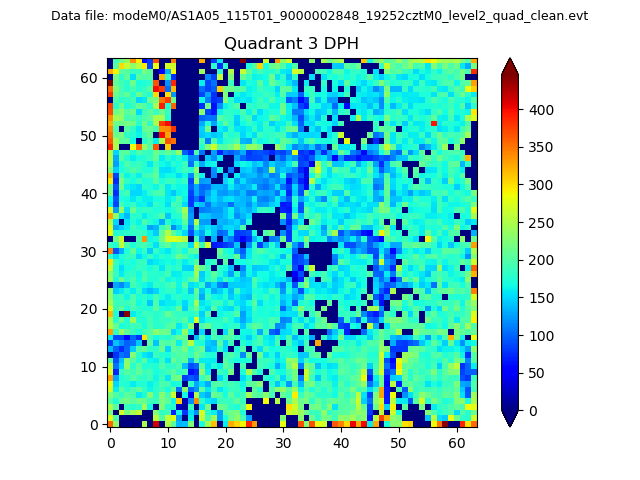 |
 |
Quadrant C |
| Plot type | Count rate plots | Images |
|---|---|---|
| Comparison with Poisson distribution Blue bars denote a histogram of data divided into 1 sec bins. Red curve is a Poisson curve with rate = median count rate of data. |
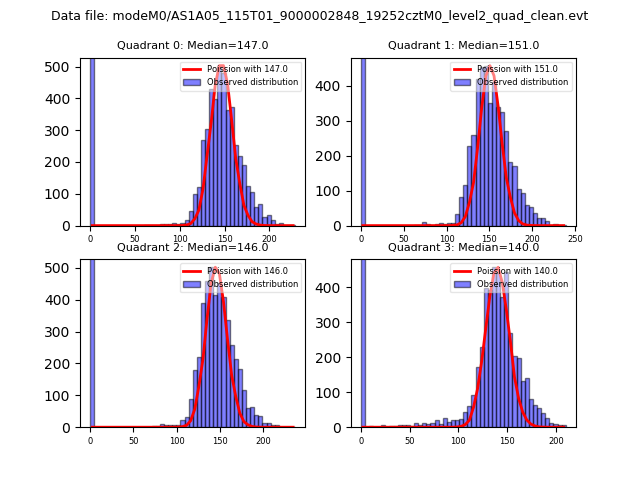 |
 |
| Quadrant-wise count rates Data is divided into 100 sec bins |
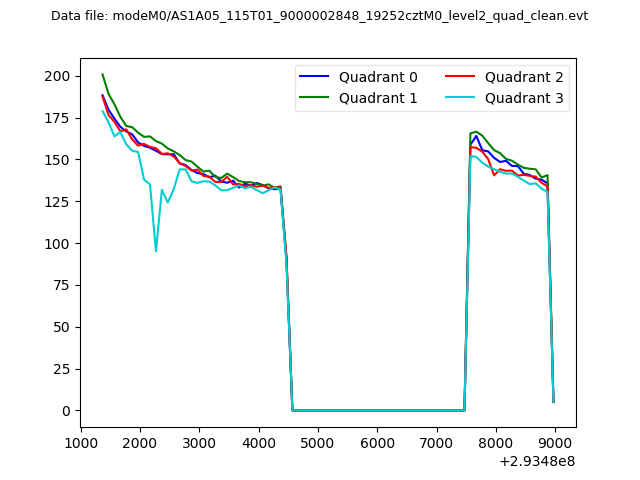 |
|
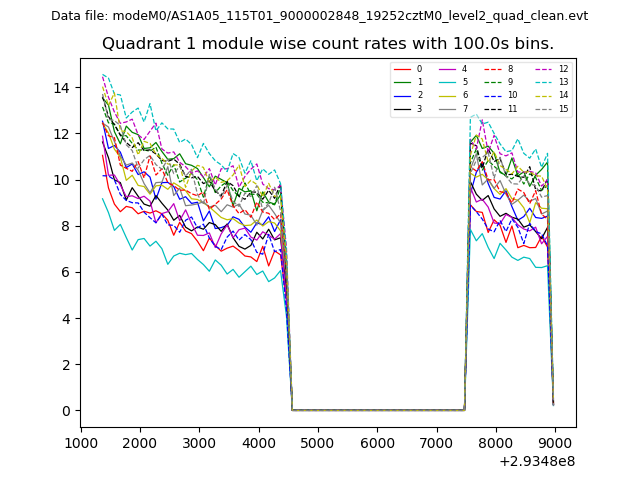
| Module-wise count rates for Quadrant A Data is divided into 100 sec bins |
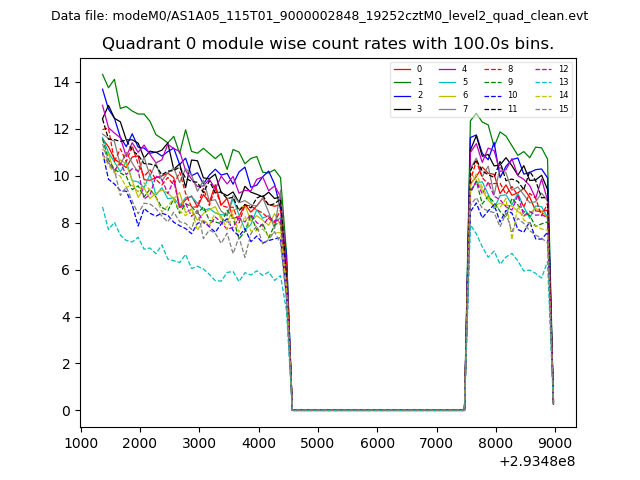 |
 |
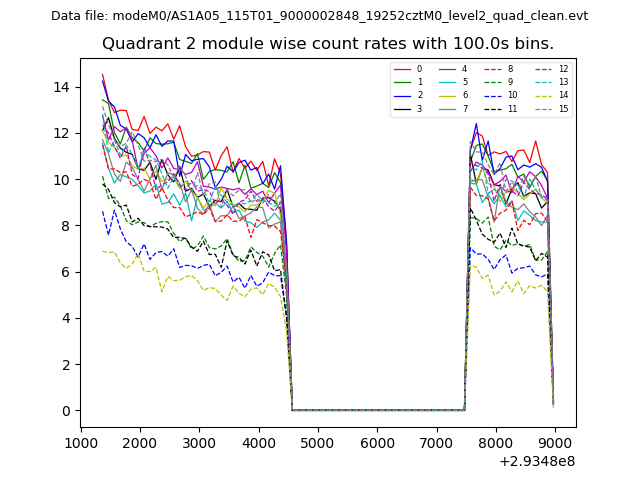
| Module-wise count rates for Quadrant B Data is divided into 100 sec bins |
 |
 |
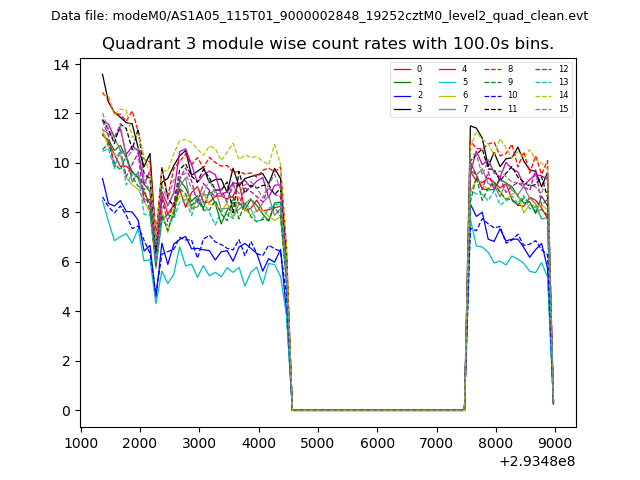
| Module-wise count rates for Quadrant C Data is divided into 100 sec bins |
 |
 |
| Module-wise count rates for Quadrant D Data is divided into 100 sec bins |
 |
 |
| Parameter | Plot |
|---|---|
| CZT HV Monitor | 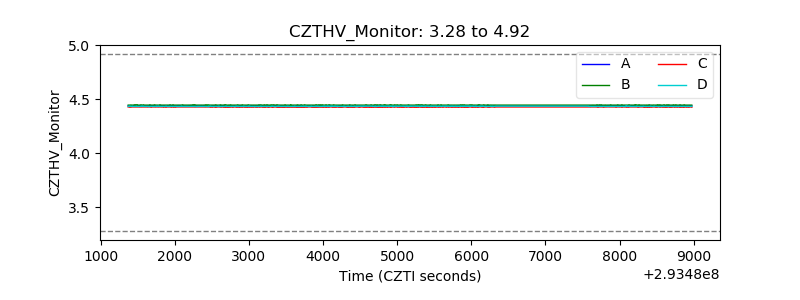 |
| D_VDD | 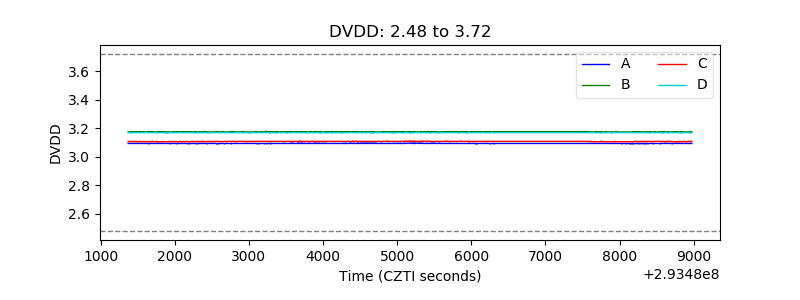 |
| Temperature 1 | 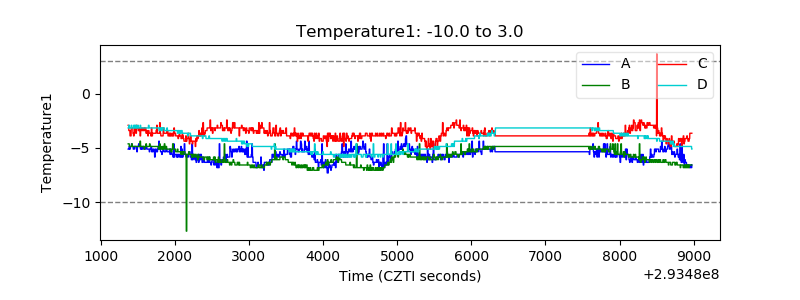 |
| Veto HV Monitor | 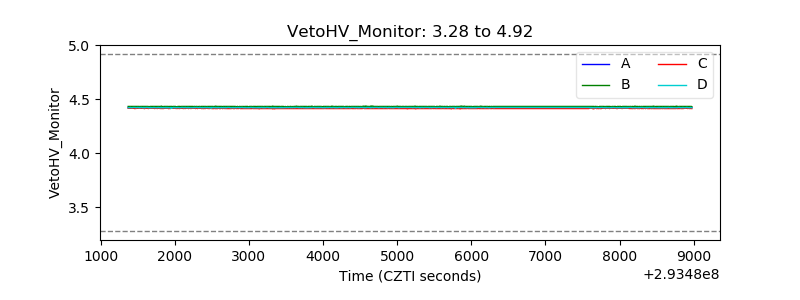 |
| Veto LLD | 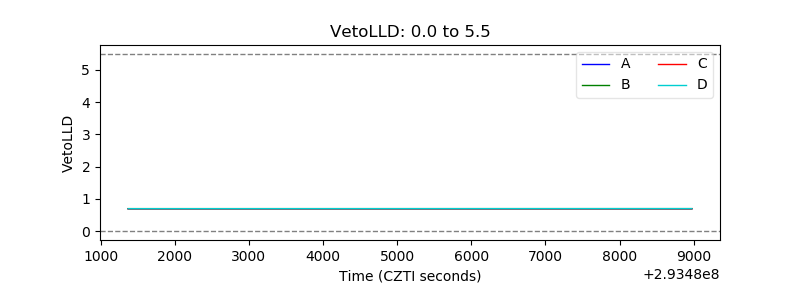 |
| Alpha Counter | 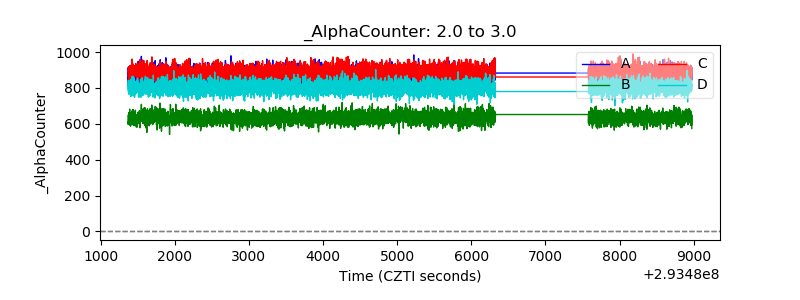 |
| _CPM_Rate | 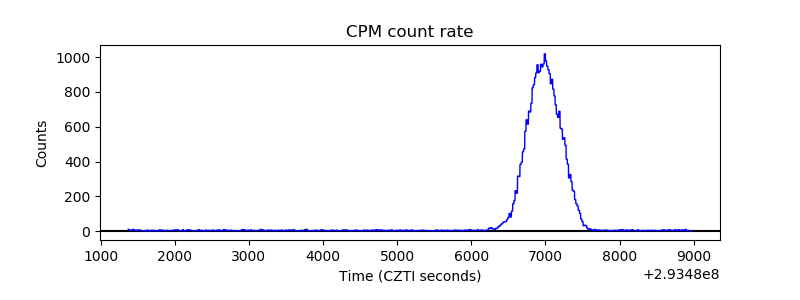 |
| CZT Counter |  |
| +2.5 Volts monitor |  |
| +5 Volts monitor |  |
| _ROLL_ROT | 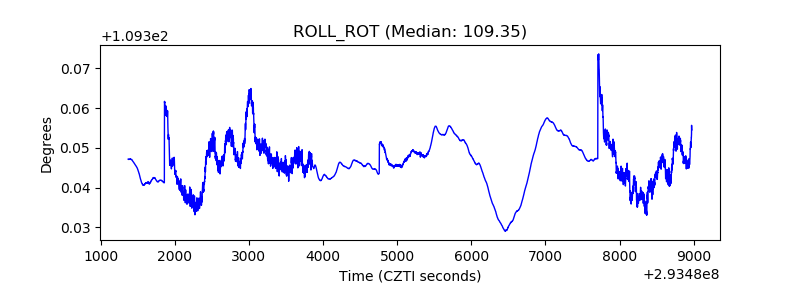 |
| _Roll_DEC |  |
| _Roll_RA |  |
| Veto Counter | 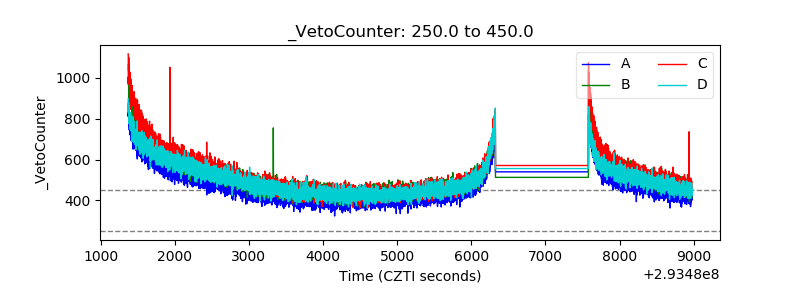 |