| Param | Original file | Final file |
|---|---|---|
| Filename | modeM0/AS1A05_115T01_9000002848_19255cztM0_level2.evt | modeM0/AS1A05_115T01_9000002848_19255cztM0_level2_quad_clean.evt |
| Size (bytes) | 581,446,080 | 116,740,800 |
| Size | 554.5 MB | 111.3 MB |
| Events in quadrant A | 3,989,880 | 752,129 |
| Events in quadrant B | 3,844,126 | 766,050 |
| Events in quadrant C | 4,156,772 | 737,464 |
| Events in quadrant D | 5,070,646 | 718,577 |
| Mode SS | |||
|---|---|---|---|
| Quadrant | BADHDUFLAG | Total packets | Discarded packets |
| A | 0 | 168 | 0 |
| B | 0 | 168 | 0 |
| C | 0 | 168 | 0 |
| D | 0 | 168 | 0 |
| Mode M9 | |||
|---|---|---|---|
| Quadrant | BADHDUFLAG | Total packets | Discarded packets |
| A | 0 | 8 | 0 |
| B | 0 | 8 | 0 |
| C | 0 | 8 | 0 |
| D | 0 | 8 | 0 |
| Mode M0 | |||
|---|---|---|---|
| Quadrant | BADHDUFLAG | Total packets | Discarded packets |
| A | 0 | 17234 | 2 |
| B | 0 | 16757 | 2 |
| C | 0 | 17357 | 2 |
| D | 0 | 20435 | 2 |
| Quadrant | Total seconds | Saturated seconds | Saturation percentage |
|---|---|---|---|
| A | 8065 | 72 | 0.892746% |
| B | 8066 | 69 | 0.855443% |
| C | 8066 | 128 | 1.586908% |
| D | 8066 | 201 | 2.491941% |
Noise dominated data is calculated using 1-second bins in cleaned event files. If a bin has >2000 counts, and if more than 50% of those come from <1% of pixels, then it is considered to be noise-dominated and hence unusable.
| Quadrant | # 1 sec bins | Bins with >0 counts | Bins with >2000 counts | High rate bins dominated by noise | Noise dominated (total time) | Noise dominated (detector-on time) | Marked lightcurve |
|---|---|---|---|---|---|---|---|
| A | 8960 | 8067 | 33 | 33 | 0.37% | 0.41% | 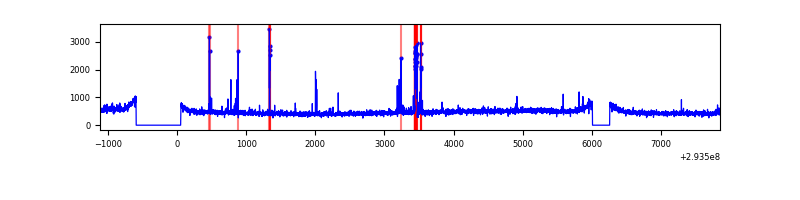 |
| B | 8961 | 8068 | 0 | 0 | 0.00% | 0.00% | 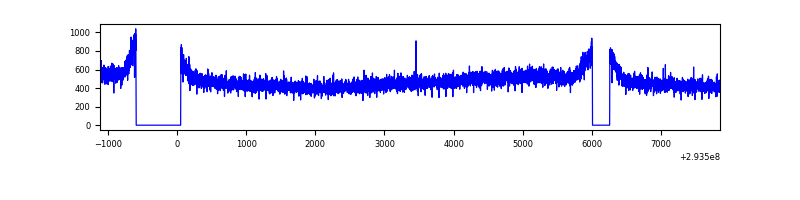 |
| C | 8961 | 8068 | 18 | 18 | 0.20% | 0.22% | 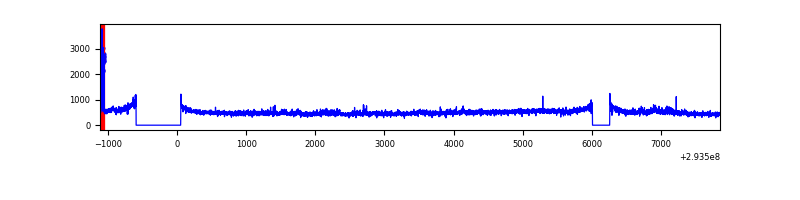 |
| D | 8961 | 8067 | 132 | 132 | 1.47% | 1.64% | 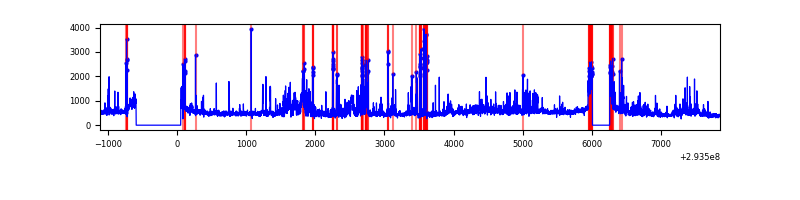 |
Top three noisy pixels from each quadrant. If the there are fewer than three noisy pixels in the level2.evt file, extra rows are filled as -1
| Pixel properties | Quadrant properties | ||||||
|---|---|---|---|---|---|---|---|
| Quadrant | DetID | PixID | Counts | Sigma | Mean | Median | Sigma |
| A | 5 | 16 | 176635 | 883.32 | 980 | 958 | 198.9 |
| A | 8 | 205 | 16804 | 79.68 | 980 | 958 | 198.9 |
| A | 11 | 29 | 11192 | 51.46 | 980 | 958 | 198.9 |
| B | 12 | 111 | 23828 | 119.57 | 979 | 952 | 191.3 |
| B | 11 | 111 | 20993 | 104.75 | 979 | 952 | 191.3 |
| B | 14 | 111 | 19324 | 96.03 | 979 | 952 | 191.3 |
| C | 3 | 233 | 237331 | 1053.02 | 950 | 955 | 224.5 |
| C | 14 | 238 | 144144 | 637.89 | 950 | 955 | 224.5 |
| C | 9 | 54 | 69783 | 306.62 | 950 | 955 | 224.5 |
| D | 1 | 52 | 1244424 | 5383.52 | 948 | 920 | 231.0 |
| D | 13 | 104 | 199666 | 860.43 | 948 | 920 | 231.0 |
| D | 5 | 222 | 31154 | 130.89 | 948 | 920 | 231.0 |
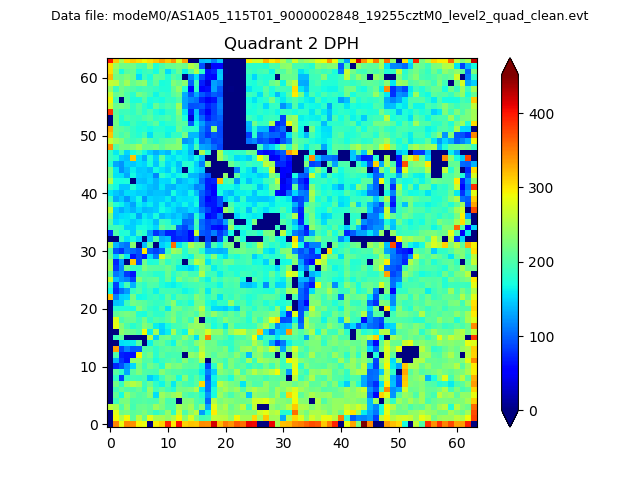
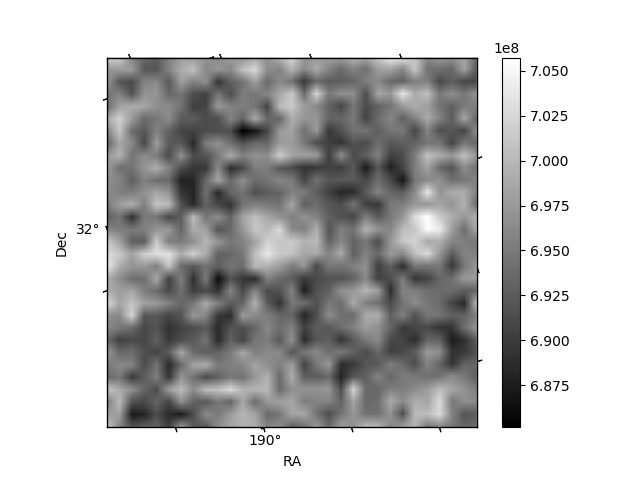
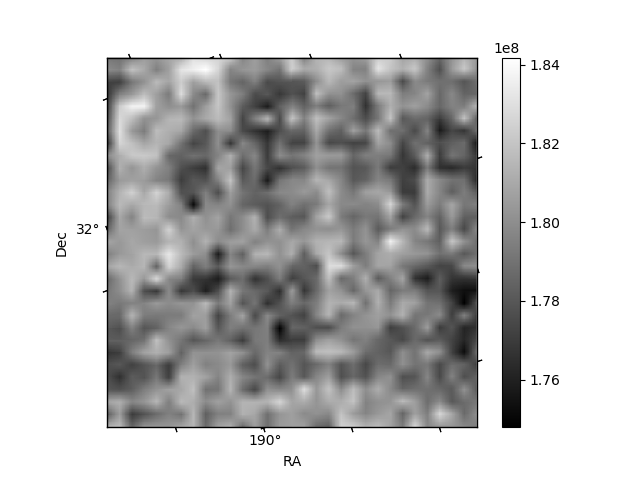
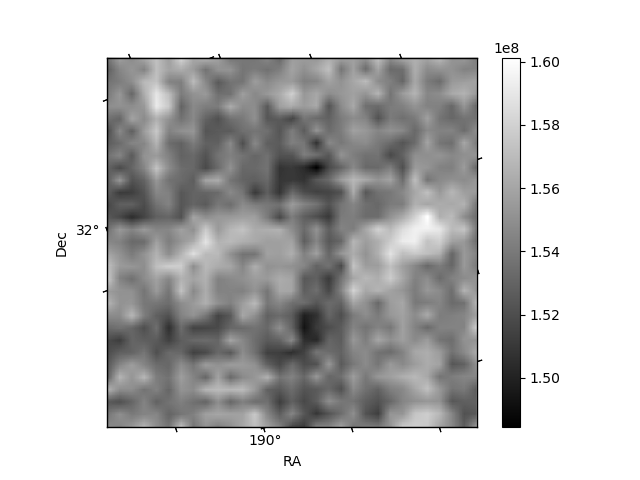
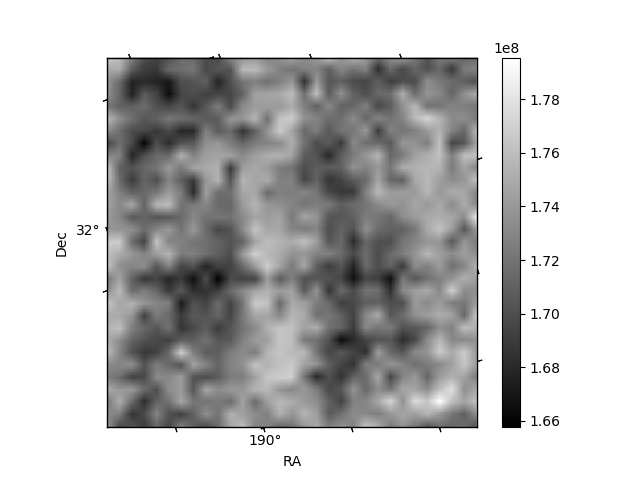
Histogram calculated using DETX and DETY for each event in the final _common_clean file
| Quadrant A | 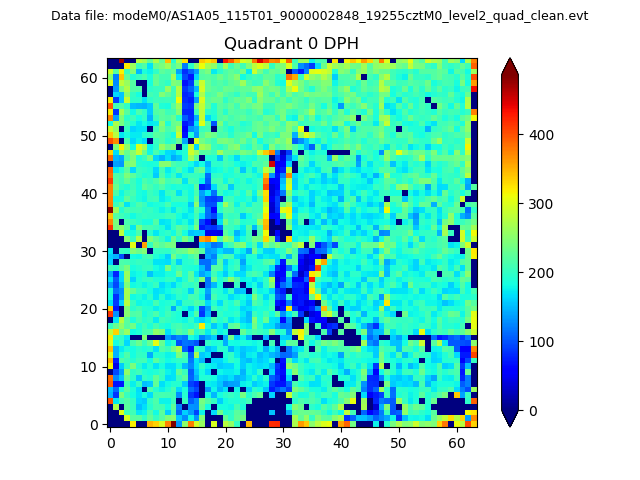 |
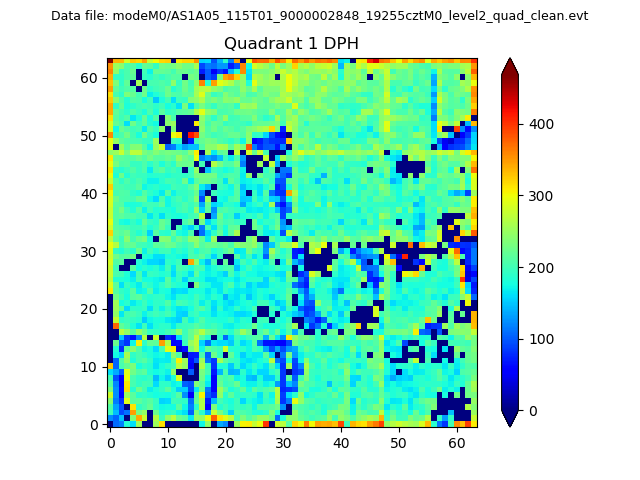 |
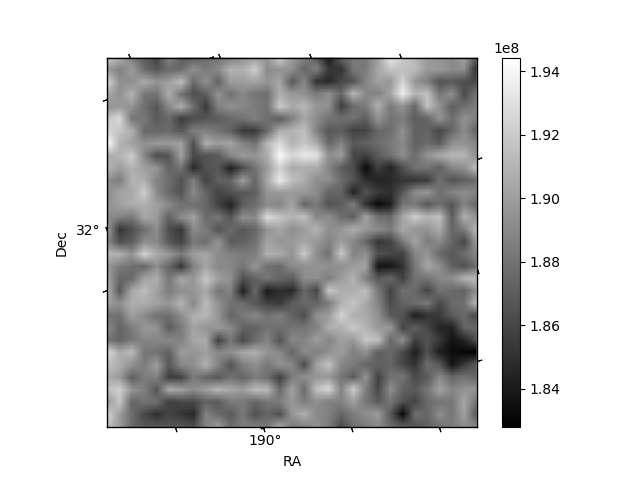
Quadrant B |
|---|---|---|---|
| Quadrant D | 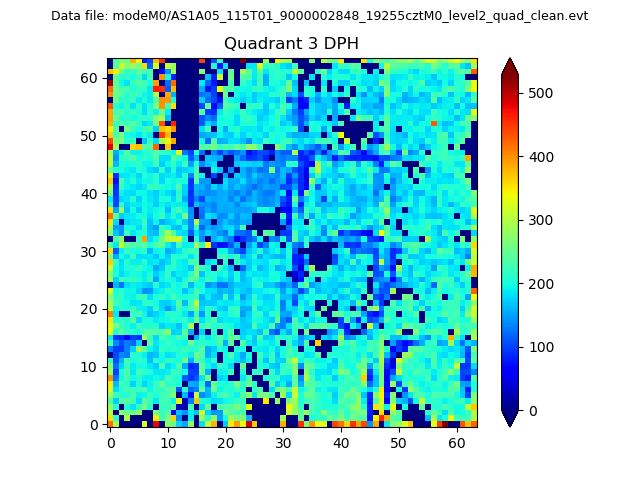 |
 |
Quadrant C |
| Plot type | Count rate plots | Images |
|---|---|---|
| Comparison with Poisson distribution Blue bars denote a histogram of data divided into 1 sec bins. Red curve is a Poisson curve with rate = median count rate of data. |
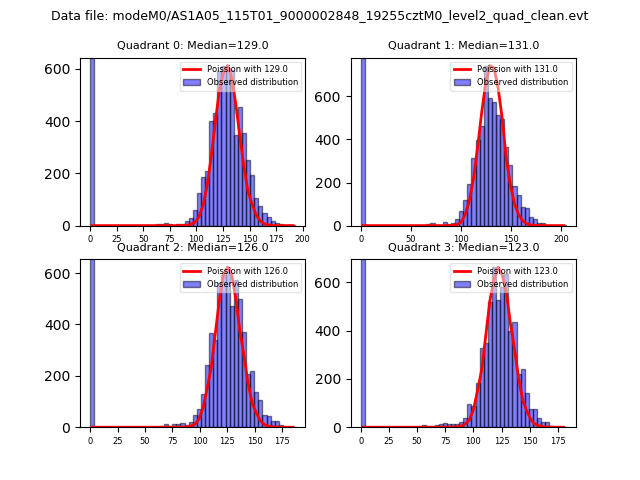 |
 |
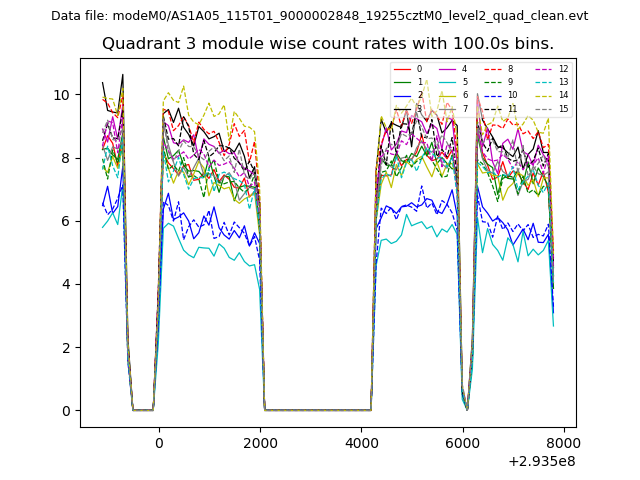
| Quadrant-wise count rates Data is divided into 100 sec bins |
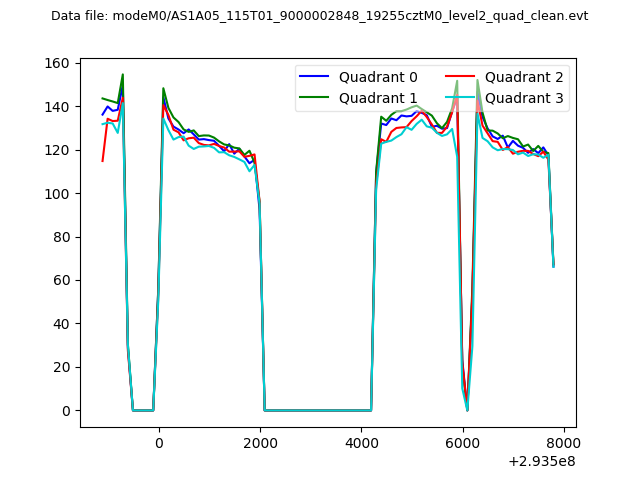 |
|
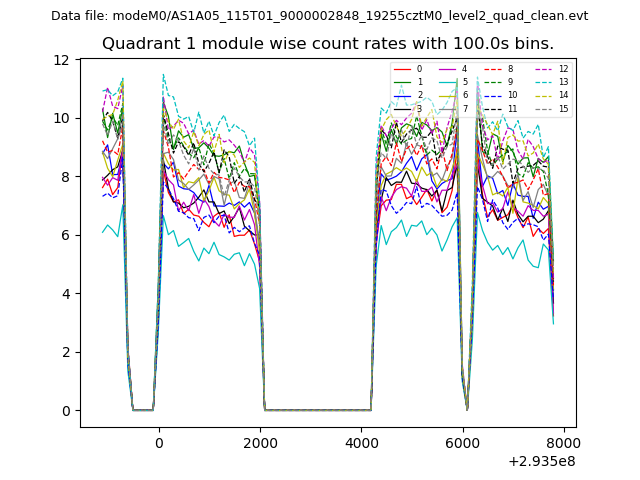
| Module-wise count rates for Quadrant A Data is divided into 100 sec bins |
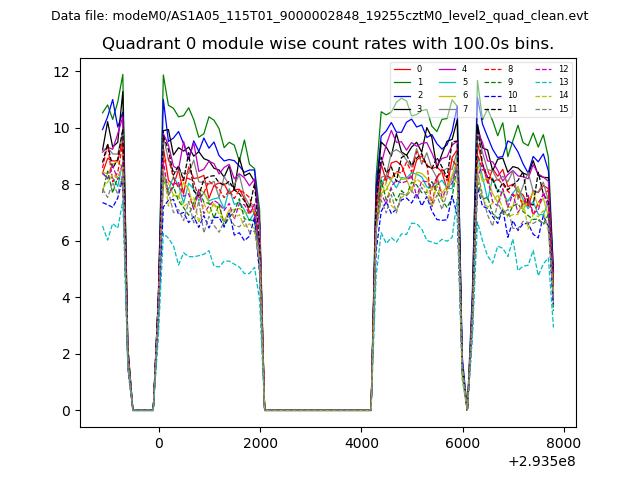 |
 |
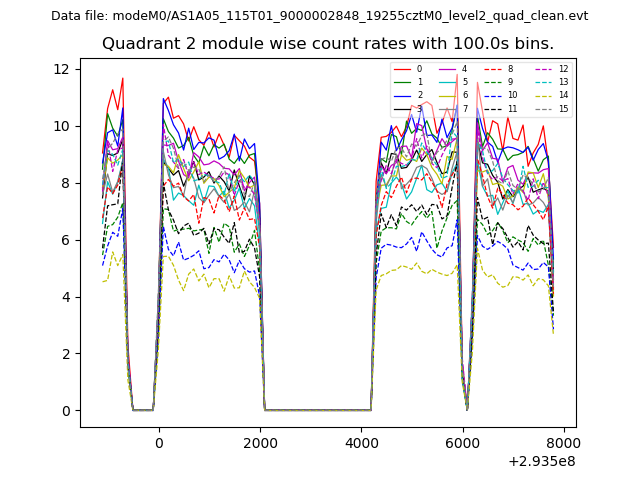
| Module-wise count rates for Quadrant B Data is divided into 100 sec bins |
 |
 |
| Module-wise count rates for Quadrant C Data is divided into 100 sec bins |
 |
 |
| Module-wise count rates for Quadrant D Data is divided into 100 sec bins |
 |
 |
| Parameter | Plot |
|---|---|
| CZT HV Monitor | 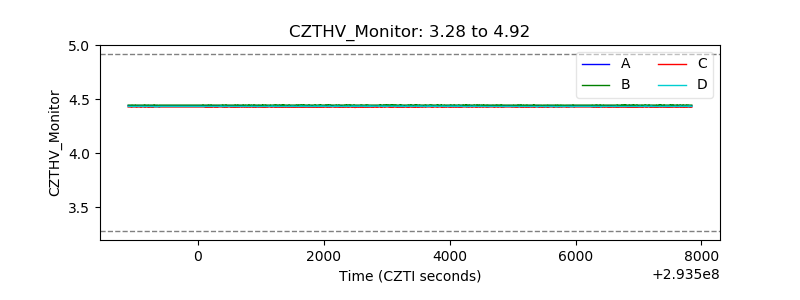 |
| D_VDD | 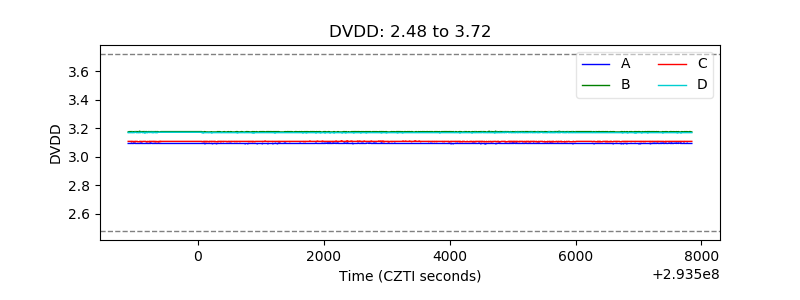 |
| Temperature 1 | 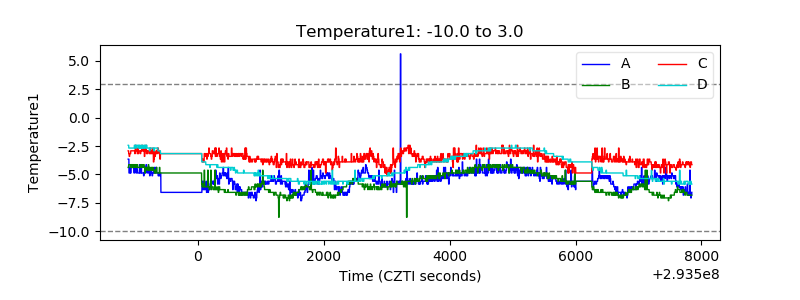 |
| Veto HV Monitor | 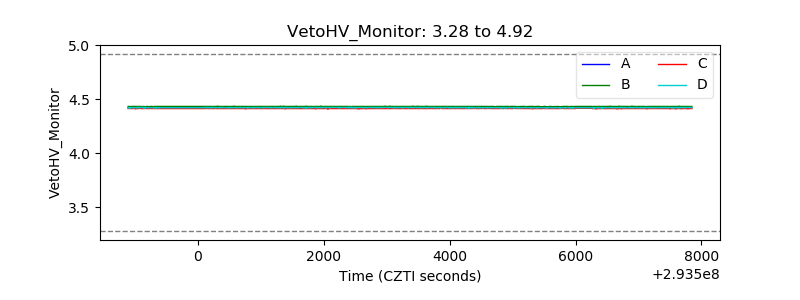 |
| Veto LLD | 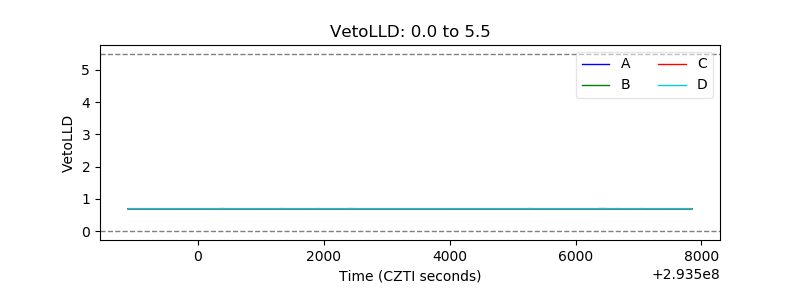 |
| Alpha Counter | 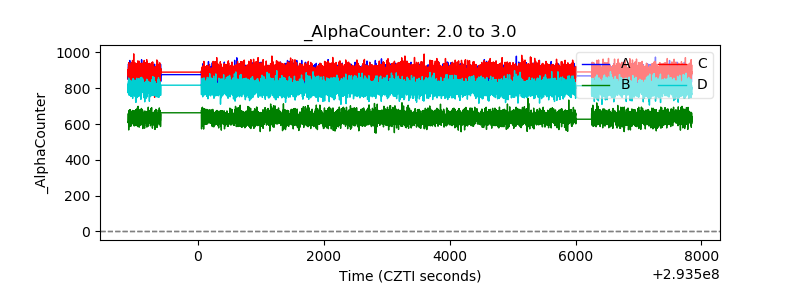 |
| _CPM_Rate | 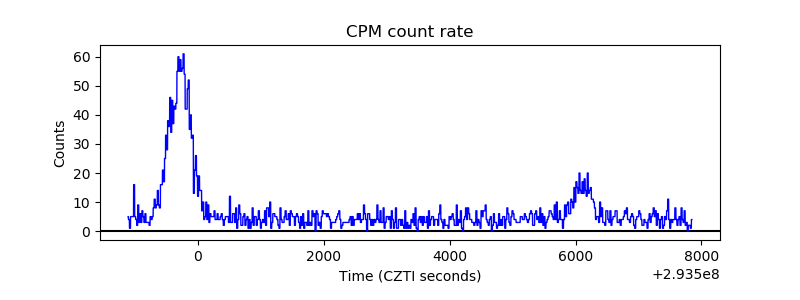 |
| CZT Counter | 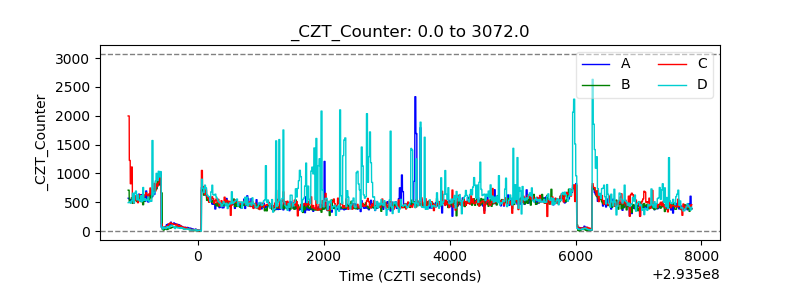 |
| +2.5 Volts monitor | 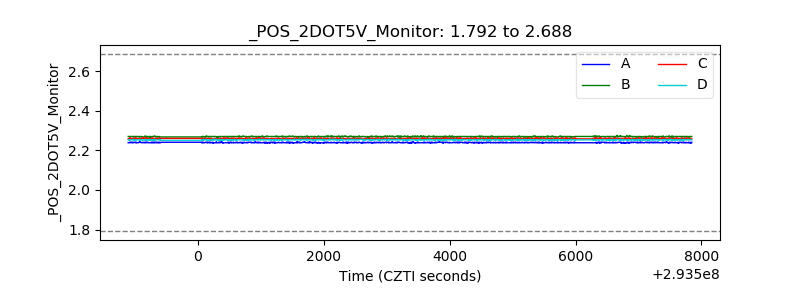 |
| +5 Volts monitor |  |
| _ROLL_ROT | 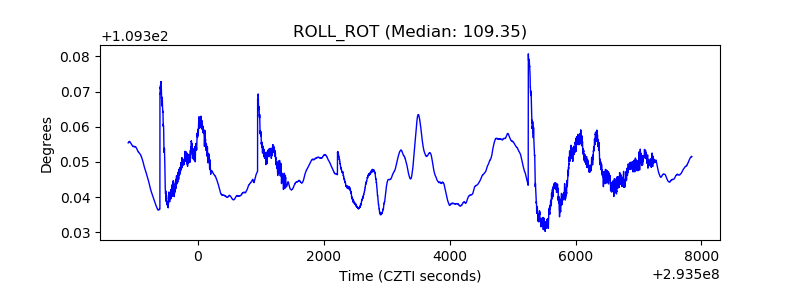 |
| _Roll_DEC | 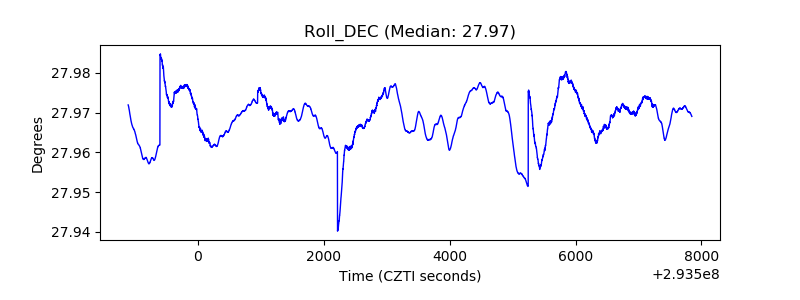 |
| _Roll_RA | 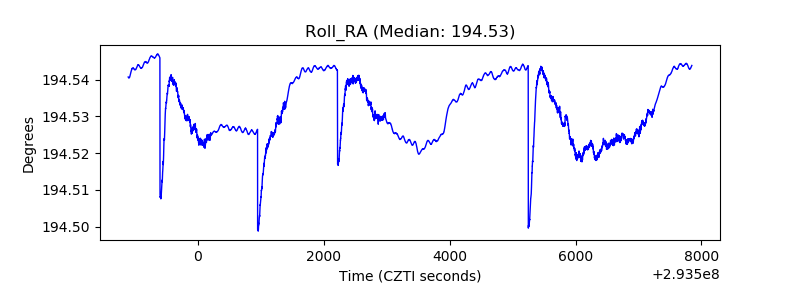 |
| Veto Counter | 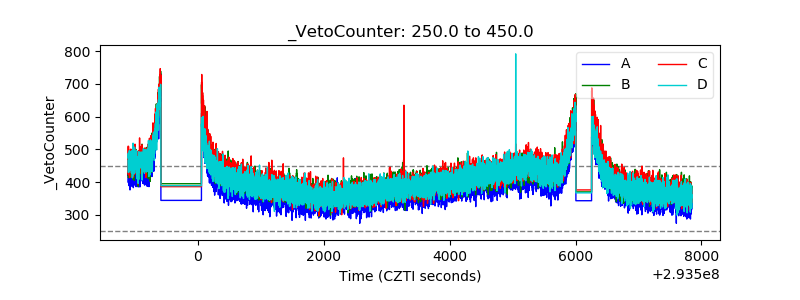 |