| Param | Original file | Final file |
|---|---|---|
| Filename | modeM0/AS1A05_115T01_9000002848_19256cztM0_level2.evt | modeM0/AS1A05_115T01_9000002848_19256cztM0_level2_quad_clean.evt |
| Size (bytes) | 527,688,000 | 102,775,680 |
| Size | 503.2 MB | 98.0 MB |
| Events in quadrant A | 3,620,404 | 649,283 |
| Events in quadrant B | 3,679,836 | 659,616 |
| Events in quadrant C | 3,771,195 | 640,124 |
| Events in quadrant D | 4,384,859 | 625,946 |
| Mode SS | |||
|---|---|---|---|
| Quadrant | BADHDUFLAG | Total packets | Discarded packets |
| A | 0 | 158 | 0 |
| B | 0 | 158 | 0 |
| C | 0 | 158 | 0 |
| D | 0 | 158 | 0 |
| Mode M9 | |||
|---|---|---|---|
| Quadrant | BADHDUFLAG | Total packets | Discarded packets |
| A | 0 | 1 | 0 |
| B | 0 | 2 | 0 |
| C | 0 | 2 | 0 |
| D | 0 | 2 | 0 |
| Mode M0 | |||
|---|---|---|---|
| Quadrant | BADHDUFLAG | Total packets | Discarded packets |
| A | 0 | 15917 | 3 |
| B | 0 | 16065 | 4 |
| C | 0 | 16138 | 3 |
| D | 0 | 18259 | 3 |
| Quadrant | Total seconds | Saturated seconds | Saturation percentage |
|---|---|---|---|
| A | 7723 | 108 | 1.398420% |
| B | 7722 | 160 | 2.072002% |
| C | 7722 | 139 | 1.800052% |
| D | 7722 | 117 | 1.515152% |
Noise dominated data is calculated using 1-second bins in cleaned event files. If a bin has >2000 counts, and if more than 50% of those come from <1% of pixels, then it is considered to be noise-dominated and hence unusable.
| Quadrant | # 1 sec bins | Bins with >0 counts | Bins with >2000 counts | High rate bins dominated by noise | Noise dominated (total time) | Noise dominated (detector-on time) | Marked lightcurve |
|---|---|---|---|---|---|---|---|
| A | 7883 | 7726 | 1 | 1 | 0.01% | 0.01% | 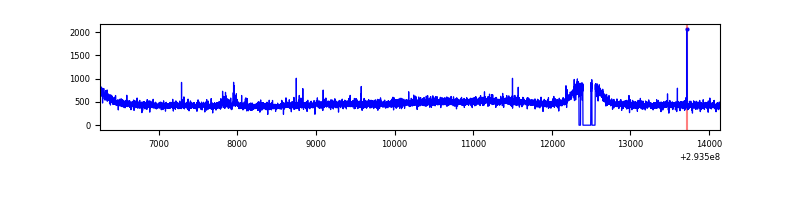 |
| B | 7882 | 7725 | 16 | 16 | 0.20% | 0.21% | 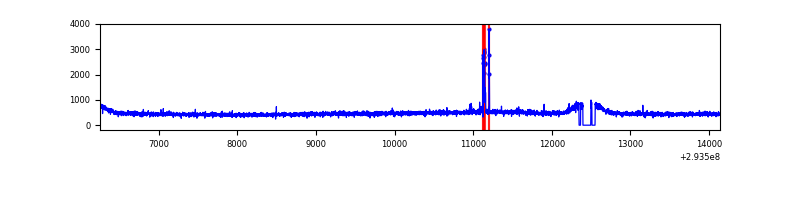 |
| C | 7882 | 7724 | 0 | 0 | 0.00% | 0.00% | 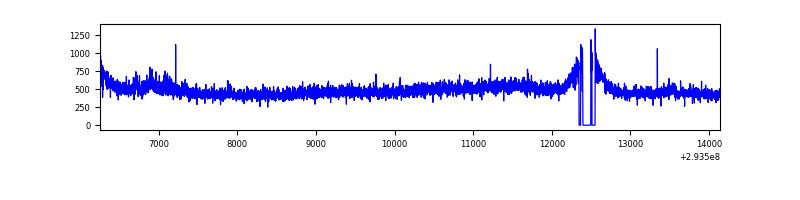 |
| D | 7882 | 7725 | 30 | 30 | 0.38% | 0.39% | 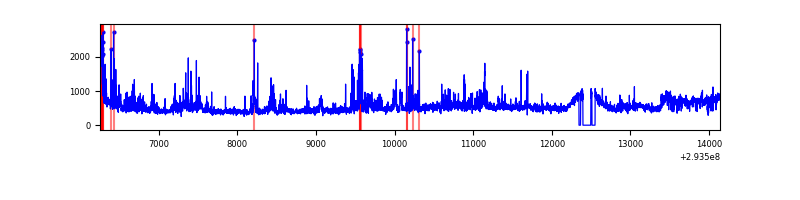 |
Top three noisy pixels from each quadrant. If the there are fewer than three noisy pixels in the level2.evt file, extra rows are filled as -1
| Pixel properties | Quadrant properties | ||||||
|---|---|---|---|---|---|---|---|
| Quadrant | DetID | PixID | Counts | Sigma | Mean | Median | Sigma |
| A | 8 | 205 | 21785 | 110.18 | 929 | 907 | 189.5 |
| A | 9 | 143 | 10586 | 51.08 | 929 | 907 | 189.5 |
| A | 13 | 254 | 9509 | 45.4 | 929 | 907 | 189.5 |
| B | 3 | 64 | 63933 | 352.43 | 921 | 896 | 178.9 |
| B | 12 | 111 | 22191 | 119.06 | 921 | 896 | 178.9 |
| B | 11 | 111 | 19997 | 106.79 | 921 | 896 | 178.9 |
| C | 14 | 238 | 138416 | 653.25 | 896 | 903 | 210.5 |
| C | 3 | 233 | 131533 | 620.56 | 896 | 903 | 210.5 |
| C | 13 | 61 | 6093 | 24.66 | 896 | 903 | 210.5 |
| D | 1 | 52 | 936122 | 4260.88 | 901 | 874 | 219.5 |
| D | 13 | 104 | 36095 | 160.46 | 901 | 874 | 219.5 |
| D | 2 | 234 | 29600 | 130.87 | 901 | 874 | 219.5 |
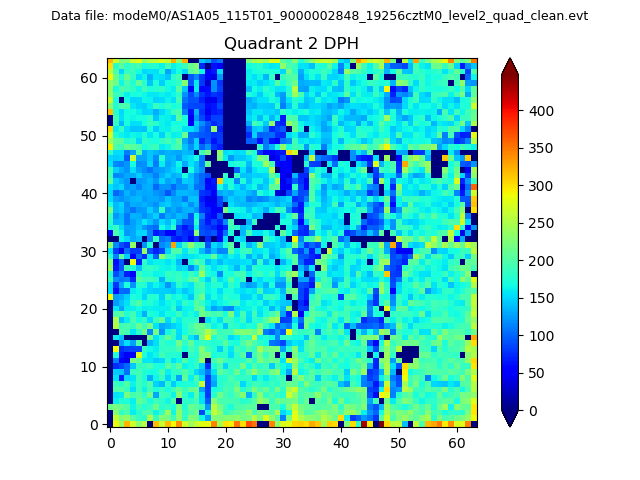
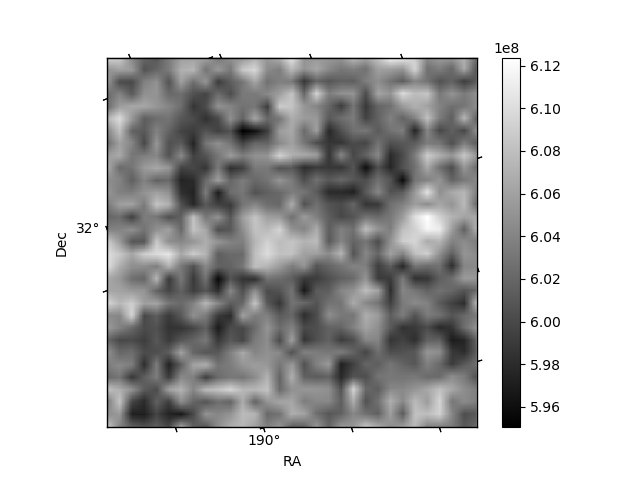
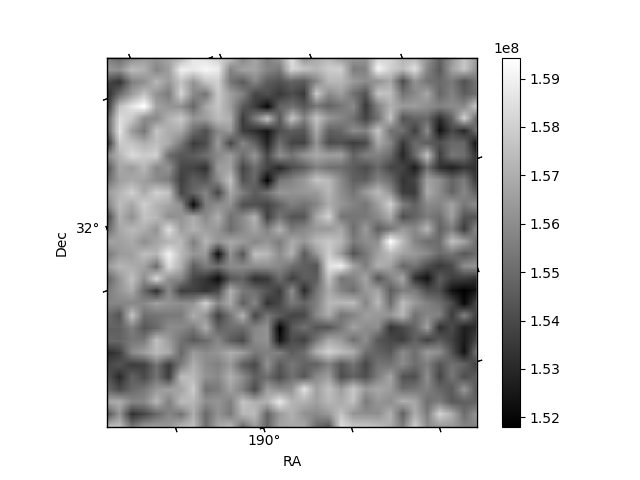
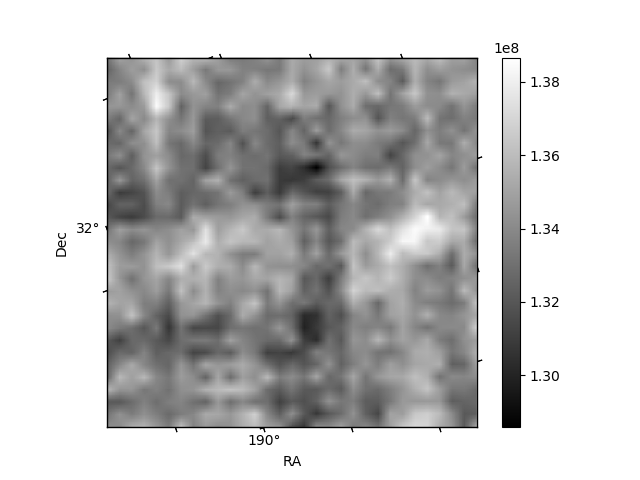
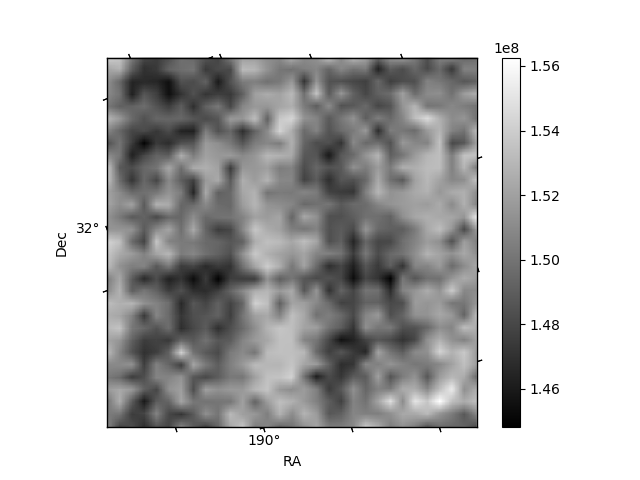
Histogram calculated using DETX and DETY for each event in the final _common_clean file
| Quadrant A | 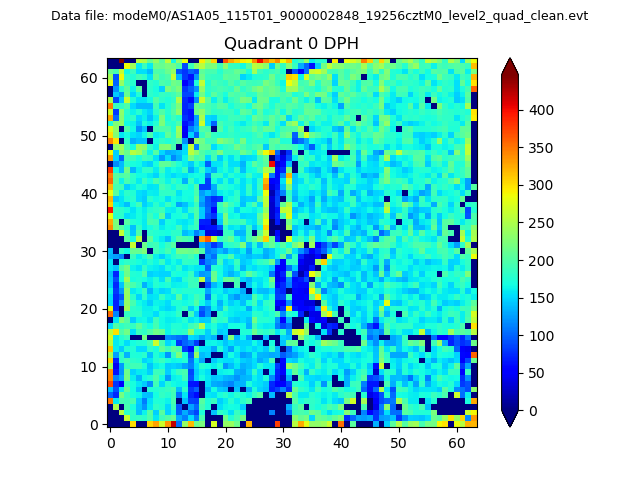 |
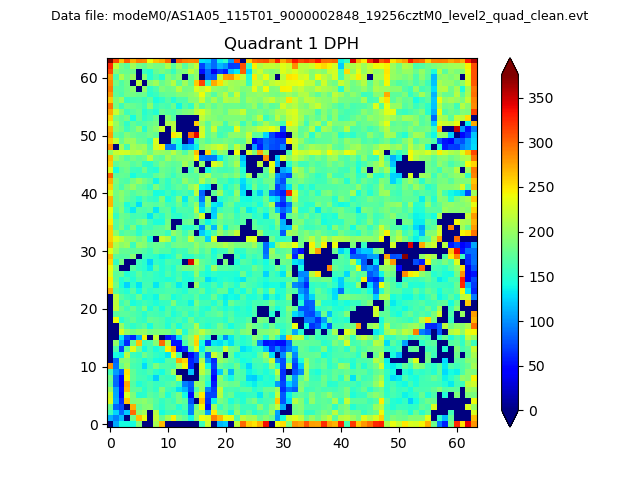 |
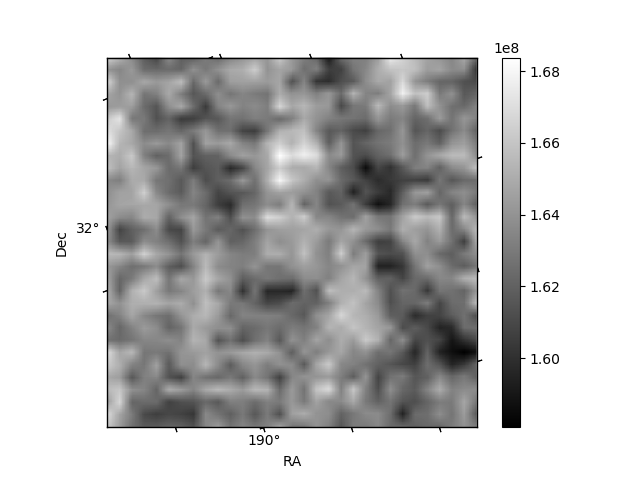
Quadrant B |
|---|---|---|---|
| Quadrant D | 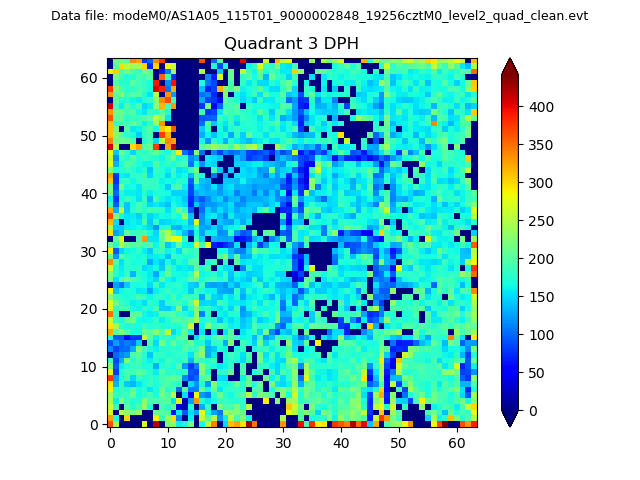 |
 |
Quadrant C |
| Plot type | Count rate plots | Images |
|---|---|---|
| Comparison with Poisson distribution Blue bars denote a histogram of data divided into 1 sec bins. Red curve is a Poisson curve with rate = median count rate of data. |
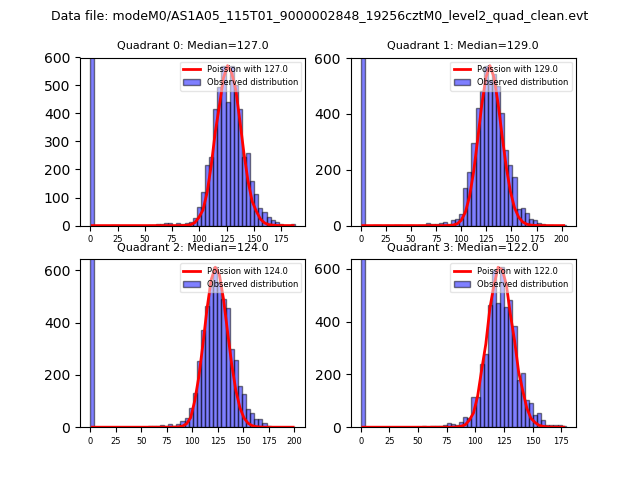 |
 |
| Quadrant-wise count rates Data is divided into 100 sec bins |
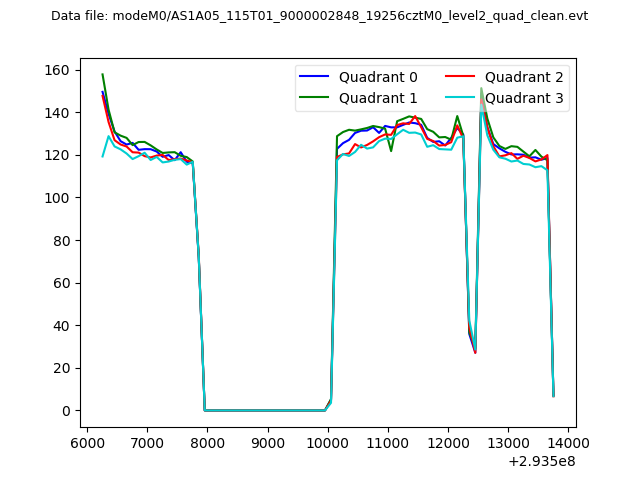 |
|
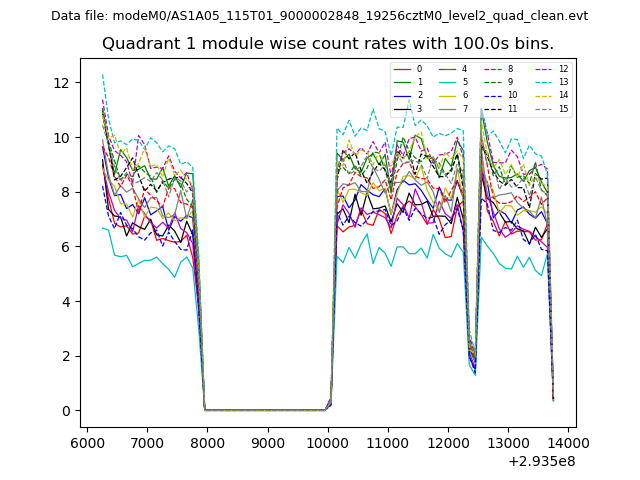
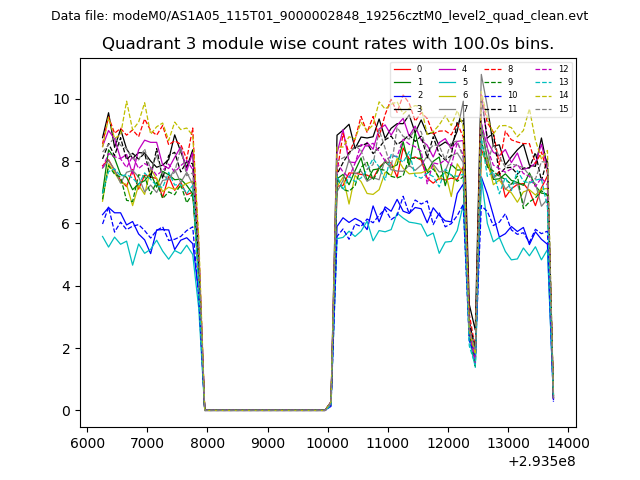
| Module-wise count rates for Quadrant A Data is divided into 100 sec bins |
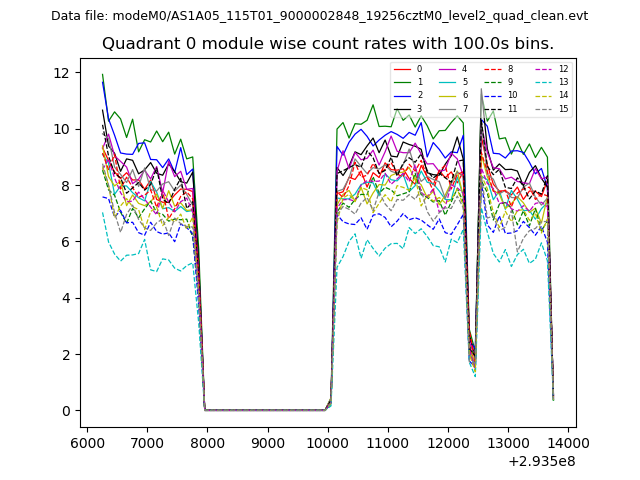 |
 |
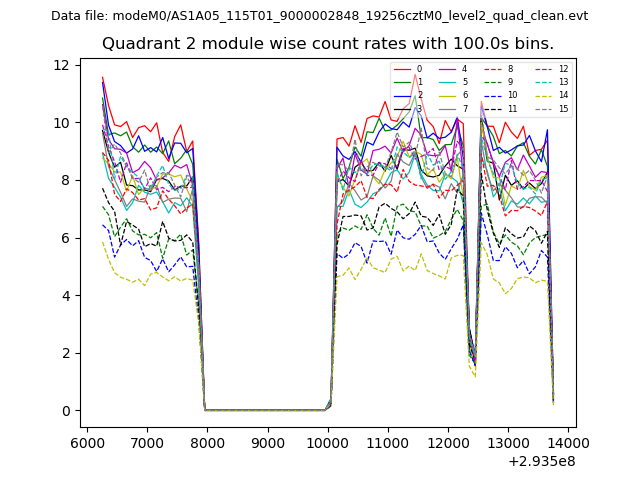
| Module-wise count rates for Quadrant B Data is divided into 100 sec bins |
 |
 |
| Module-wise count rates for Quadrant C Data is divided into 100 sec bins |
 |
 |
| Module-wise count rates for Quadrant D Data is divided into 100 sec bins |
 |
 |
| Parameter | Plot |
|---|---|
| CZT HV Monitor | 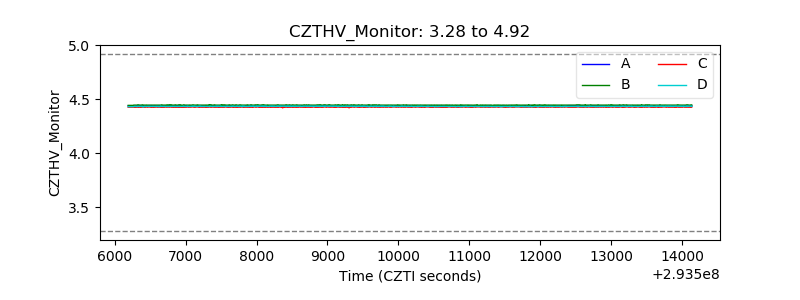 |
| D_VDD | 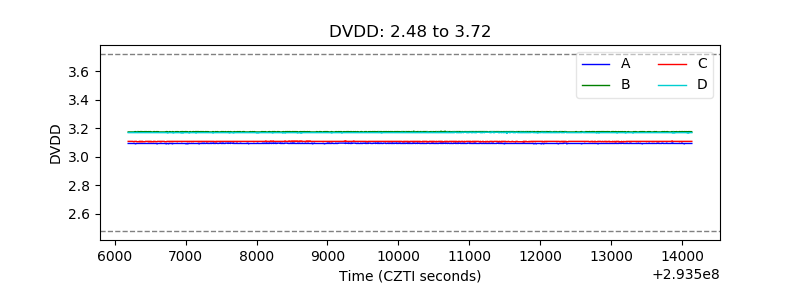 |
| Temperature 1 | 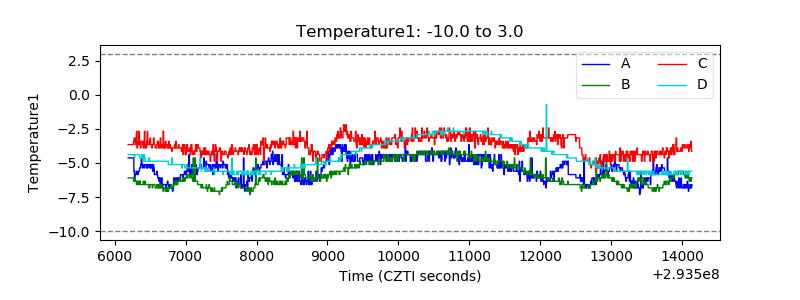 |
| Veto HV Monitor | 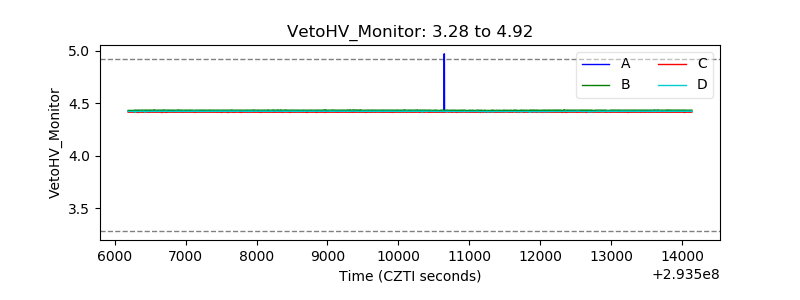 |
| Veto LLD |  |
| Alpha Counter | 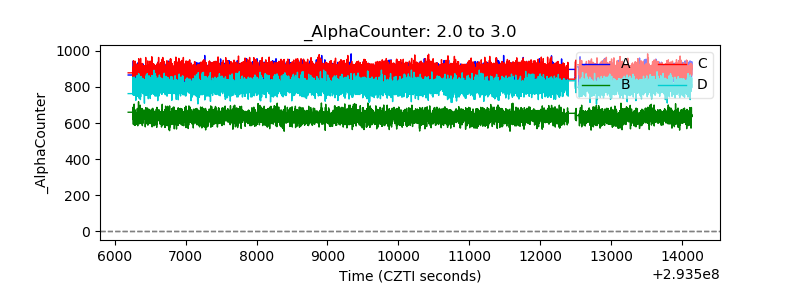 |
| _CPM_Rate | 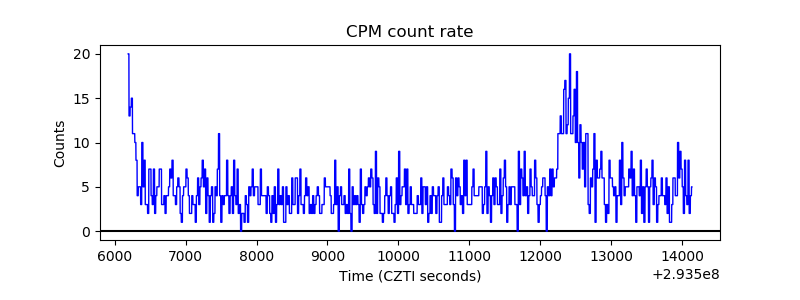 |
| CZT Counter | 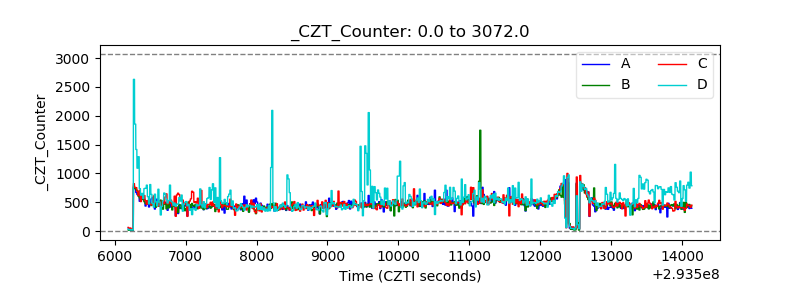 |
| +2.5 Volts monitor |  |
| +5 Volts monitor |  |
| _ROLL_ROT | 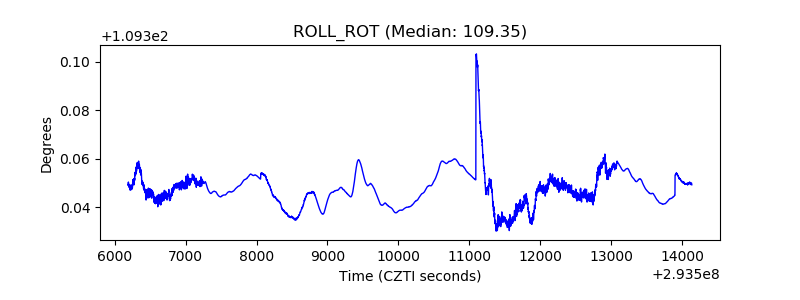 |
| _Roll_DEC | 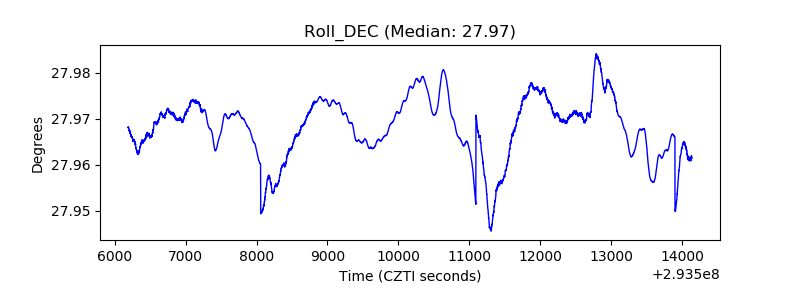 |
| _Roll_RA | 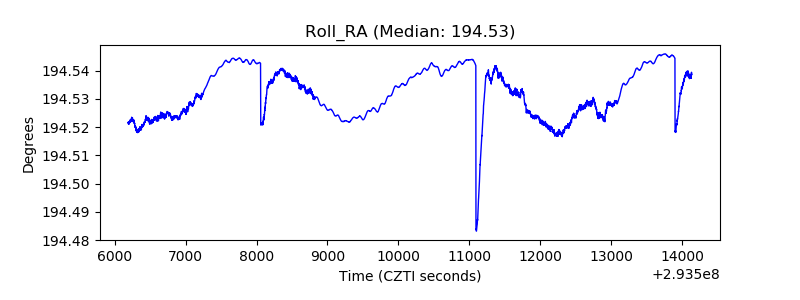 |
| Veto Counter | 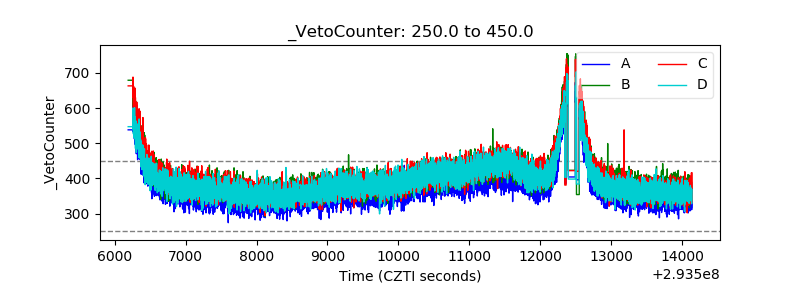 |