| Param | Original file | Final file |
|---|---|---|
| Filename | modeM0/AS1A05_088T02_9000002850cztM0_level2.fits | modeM0/AS1A05_088T02_9000002850cztM0_level2_quad_clean.evt |
| Size (bytes) | 340,827,840 | 214,058,880 |
| Size | 325.0 MB | 204.1 MB |
| Events in quadrant A | 2,132,068 | 1,104,673 |
| Events in quadrant B | 2,053,830 | 1,122,631 |
| Events in quadrant C | 2,121,212 | 1,095,763 |
| Events in quadrant D | 1,870,174 | 1,012,116 |
| Mode M0 | |||
|---|---|---|---|
| Quadrant | BADHDUFLAG | Total packets | Discarded packets |
| A | 0 | 68093 | 0 |
| B | 0 | 68267 | 0 |
| C | 0 | 70703 | 0 |
| D | 0 | 69805 | 0 |
| Mode SS | |||
|---|---|---|---|
| Quadrant | BADHDUFLAG | Total packets | Discarded packets |
| A | 0 | 638 | 0 |
| B | 0 | 638 | 0 |
| C | 0 | 638 | 0 |
| D | 0 | 638 | 0 |
| Mode M9 | |||
|---|---|---|---|
| Quadrant | BADHDUFLAG | Total packets | Discarded packets |
| A | 0 | 85 | 0 |
| B | 0 | 85 | 0 |
| C | 0 | 85 | 0 |
| D | 0 | 85 | 0 |
| Quadrant | Total seconds | Saturated seconds | Saturation percentage |
|---|---|---|---|
| A | 31217 | 427 | 1.367844% |
| B | 31217 | 508 | 1.627318% |
| C | 31217 | 837 | 2.681231% |
| D | 31217 | 476 | 1.524810% |
Noise dominated data is calculated using 1-second bins in cleaned event files. If a bin has >2000 counts, and if more than 50% of those come from <1% of pixels, then it is considered to be noise-dominated and hence unusable.
| Quadrant | # 1 sec bins | Bins with >0 counts | Bins with >2000 counts | High rate bins dominated by noise | Noise dominated (total time) | Noise dominated (detector-on time) | Marked lightcurve |
|---|---|---|---|---|---|---|---|
| A | 39632 | 31212 | 0 | 0 | 0.00% | 0.00% | 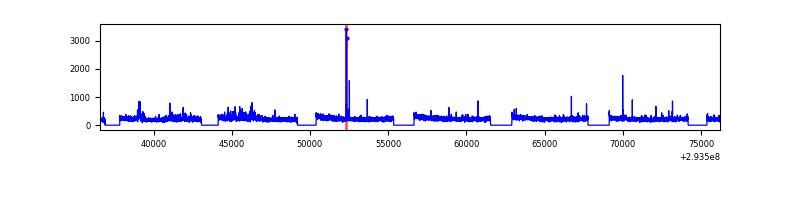 |
| B | 39632 | 31212 | 0 | 0 | 0.00% | 0.00% | 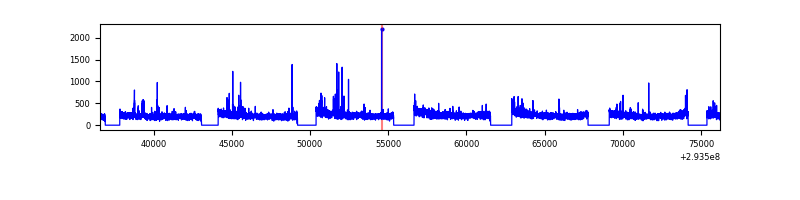 |
| C | 39632 | 31211 | 0 | 0 | 0.00% | 0.00% |  |
| D | 39632 | 31212 | 0 | 0 | 0.00% | 0.00% | 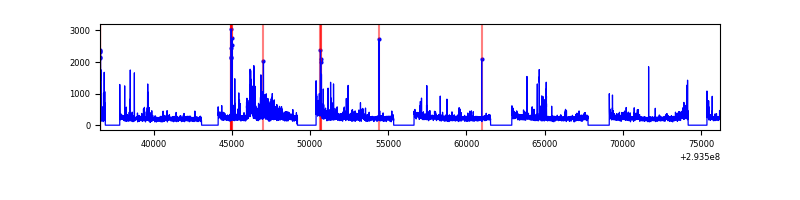 |
Top three noisy pixels from each quadrant. If the there are fewer than three noisy pixels in the level2.evt file, extra rows are filled as -1
| Pixel properties | Quadrant properties | ||||||
|---|---|---|---|---|---|---|---|
| Quadrant | DetID | PixID | Counts | Sigma | Mean | Median | Sigma |
| A | 0 | 29 | 2072 | 11.45 | 555 | 523 | 135.2 |
| A | 7 | 110 | 1695 | 8.67 | 555 | 523 | 135.2 |
| A | 0 | 30 | 1548 | 7.58 | 555 | 523 | 135.2 |
| B | 2 | 9 | 1667 | 10.77 | 542 | 519 | 106.6 |
| B | 3 | 17 | 1410 | 8.36 | 542 | 519 | 106.6 |
| B | 2 | 8 | 1384 | 8.11 | 542 | 519 | 106.6 |
| C | 1 | 80 | 1550 | 7.16 | 559 | 528 | 142.8 |
| C | 1 | 81 | 1484 | 6.69 | 559 | 528 | 142.8 |
| C | 9 | 209 | 1460 | 6.53 | 559 | 528 | 142.8 |
| D | 10 | 190 | 1411 | 6.67 | 533 | 489 | 138.2 |
| D | 7 | 3 | 1342 | 6.17 | 533 | 489 | 138.2 |
| D | 10 | 189 | 1336 | 6.13 | 533 | 489 | 138.2 |
Histogram calculated using DETX and DETY for each event in the final _common_clean file
| Quadrant A |  |
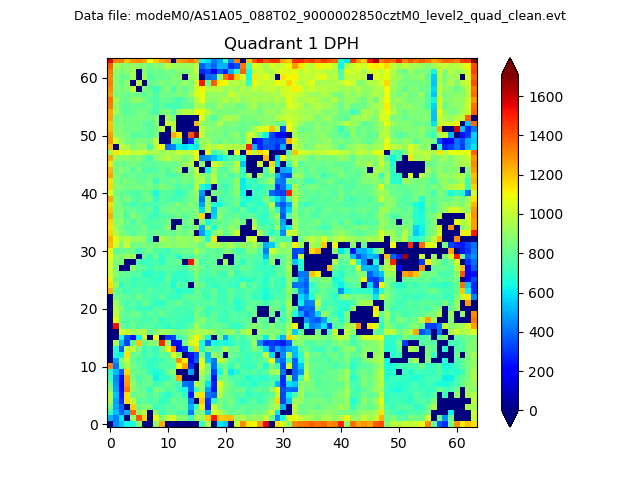 |
Quadrant B |
|---|---|---|---|
| Quadrant D | 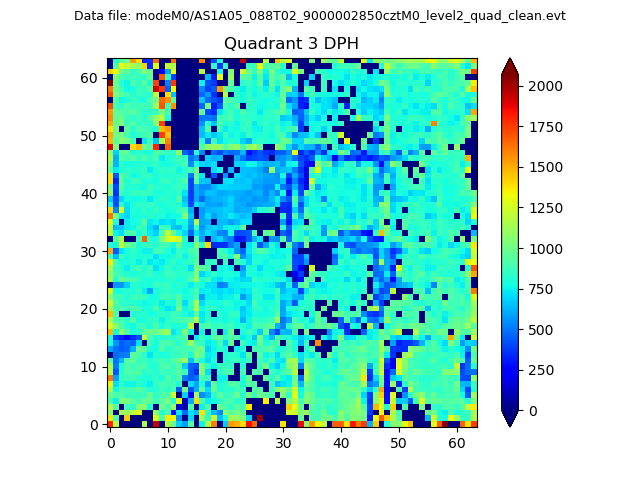 |
 |
Quadrant C |
| Plot type | Count rate plots | Images |
|---|---|---|
| Comparison with Poisson distribution Blue bars denote a histogram of data divided into 1 sec bins. Red curve is a Poisson curve with rate = median count rate of data. |
 |
 |
| Quadrant-wise count rates Data is divided into 100 sec bins |
 |
|
| Module-wise count rates for Quadrant A Data is divided into 100 sec bins |
 |
 |
| Module-wise count rates for Quadrant B Data is divided into 100 sec bins |
 |
 |
| Module-wise count rates for Quadrant C Data is divided into 100 sec bins |
 |
 |
| Module-wise count rates for Quadrant D Data is divided into 100 sec bins |
 |
 |
| Parameter | Plot |
|---|---|
| CZT HV Monitor |  |
| D_VDD | 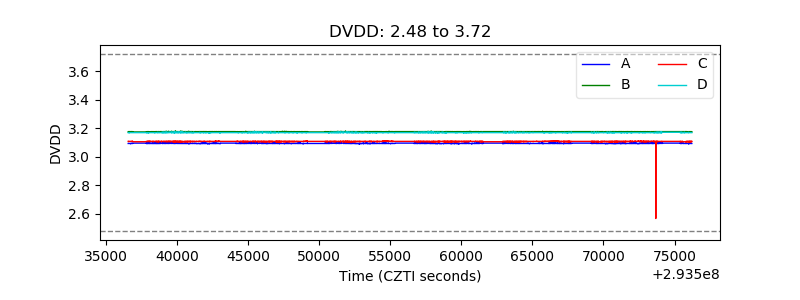 |
| Temperature 1 |  |
| Veto HV Monitor |  |
| Veto LLD | 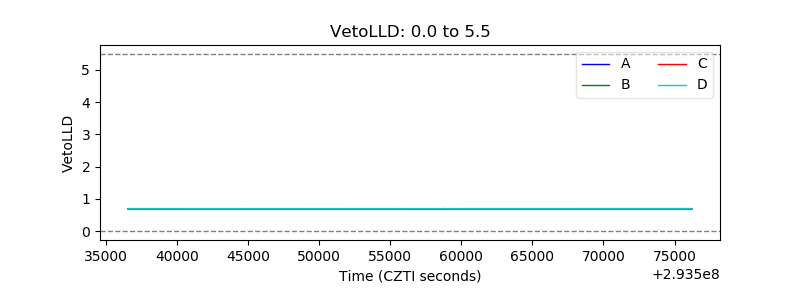 |
| Alpha Counter |  |
| _CPM_Rate |  |
| CZT Counter |  |
| +2.5 Volts monitor |  |
| +5 Volts monitor |  |
| _ROLL_ROT | 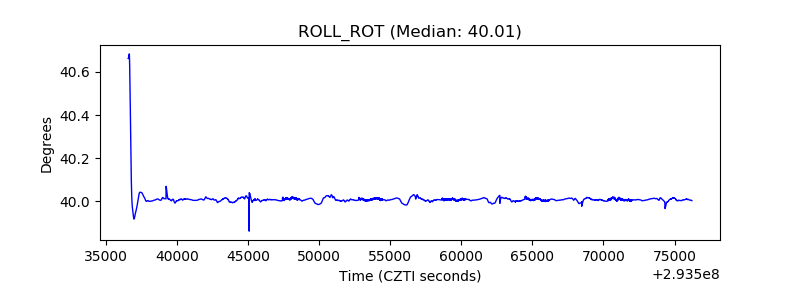 |
| _Roll_DEC |  |
| _Roll_RA |  |
| Veto Counter |  |