| Param | Original file | Final file |
|---|---|---|
| Filename | modeM0/AS1A05_088T02_9000002850_19263cztM0_level2.evt | modeM0/AS1A05_088T02_9000002850_19263cztM0_level2_quad_clean.evt |
| Size (bytes) | 486,745,920 | 70,038,720 |
| Size | 464.2 MB | 66.8 MB |
| Events in quadrant A | 3,476,722 | 422,196 |
| Events in quadrant B | 3,427,452 | 429,640 |
| Events in quadrant C | 3,464,267 | 417,617 |
| Events in quadrant D | 3,941,853 | 408,234 |
| Mode M0 | |||
|---|---|---|---|
| Quadrant | BADHDUFLAG | Total packets | Discarded packets |
| A | 0 | 14581 | 2 |
| B | 0 | 14340 | 2 |
| C | 0 | 14286 | 2 |
| D | 0 | 15907 | 2 |
| Mode SS | |||
|---|---|---|---|
| Quadrant | BADHDUFLAG | Total packets | Discarded packets |
| A | 0 | 128 | 0 |
| B | 0 | 128 | 0 |
| C | 0 | 128 | 0 |
| D | 0 | 128 | 0 |
| Mode M9 | |||
|---|---|---|---|
| Quadrant | BADHDUFLAG | Total packets | Discarded packets |
| A | 0 | 21 | 0 |
| B | 0 | 22 | 0 |
| C | 0 | 22 | 0 |
| D | 0 | 22 | 0 |
| Quadrant | Total seconds | Saturated seconds | Saturation percentage |
|---|---|---|---|
| A | 6351 | 75 | 1.180916% |
| B | 6351 | 82 | 1.291135% |
| C | 6351 | 125 | 1.968194% |
| D | 6351 | 121 | 1.905212% |
Noise dominated data is calculated using 1-second bins in cleaned event files. If a bin has >2000 counts, and if more than 50% of those come from <1% of pixels, then it is considered to be noise-dominated and hence unusable.
| Quadrant | # 1 sec bins | Bins with >0 counts | Bins with >2000 counts | High rate bins dominated by noise | Noise dominated (total time) | Noise dominated (detector-on time) | Marked lightcurve |
|---|---|---|---|---|---|---|---|
| A | 7541 | 6351 | 0 | 0 | 0.00% | 0.00% | 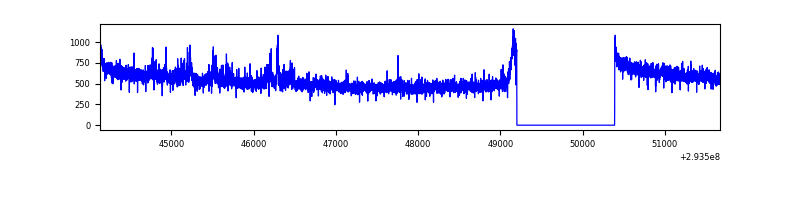 |
| B | 7541 | 6351 | 0 | 0 | 0.00% | 0.00% | 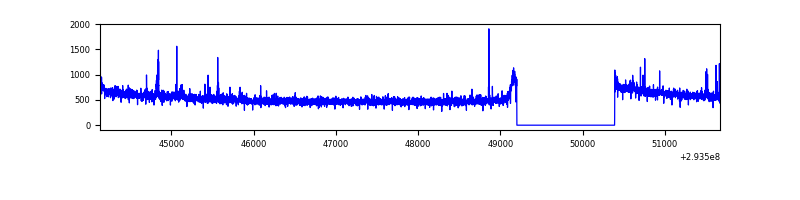 |
| C | 7541 | 6351 | 0 | 0 | 0.00% | 0.00% | 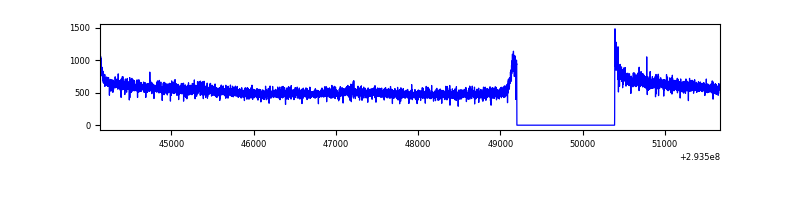 |
| D | 7541 | 6351 | 52 | 52 | 0.69% | 0.82% | 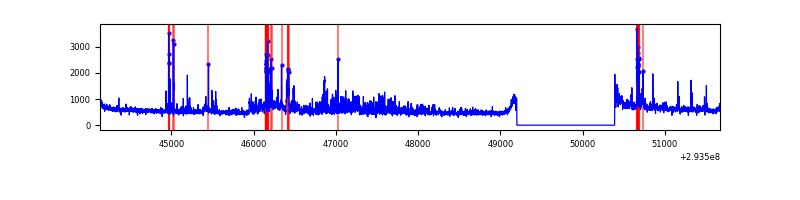 |
Top three noisy pixels from each quadrant. If the there are fewer than three noisy pixels in the level2.evt file, extra rows are filled as -1
| Pixel properties | Quadrant properties | ||||||
|---|---|---|---|---|---|---|---|
| Quadrant | DetID | PixID | Counts | Sigma | Mean | Median | Sigma |
| A | 8 | 205 | 120515 | 695.56 | 867 | 852 | 172.0 |
| A | 3 | 1 | 13487 | 73.44 | 867 | 852 | 172.0 |
| A | 0 | 226 | 7647 | 39.5 | 867 | 852 | 172.0 |
| B | 12 | 111 | 19204 | 113.3 | 861 | 840 | 162.1 |
| B | 0 | 230 | 17557 | 103.14 | 861 | 840 | 162.1 |
| B | 11 | 111 | 17120 | 100.44 | 861 | 840 | 162.1 |
| C | 14 | 238 | 131233 | 675.65 | 834 | 843 | 193.0 |
| C | 3 | 233 | 81901 | 420.02 | 834 | 843 | 193.0 |
| C | 13 | 61 | 5942 | 26.42 | 834 | 843 | 193.0 |
| D | 10 | 66 | 328588 | 1604.48 | 846 | 822 | 204.3 |
| D | 1 | 52 | 306849 | 1498.06 | 846 | 822 | 204.3 |
| D | 13 | 104 | 60677 | 293.0 | 846 | 822 | 204.3 |
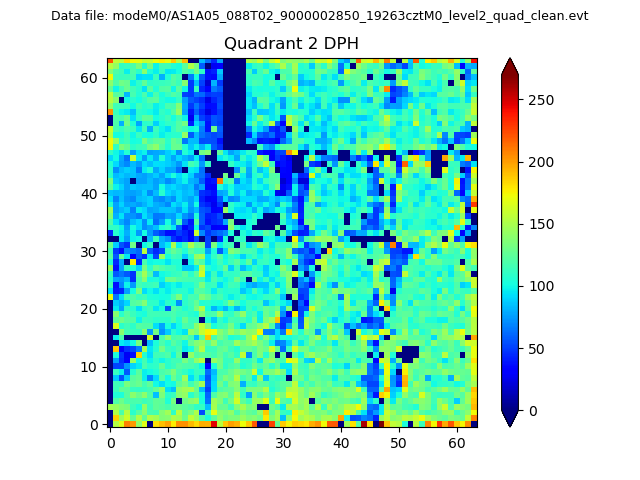
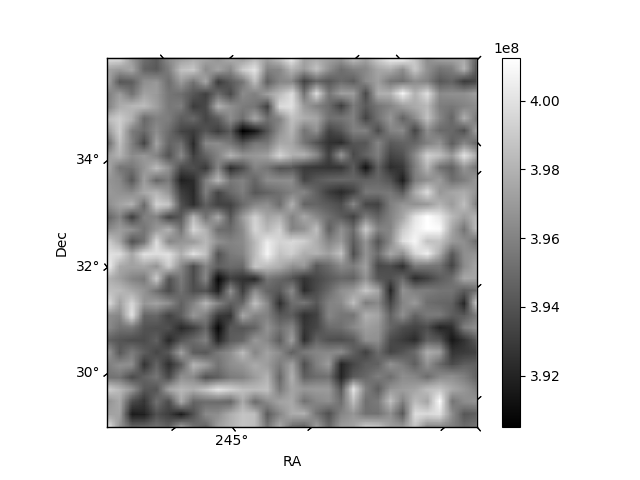
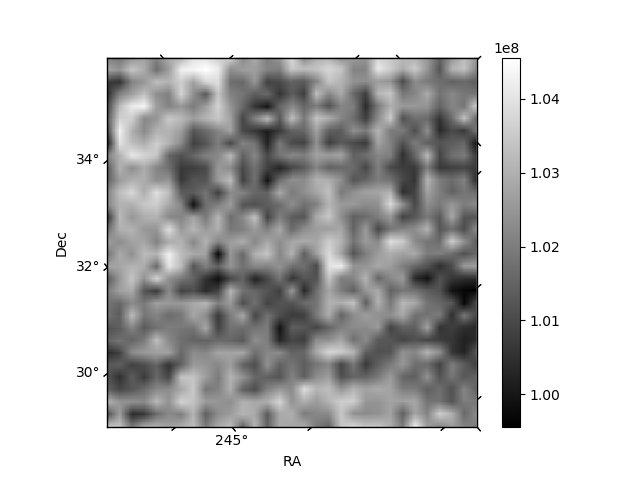
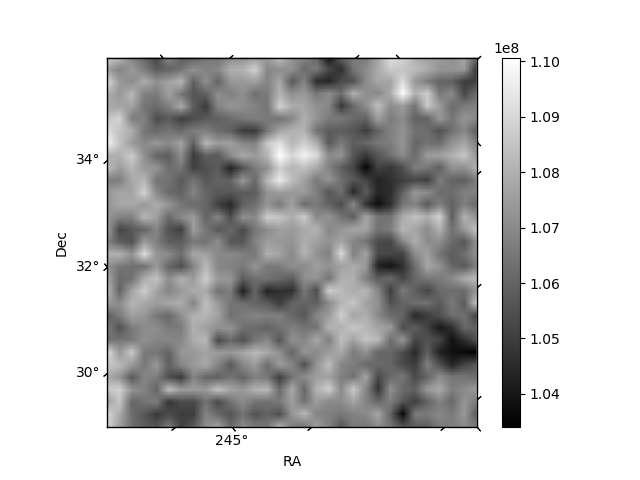
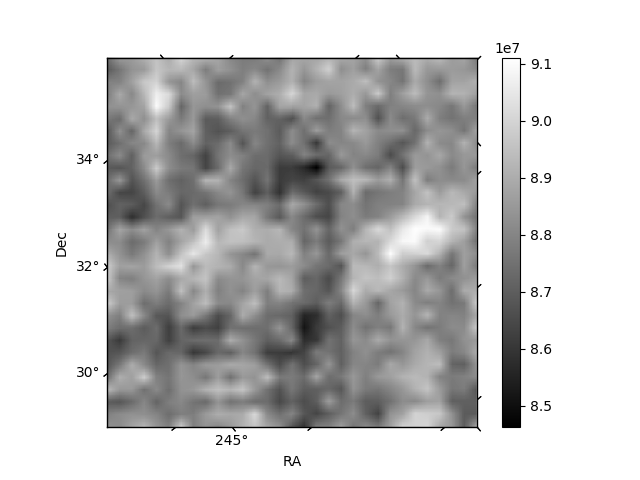
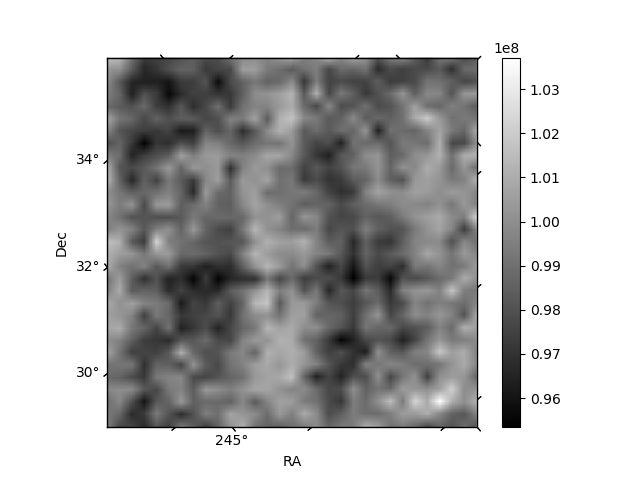
Histogram calculated using DETX and DETY for each event in the final _common_clean file
| Quadrant A | 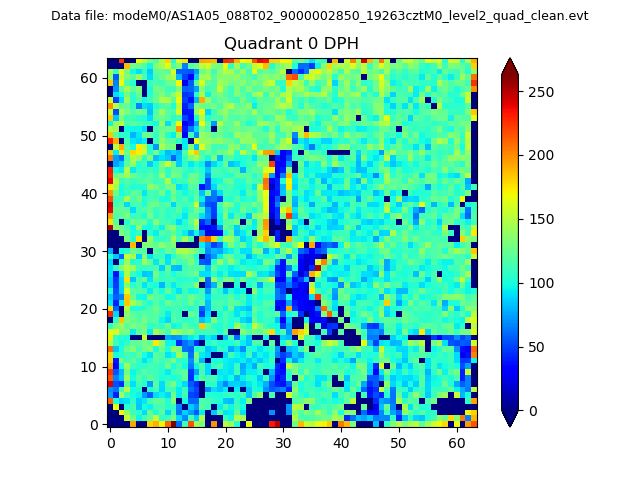 |
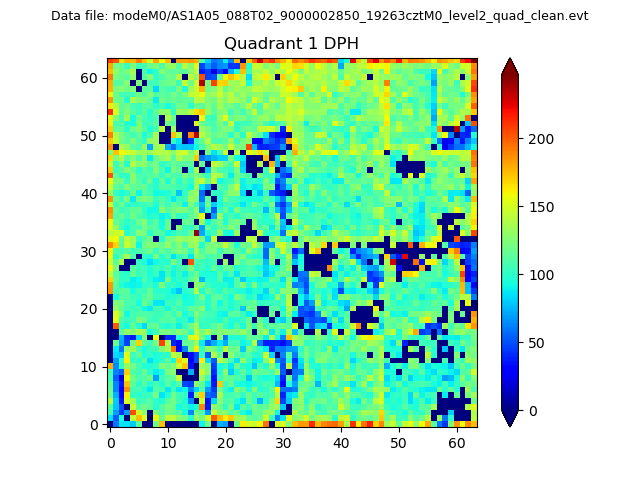 |
Quadrant B |
|---|---|---|---|
| Quadrant D | 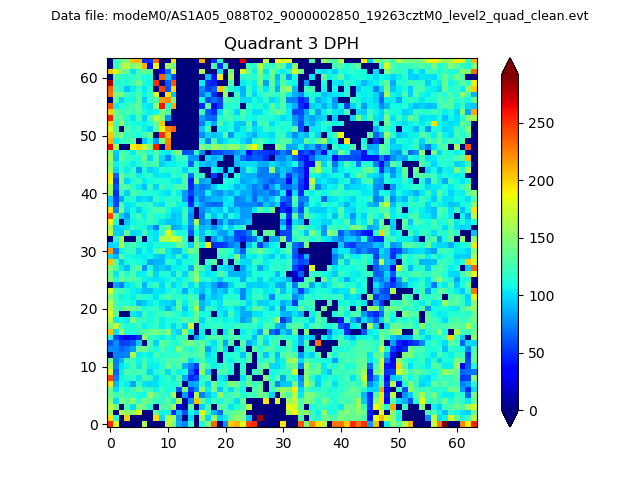 |
 |
Quadrant C |
| Plot type | Count rate plots | Images |
|---|---|---|
| Comparison with Poisson distribution Blue bars denote a histogram of data divided into 1 sec bins. Red curve is a Poisson curve with rate = median count rate of data. |
 |
 |
| Quadrant-wise count rates Data is divided into 100 sec bins |
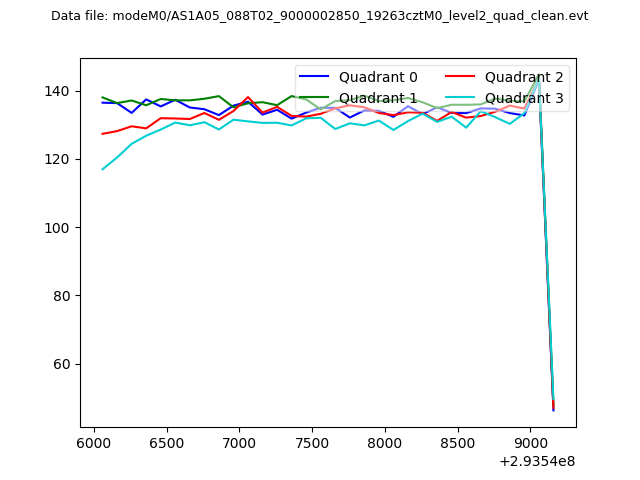 |
|
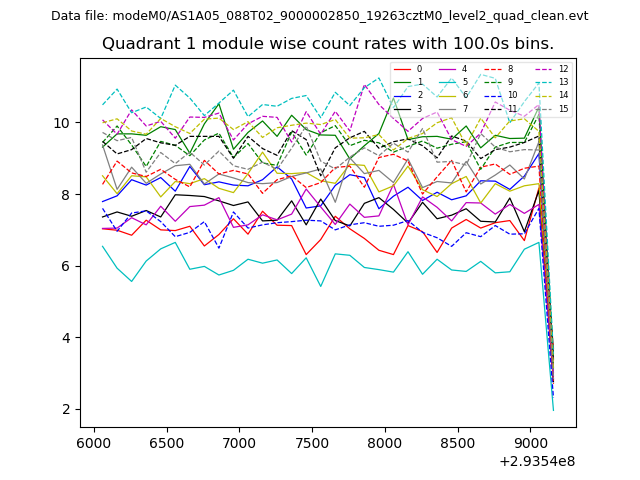
| Module-wise count rates for Quadrant A Data is divided into 100 sec bins |
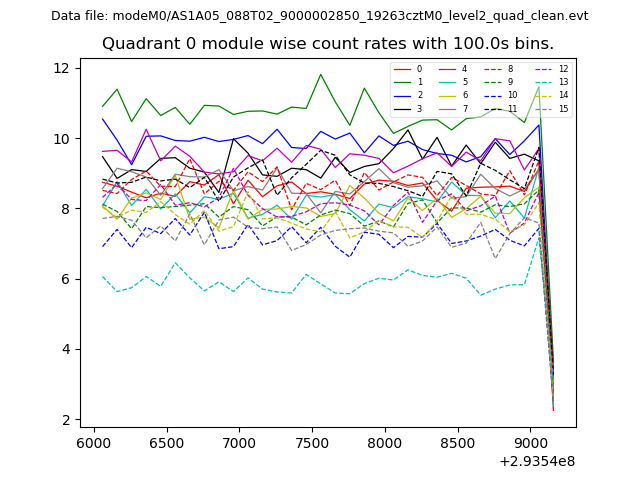 |
 |
| Module-wise count rates for Quadrant B Data is divided into 100 sec bins |
 |
 |
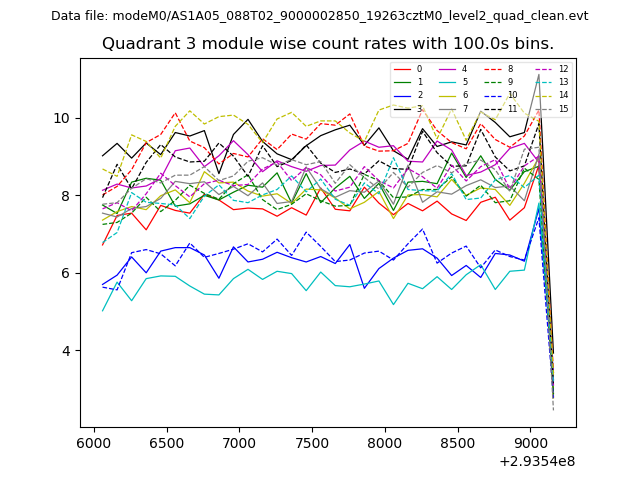
| Module-wise count rates for Quadrant C Data is divided into 100 sec bins |
 |
 |
| Module-wise count rates for Quadrant D Data is divided into 100 sec bins |
 |
 |
| Parameter | Plot |
|---|---|
| CZT HV Monitor |  |
| D_VDD | 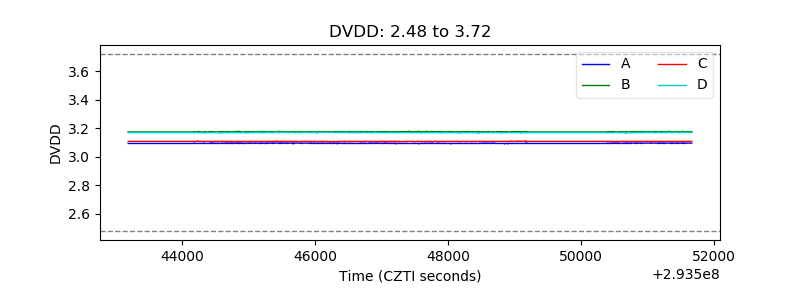 |
| Temperature 1 | 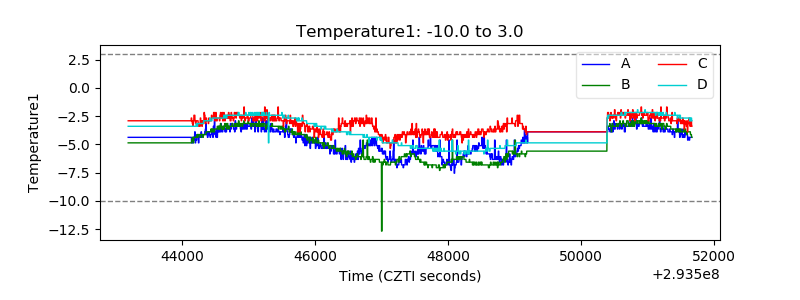 |
| Veto HV Monitor | 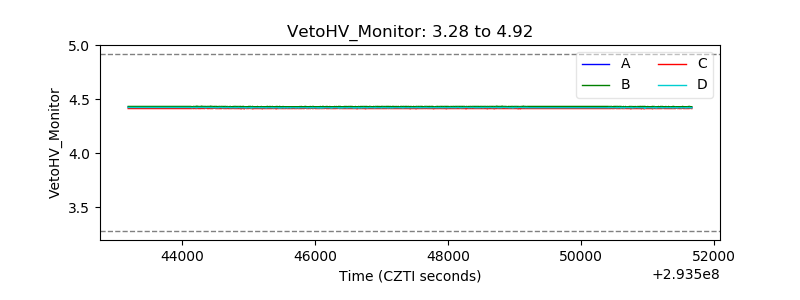 |
| Veto LLD | 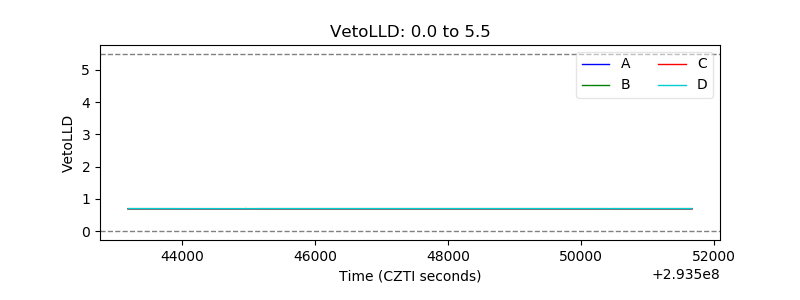 |
| Alpha Counter | 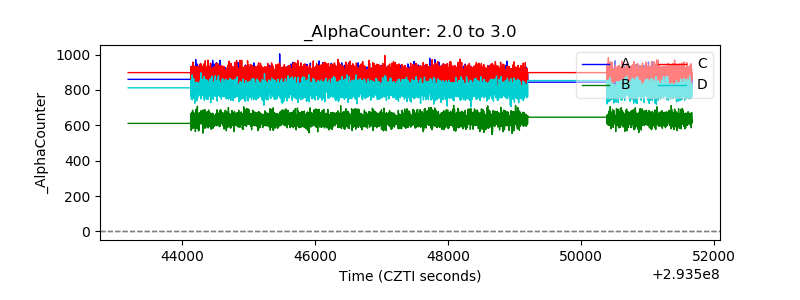 |
| _CPM_Rate | 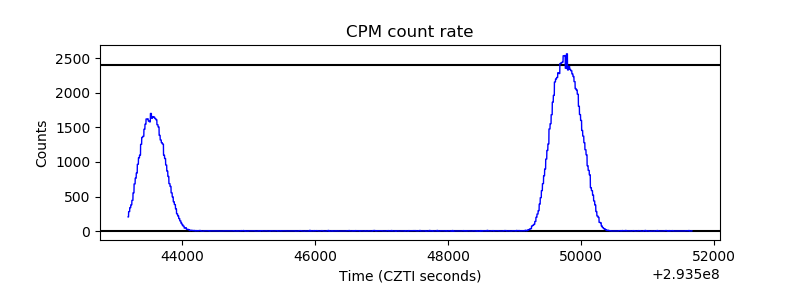 |
| CZT Counter | 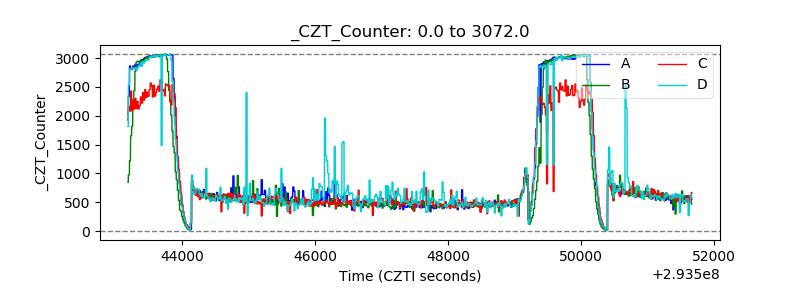 |
| +2.5 Volts monitor |  |
| +5 Volts monitor |  |
| _ROLL_ROT |  |
| _Roll_DEC | 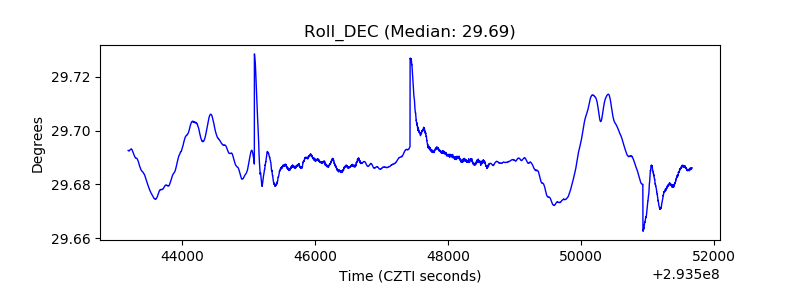 |
| _Roll_RA | 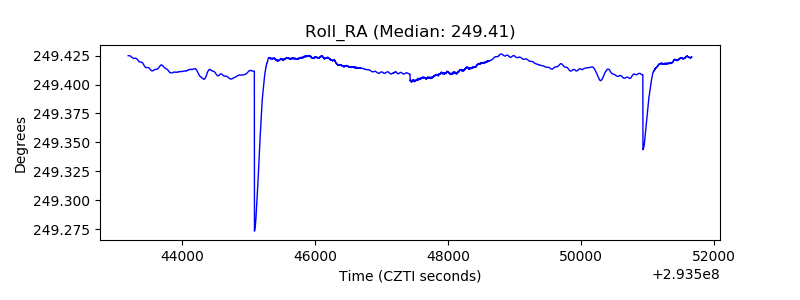 |
| Veto Counter | 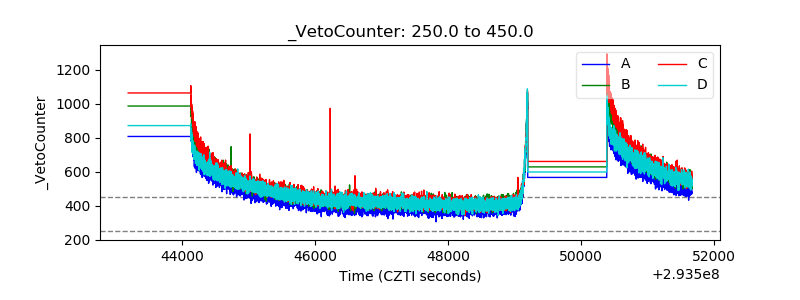 |