| Param | Original file | Final file |
|---|---|---|
| Filename | modeM0/AS1A05_088T02_9000002850_19264cztM0_level2.evt | modeM0/AS1A05_088T02_9000002850_19264cztM0_level2_quad_clean.evt |
| Size (bytes) | 480,297,600 | 82,284,480 |
| Size | 458.0 MB | 78.5 MB |
| Events in quadrant A | 3,431,389 | 514,927 |
| Events in quadrant B | 3,492,621 | 526,141 |
| Events in quadrant C | 3,664,030 | 513,501 |
| Events in quadrant D | 3,537,151 | 504,284 |
| Mode M0 | |||
|---|---|---|---|
| Quadrant | BADHDUFLAG | Total packets | Discarded packets |
| A | 0 | 14345 | 2 |
| B | 0 | 14497 | 2 |
| C | 0 | 14937 | 2 |
| D | 0 | 14632 | 2 |
| Mode SS | |||
|---|---|---|---|
| Quadrant | BADHDUFLAG | Total packets | Discarded packets |
| A | 0 | 126 | 0 |
| B | 0 | 126 | 0 |
| C | 0 | 126 | 0 |
| D | 0 | 126 | 0 |
| Mode M9 | |||
|---|---|---|---|
| Quadrant | BADHDUFLAG | Total packets | Discarded packets |
| A | 0 | 19 | 0 |
| B | 0 | 20 | 0 |
| C | 0 | 20 | 0 |
| D | 0 | 20 | 0 |
| Quadrant | Total seconds | Saturated seconds | Saturation percentage |
|---|---|---|---|
| A | 6202 | 83 | 1.338278% |
| B | 6202 | 89 | 1.435021% |
| C | 6202 | 137 | 2.208965% |
| D | 6202 | 85 | 1.370526% |
Noise dominated data is calculated using 1-second bins in cleaned event files. If a bin has >2000 counts, and if more than 50% of those come from <1% of pixels, then it is considered to be noise-dominated and hence unusable.
| Quadrant | # 1 sec bins | Bins with >0 counts | Bins with >2000 counts | High rate bins dominated by noise | Noise dominated (total time) | Noise dominated (detector-on time) | Marked lightcurve |
|---|---|---|---|---|---|---|---|
| A | 7507 | 6202 | 3 | 3 | 0.04% | 0.05% | 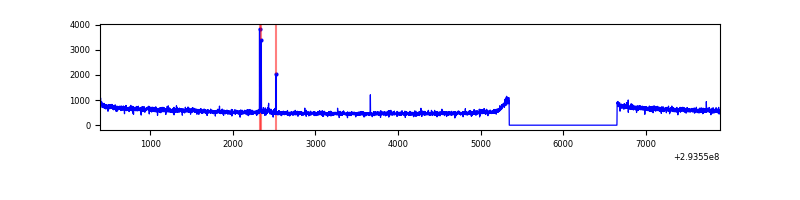 |
| B | 7507 | 6202 | 6 | 6 | 0.08% | 0.10% | 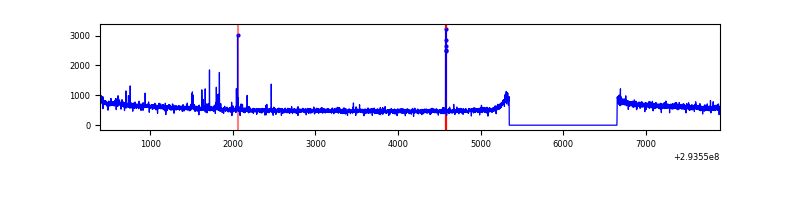 |
| C | 7507 | 6202 | 3 | 3 | 0.04% | 0.05% | 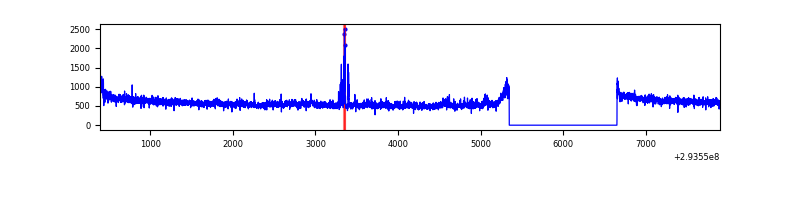 |
| D | 7507 | 6202 | 17 | 17 | 0.23% | 0.27% | 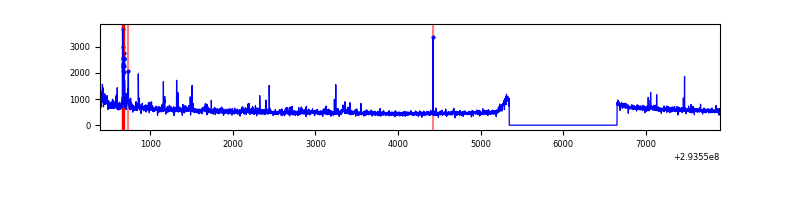 |
Top three noisy pixels from each quadrant. If the there are fewer than three noisy pixels in the level2.evt file, extra rows are filled as -1
| Pixel properties | Quadrant properties | ||||||
|---|---|---|---|---|---|---|---|
| Quadrant | DetID | PixID | Counts | Sigma | Mean | Median | Sigma |
| A | 9 | 143 | 28955 | 161.82 | 878 | 863 | 173.6 |
| A | 3 | 1 | 16712 | 91.29 | 878 | 863 | 173.6 |
| A | 13 | 254 | 7859 | 40.3 | 878 | 863 | 173.6 |
| B | 0 | 190 | 29535 | 174.75 | 875 | 856 | 164.1 |
| B | 12 | 111 | 19010 | 110.62 | 875 | 856 | 164.1 |
| B | 11 | 111 | 16717 | 96.65 | 875 | 856 | 164.1 |
| C | 3 | 233 | 197098 | 1000.63 | 854 | 864 | 196.1 |
| C | 14 | 238 | 135252 | 685.27 | 854 | 864 | 196.1 |
| C | 13 | 61 | 5966 | 26.02 | 854 | 864 | 196.1 |
| D | 10 | 66 | 141905 | 678.79 | 865 | 844 | 207.8 |
| D | 13 | 104 | 59963 | 284.48 | 865 | 844 | 207.8 |
| D | 1 | 52 | 55271 | 261.9 | 865 | 844 | 207.8 |
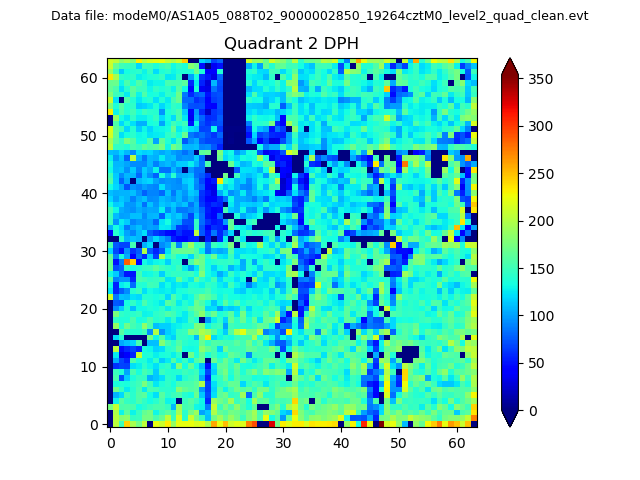
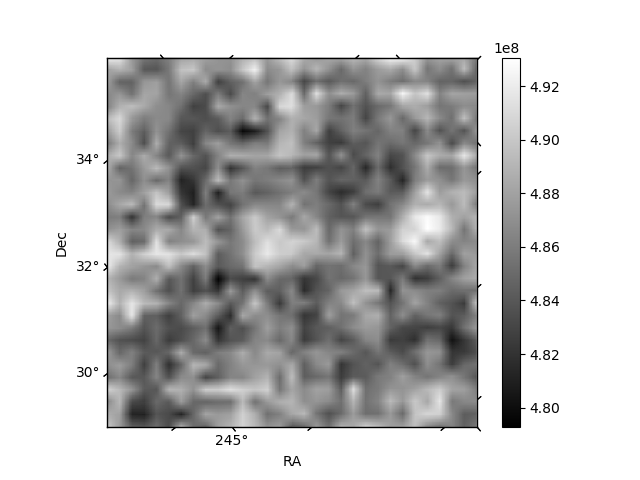
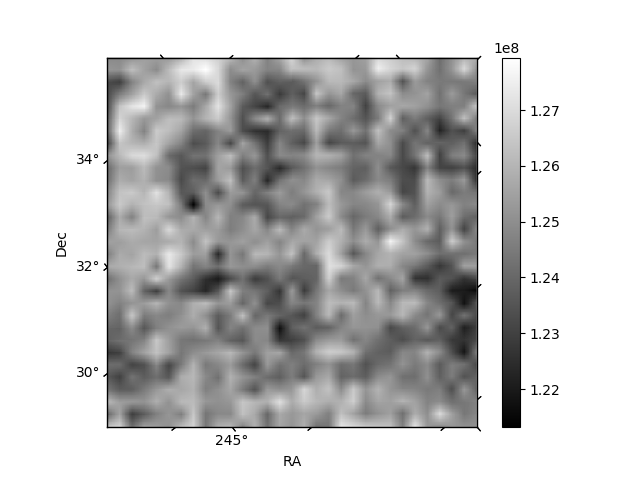
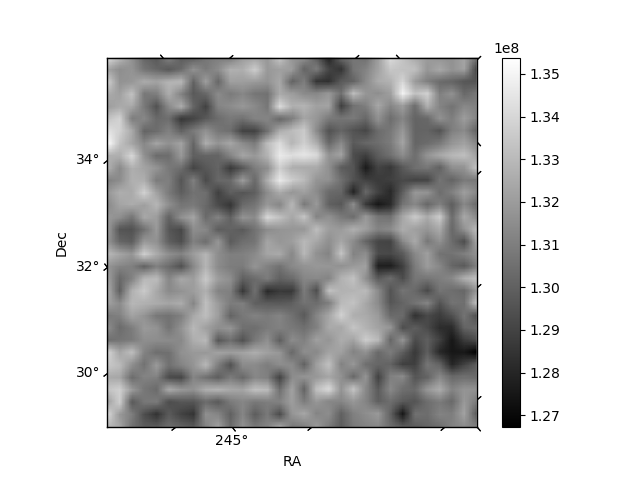
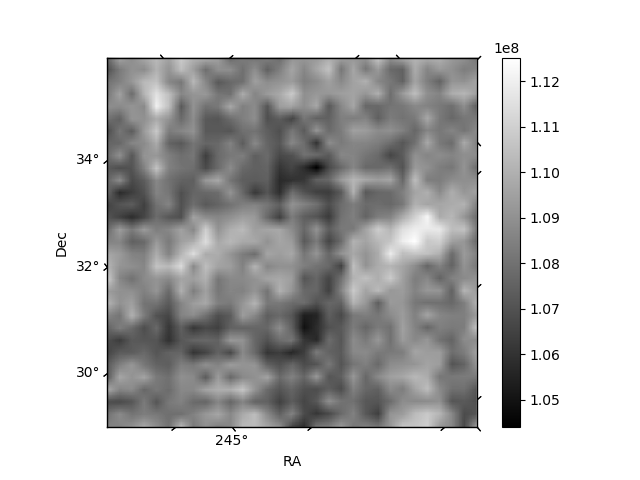
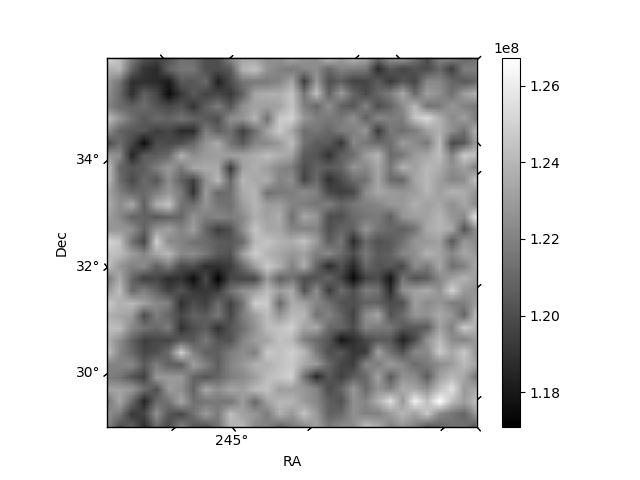
Histogram calculated using DETX and DETY for each event in the final _common_clean file
| Quadrant A | 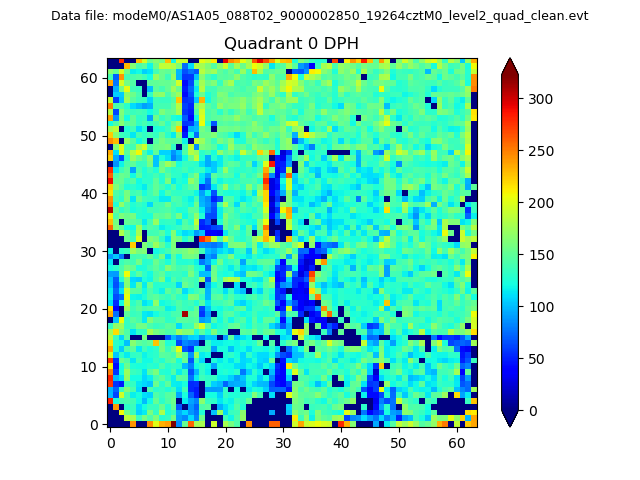 |
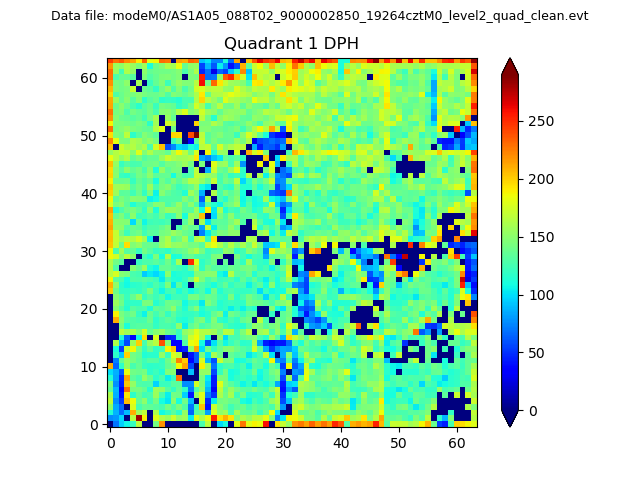 |
Quadrant B |
|---|---|---|---|
| Quadrant D | 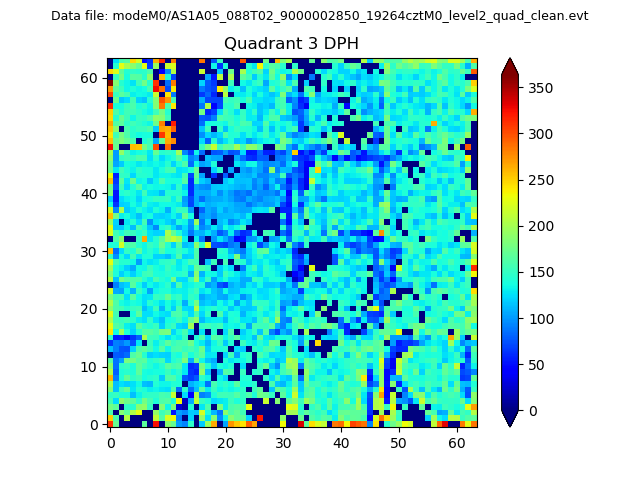 |
 |
Quadrant C |
| Plot type | Count rate plots | Images |
|---|---|---|
| Comparison with Poisson distribution Blue bars denote a histogram of data divided into 1 sec bins. Red curve is a Poisson curve with rate = median count rate of data. |
 |
 |
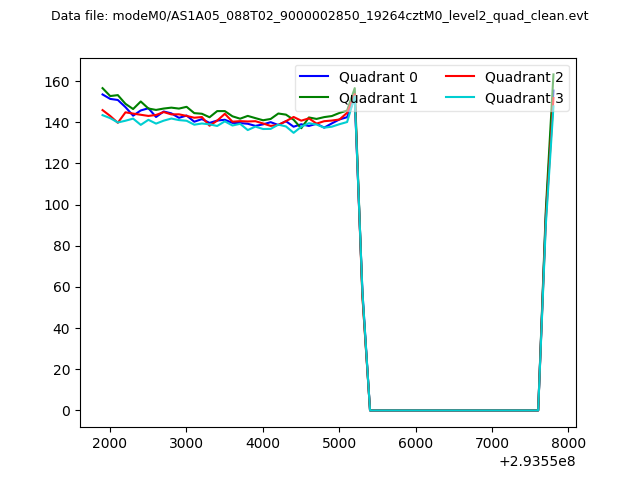
| Quadrant-wise count rates Data is divided into 100 sec bins |
 |
|
| Module-wise count rates for Quadrant A Data is divided into 100 sec bins |
 |
 |
| Module-wise count rates for Quadrant B Data is divided into 100 sec bins |
 |
 |
| Module-wise count rates for Quadrant C Data is divided into 100 sec bins |
 |
 |
| Module-wise count rates for Quadrant D Data is divided into 100 sec bins |
 |
 |
| Parameter | Plot |
|---|---|
| CZT HV Monitor |  |
| D_VDD | 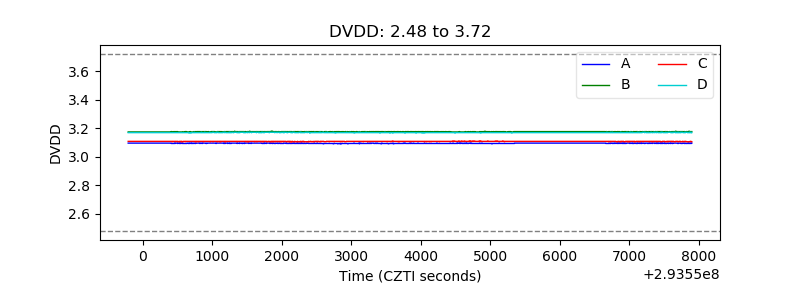 |
| Temperature 1 | 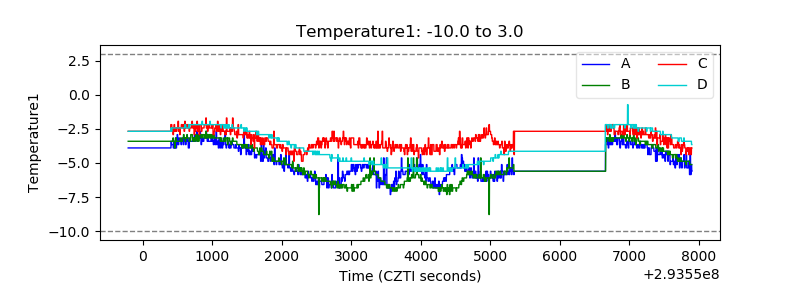 |
| Veto HV Monitor | 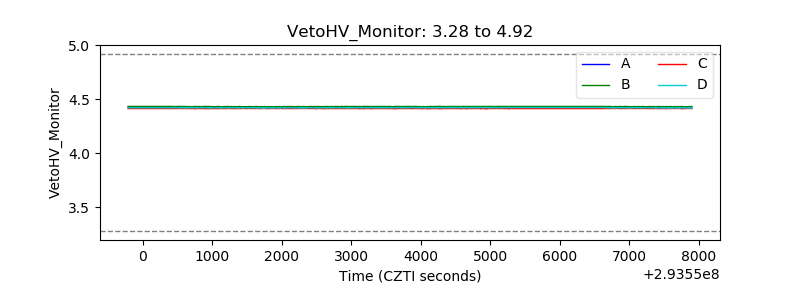 |
| Veto LLD | 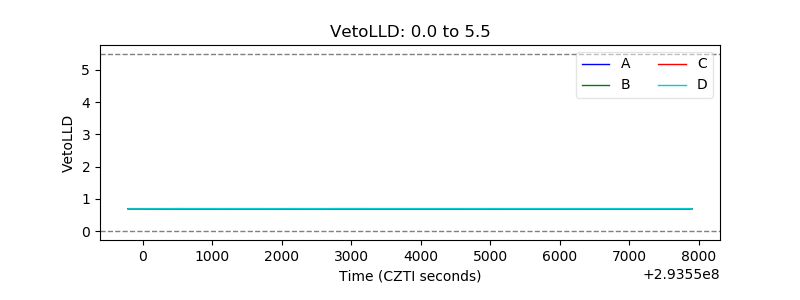 |
| Alpha Counter | 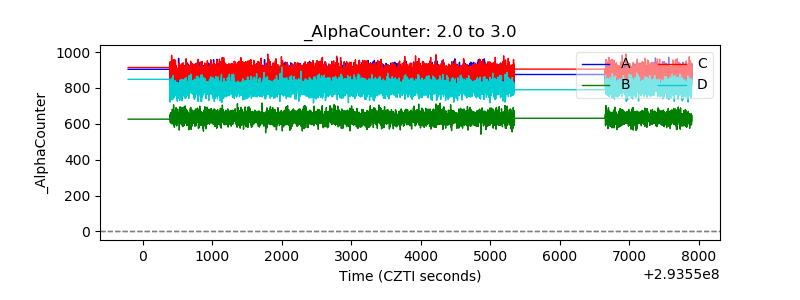 |
| _CPM_Rate | 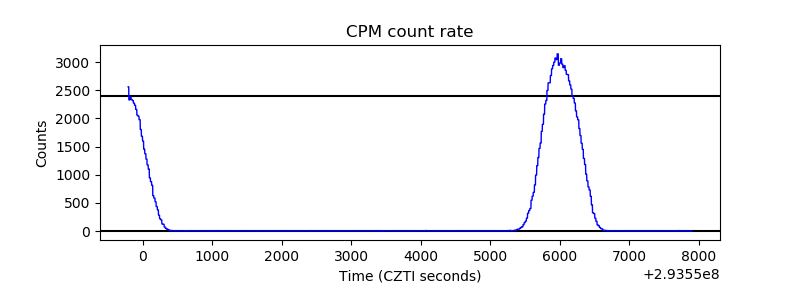 |
| CZT Counter | 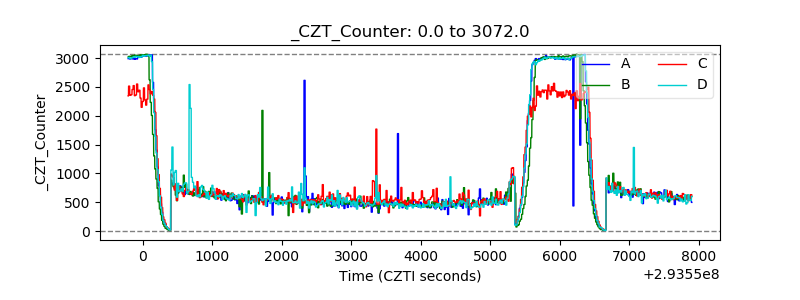 |
| +2.5 Volts monitor |  |
| +5 Volts monitor |  |
| _ROLL_ROT | 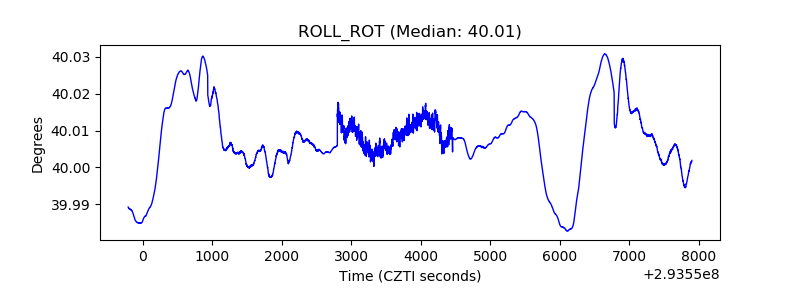 |
| _Roll_DEC |  |
| _Roll_RA | 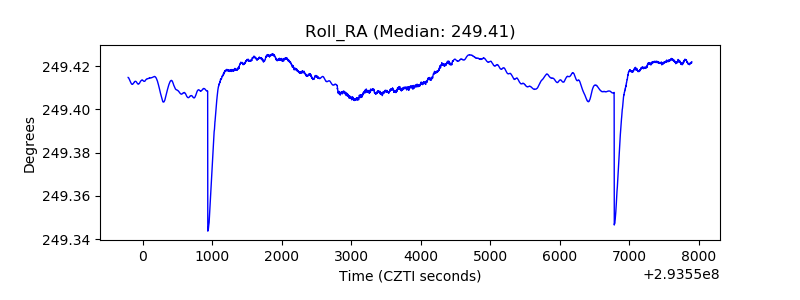 |
| Veto Counter |  |