| Param | Original file | Final file |
|---|---|---|
| Filename | modeM0/AS1A05_088T02_9000002850_19265cztM0_level2.evt | modeM0/AS1A05_088T02_9000002850_19265cztM0_level2_quad_clean.evt |
| Size (bytes) | 483,120,000 | 98,936,640 |
| Size | 460.7 MB | 94.4 MB |
| Events in quadrant A | 3,427,684 | 638,459 |
| Events in quadrant B | 3,510,977 | 656,410 |
| Events in quadrant C | 3,883,410 | 640,265 |
| Events in quadrant D | 3,389,076 | 629,024 |
| Mode M0 | |||
|---|---|---|---|
| Quadrant | BADHDUFLAG | Total packets | Discarded packets |
| A | 0 | 14234 | 2 |
| B | 0 | 14492 | 2 |
| C | 0 | 15772 | 2 |
| D | 0 | 14125 | 2 |
| Mode SS | |||
|---|---|---|---|
| Quadrant | BADHDUFLAG | Total packets | Discarded packets |
| A | 0 | 126 | 0 |
| B | 0 | 126 | 0 |
| C | 0 | 126 | 0 |
| D | 0 | 126 | 0 |
| Mode M9 | |||
|---|---|---|---|
| Quadrant | BADHDUFLAG | Total packets | Discarded packets |
| A | 0 | 27 | 0 |
| B | 0 | 27 | 0 |
| C | 0 | 27 | 0 |
| D | 0 | 27 | 0 |
| Quadrant | Total seconds | Saturated seconds | Saturation percentage |
|---|---|---|---|
| A | 6198 | 139 | 2.242659% |
| B | 6199 | 155 | 2.500403% |
| C | 6198 | 221 | 3.565666% |
| D | 6198 | 116 | 1.871571% |
Noise dominated data is calculated using 1-second bins in cleaned event files. If a bin has >2000 counts, and if more than 50% of those come from <1% of pixels, then it is considered to be noise-dominated and hence unusable.
| Quadrant | # 1 sec bins | Bins with >0 counts | Bins with >2000 counts | High rate bins dominated by noise | Noise dominated (total time) | Noise dominated (detector-on time) | Marked lightcurve |
|---|---|---|---|---|---|---|---|
| A | 8863 | 6198 | 0 | 0 | 0.00% | 0.00% | 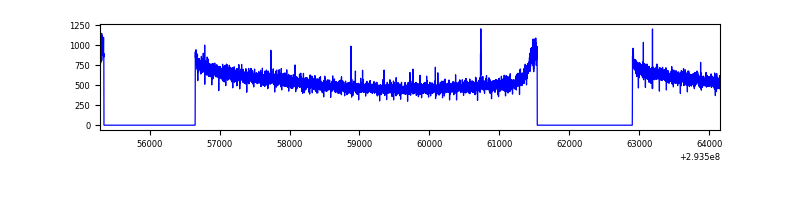 |
| B | 8864 | 6200 | 0 | 0 | 0.00% | 0.00% | 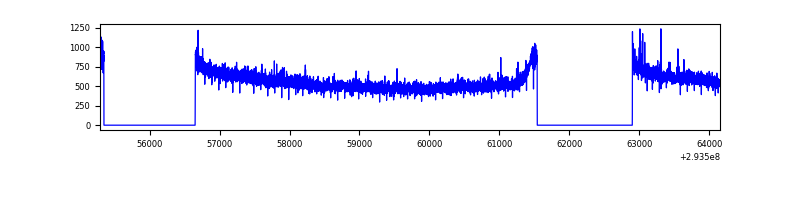 |
| C | 8863 | 6198 | 20 | 20 | 0.23% | 0.32% | 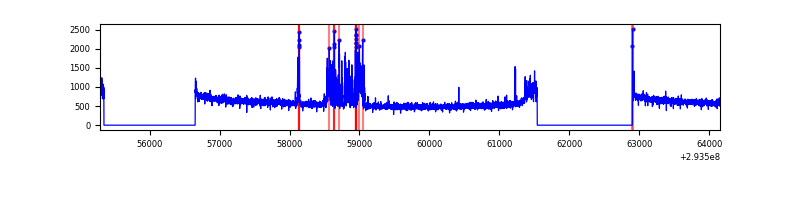 |
| D | 8863 | 6198 | 3 | 3 | 0.03% | 0.05% | 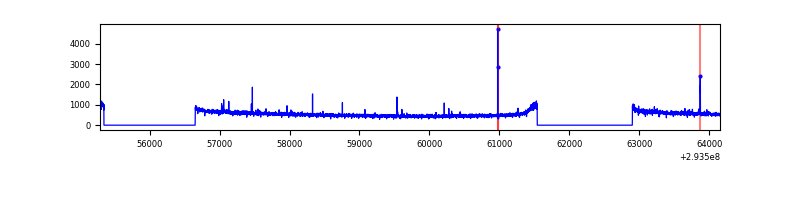 |
Top three noisy pixels from each quadrant. If the there are fewer than three noisy pixels in the level2.evt file, extra rows are filled as -1
| Pixel properties | Quadrant properties | ||||||
|---|---|---|---|---|---|---|---|
| Quadrant | DetID | PixID | Counts | Sigma | Mean | Median | Sigma |
| A | 13 | 254 | 9601 | 49.47 | 887 | 872 | 176.4 |
| A | 3 | 1 | 9242 | 47.44 | 887 | 872 | 176.4 |
| A | 0 | 226 | 7603 | 38.15 | 887 | 872 | 176.4 |
| B | 12 | 111 | 19083 | 109.83 | 889 | 870 | 165.8 |
| B | 11 | 111 | 16785 | 95.98 | 889 | 870 | 165.8 |
| B | 0 | 229 | 15624 | 88.97 | 889 | 870 | 165.8 |
| C | 3 | 247 | 248435 | 1243.47 | 871 | 879 | 199.1 |
| C | 14 | 238 | 137763 | 687.57 | 871 | 879 | 199.1 |
| C | 3 | 233 | 73480 | 364.67 | 871 | 879 | 199.1 |
| D | 1 | 52 | 43098 | 198.07 | 886 | 865 | 213.2 |
| D | 2 | 234 | 26477 | 120.12 | 886 | 865 | 213.2 |
| D | 14 | 226 | 8916 | 37.76 | 886 | 865 | 213.2 |
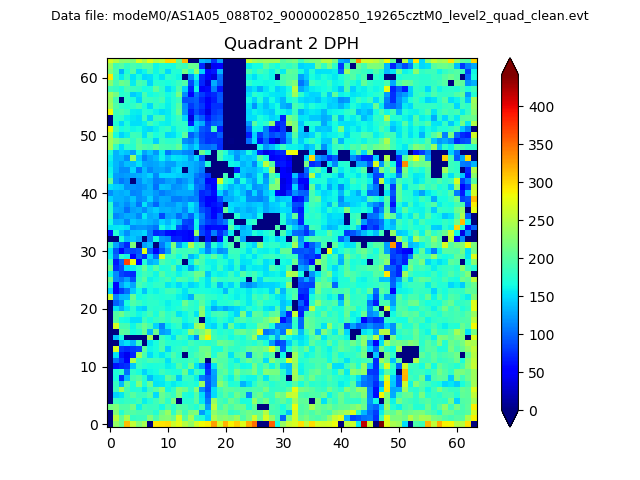
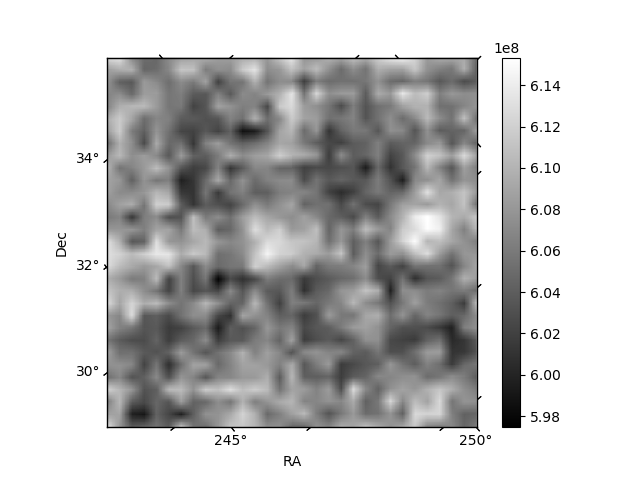
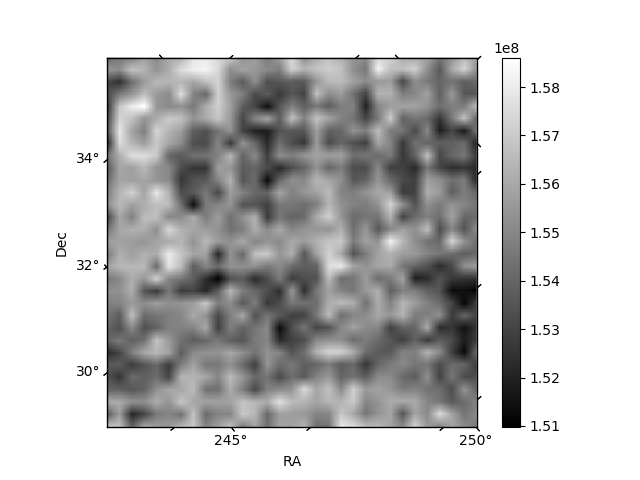
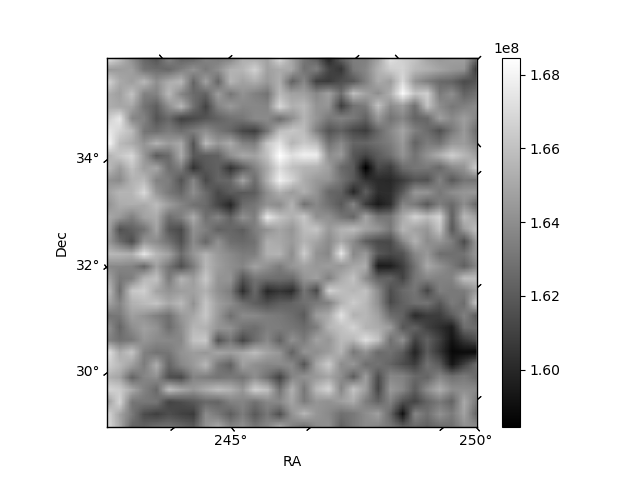
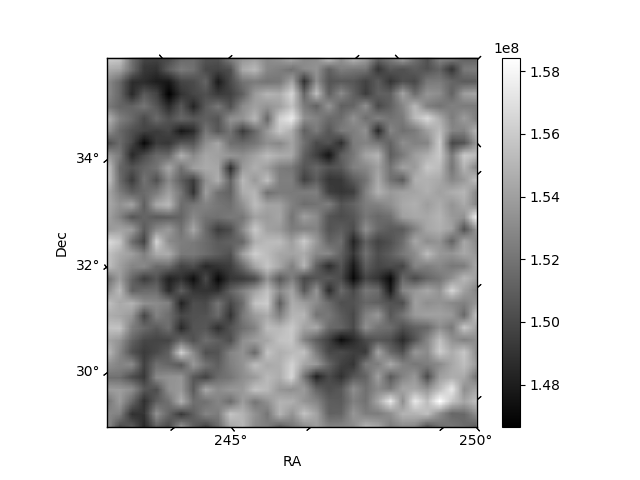
Histogram calculated using DETX and DETY for each event in the final _common_clean file
| Quadrant A | 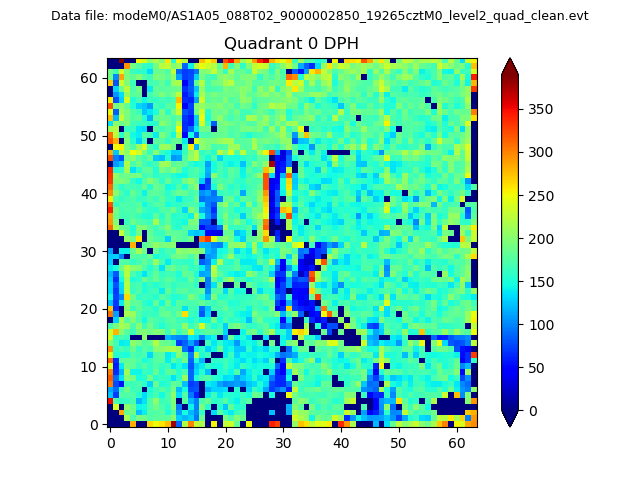 |
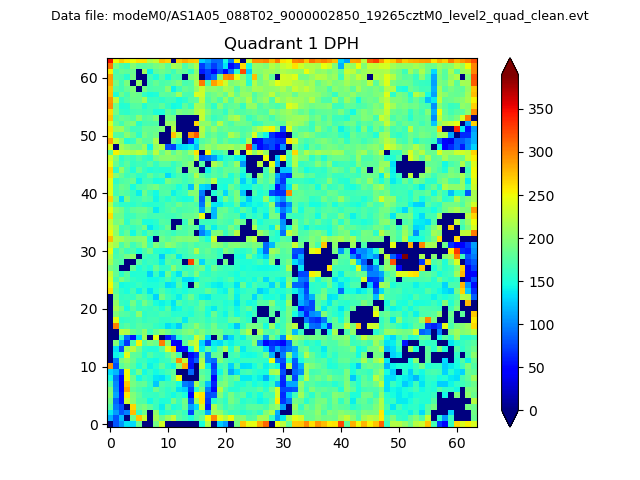 |
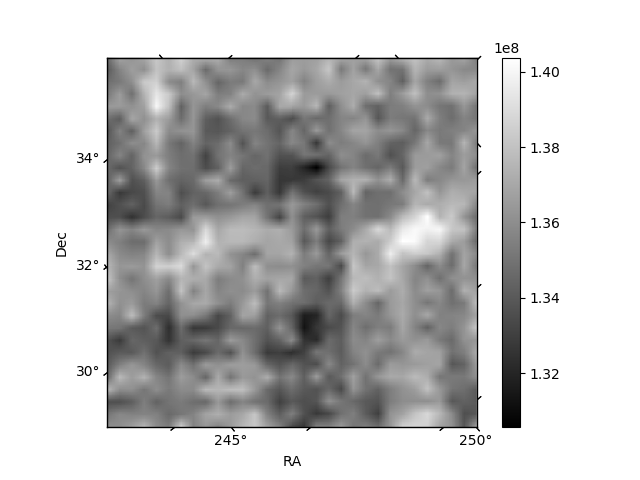
Quadrant B |
|---|---|---|---|
| Quadrant D | 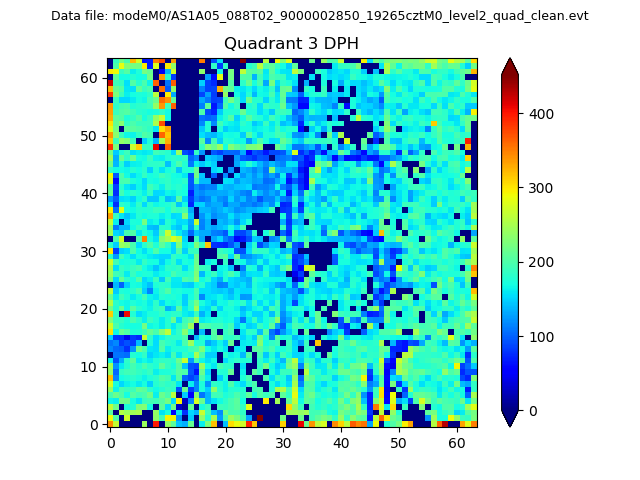 |
 |
Quadrant C |
| Plot type | Count rate plots | Images |
|---|---|---|
| Comparison with Poisson distribution Blue bars denote a histogram of data divided into 1 sec bins. Red curve is a Poisson curve with rate = median count rate of data. |
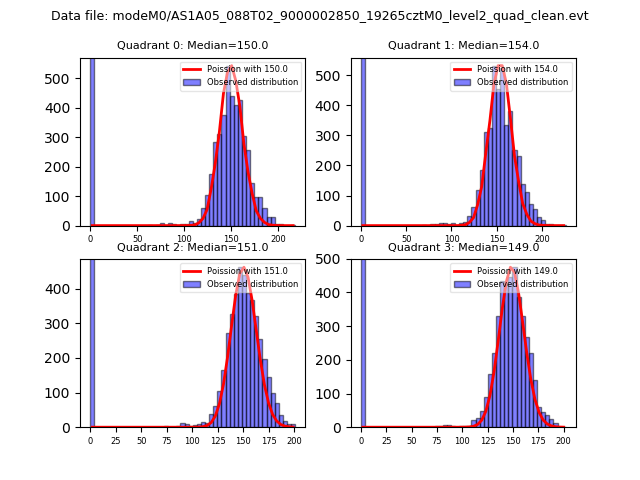 |
 |
| Quadrant-wise count rates Data is divided into 100 sec bins |
 |
|
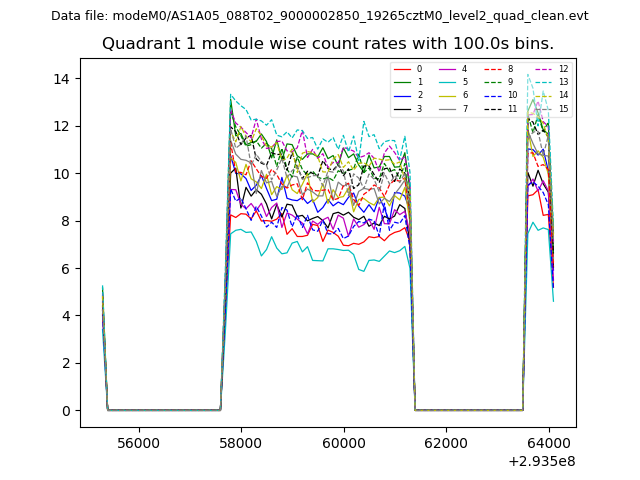
| Module-wise count rates for Quadrant A Data is divided into 100 sec bins |
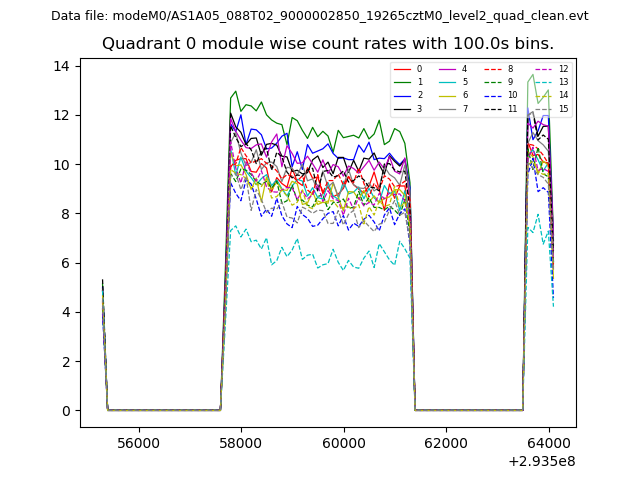 |
 |
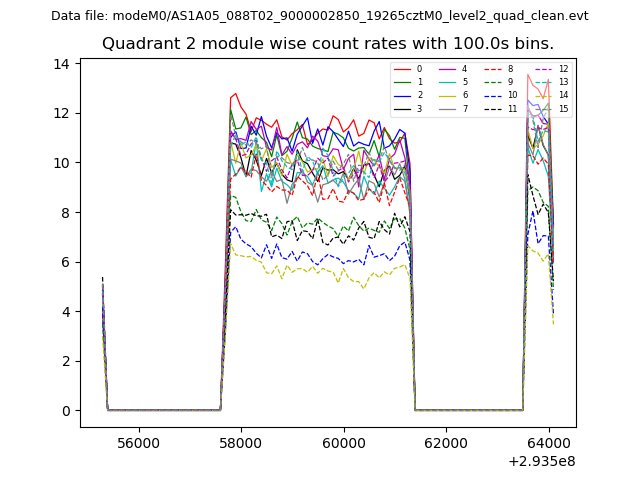
| Module-wise count rates for Quadrant B Data is divided into 100 sec bins |
 |
 |
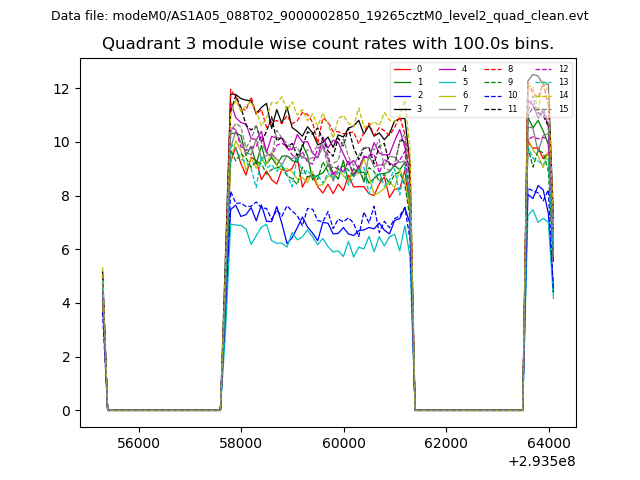
| Module-wise count rates for Quadrant C Data is divided into 100 sec bins |
 |
 |
| Module-wise count rates for Quadrant D Data is divided into 100 sec bins |
 |
 |
| Parameter | Plot |
|---|---|
| CZT HV Monitor | 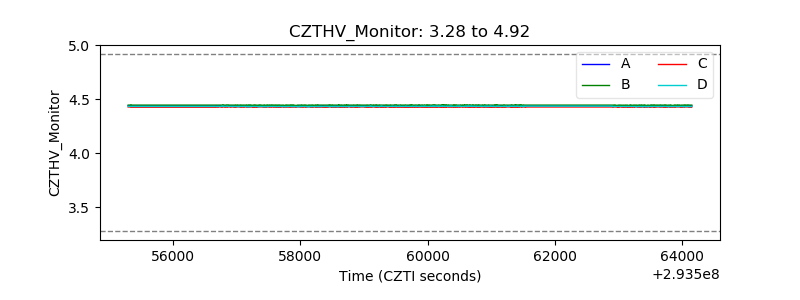 |
| D_VDD | 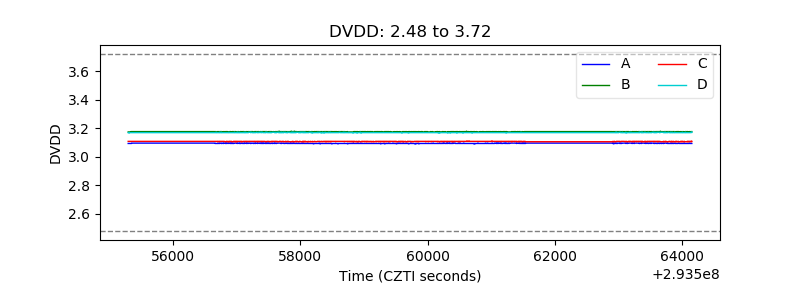 |
| Temperature 1 | 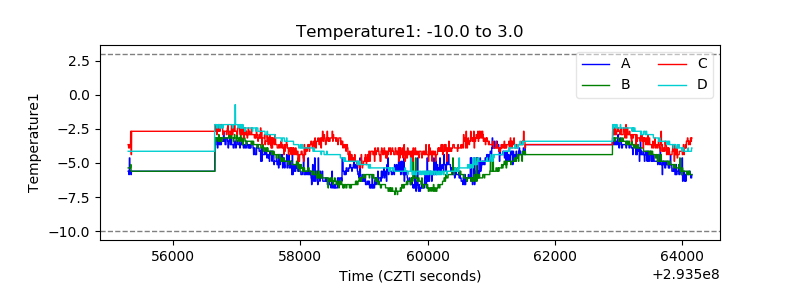 |
| Veto HV Monitor | 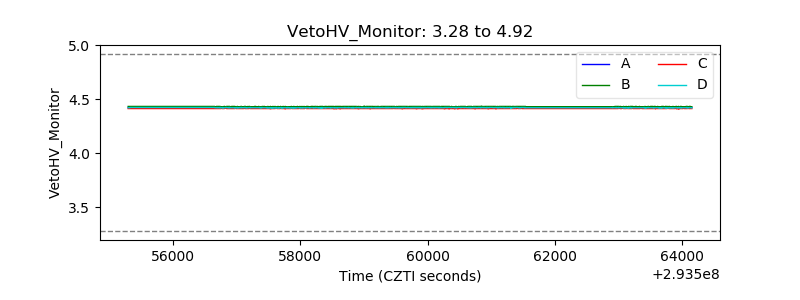 |
| Veto LLD | 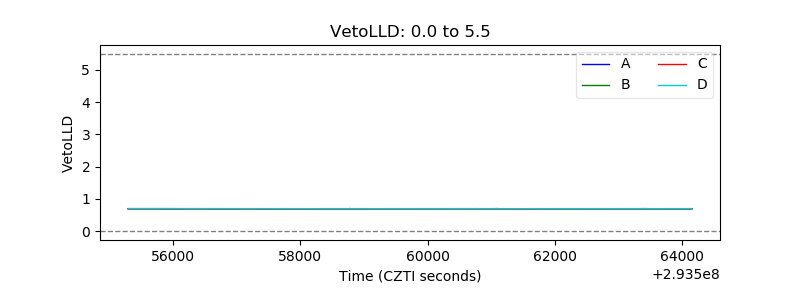 |
| Alpha Counter |  |
| _CPM_Rate | 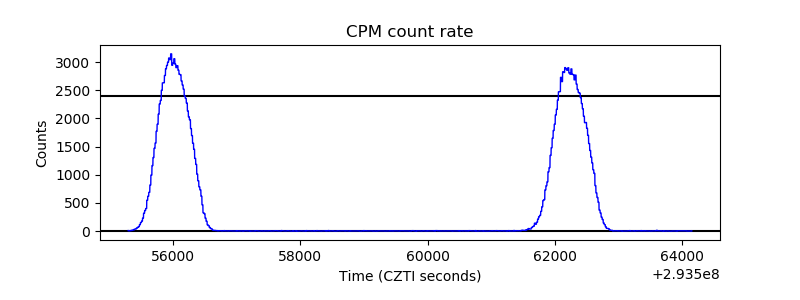 |
| CZT Counter | 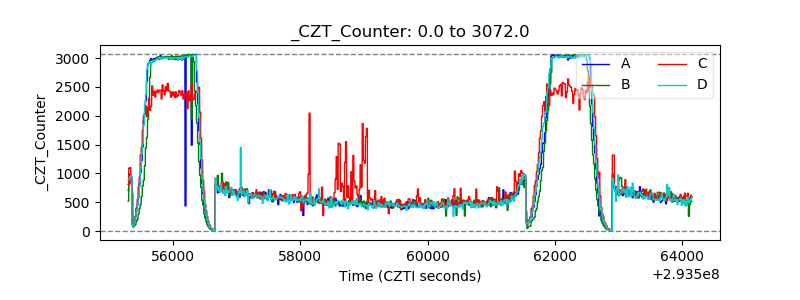 |
| +2.5 Volts monitor |  |
| +5 Volts monitor |  |
| _ROLL_ROT | 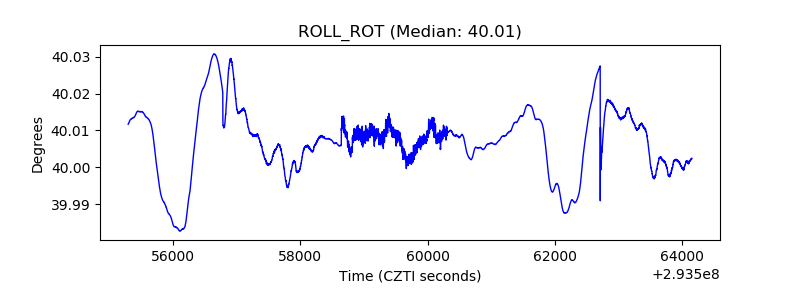 |
| _Roll_DEC |  |
| _Roll_RA | 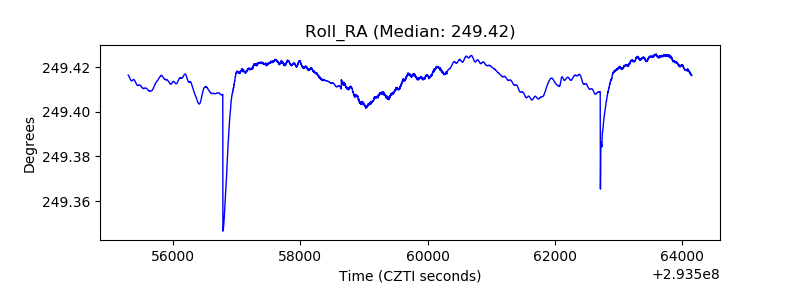 |
| Veto Counter | 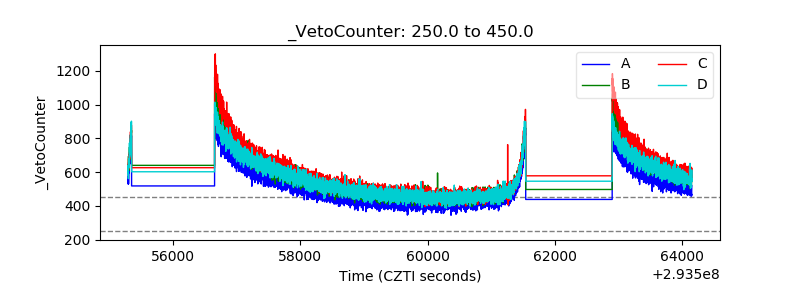 |