| Param | Original file | Final file |
|---|---|---|
| Filename | modeM0/AS1A05_088T02_9000002850_19266cztM0_level2.evt | modeM0/AS1A05_088T02_9000002850_19266cztM0_level2_quad_clean.evt |
| Size (bytes) | 455,322,240 | 106,557,120 |
| Size | 434.2 MB | 101.6 MB |
| Events in quadrant A | 3,207,091 | 693,006 |
| Events in quadrant B | 3,284,721 | 720,033 |
| Events in quadrant C | 3,652,369 | 706,481 |
| Events in quadrant D | 3,231,705 | 682,473 |
| Mode M0 | |||
|---|---|---|---|
| Quadrant | BADHDUFLAG | Total packets | Discarded packets |
| A | 0 | 13371 | 1 |
| B | 0 | 13651 | 1 |
| C | 0 | 14678 | 1 |
| D | 0 | 13501 | 2 |
| Mode SS | |||
|---|---|---|---|
| Quadrant | BADHDUFLAG | Total packets | Discarded packets |
| A | 0 | 122 | 0 |
| B | 0 | 122 | 0 |
| C | 0 | 122 | 0 |
| D | 0 | 122 | 0 |
| Mode M9 | |||
|---|---|---|---|
| Quadrant | BADHDUFLAG | Total packets | Discarded packets |
| A | 0 | 14 | 0 |
| B | 0 | 14 | 0 |
| C | 0 | 14 | 0 |
| D | 0 | 14 | 0 |
| Quadrant | Total seconds | Saturated seconds | Saturation percentage |
|---|---|---|---|
| A | 6095 | 58 | 0.951600% |
| B | 6096 | 83 | 1.361549% |
| C | 6096 | 258 | 4.232283% |
| D | 6095 | 65 | 1.066448% |
Noise dominated data is calculated using 1-second bins in cleaned event files. If a bin has >2000 counts, and if more than 50% of those come from <1% of pixels, then it is considered to be noise-dominated and hence unusable.
| Quadrant | # 1 sec bins | Bins with >0 counts | Bins with >2000 counts | High rate bins dominated by noise | Noise dominated (total time) | Noise dominated (detector-on time) | Marked lightcurve |
|---|---|---|---|---|---|---|---|
| A | 7455 | 6096 | 1 | 1 | 0.01% | 0.02% | 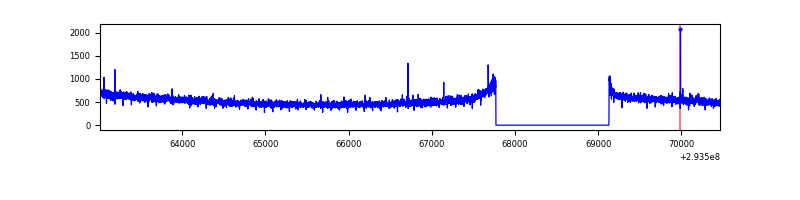 |
| B | 7456 | 6097 | 0 | 0 | 0.00% | 0.00% | 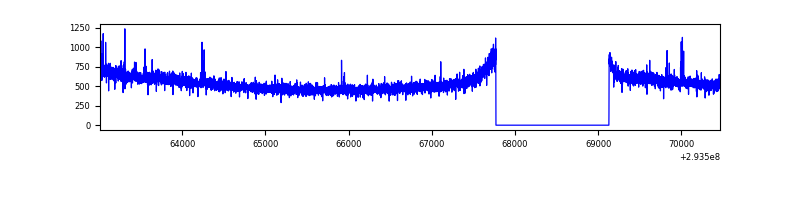 |
| C | 7456 | 6096 | 59 | 59 | 0.79% | 0.97% | 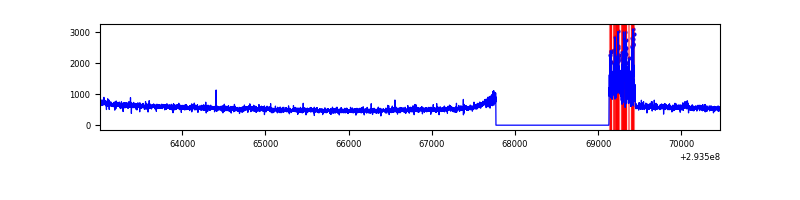 |
| D | 7455 | 6096 | 7 | 7 | 0.09% | 0.11% | 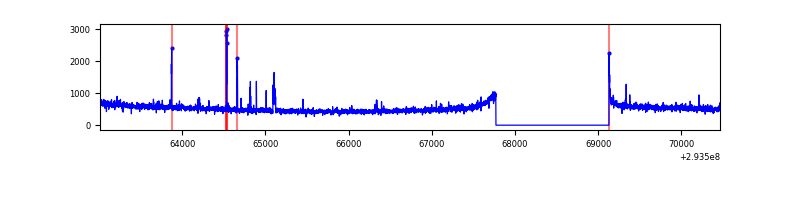 |
Top three noisy pixels from each quadrant. If the there are fewer than three noisy pixels in the level2.evt file, extra rows are filled as -1
| Pixel properties | Quadrant properties | ||||||
|---|---|---|---|---|---|---|---|
| Quadrant | DetID | PixID | Counts | Sigma | Mean | Median | Sigma |
| A | 4 | 2 | 10208 | 56.86 | 827 | 812 | 165.3 |
| A | 13 | 254 | 8387 | 45.84 | 827 | 812 | 165.3 |
| A | 0 | 226 | 7132 | 38.24 | 827 | 812 | 165.3 |
| B | 12 | 111 | 18260 | 112.59 | 833 | 814 | 155.0 |
| B | 11 | 111 | 15998 | 97.99 | 833 | 814 | 155.0 |
| B | 14 | 111 | 14615 | 89.07 | 833 | 814 | 155.0 |
| C | 3 | 247 | 287198 | 1525.07 | 817 | 827 | 187.8 |
| C | 14 | 238 | 127735 | 675.85 | 817 | 827 | 187.8 |
| C | 3 | 233 | 49954 | 261.63 | 817 | 827 | 187.8 |
| D | 1 | 52 | 46942 | 230.22 | 827 | 807 | 200.4 |
| D | 7 | 223 | 43242 | 211.76 | 827 | 807 | 200.4 |
| D | 2 | 234 | 26050 | 125.97 | 827 | 807 | 200.4 |
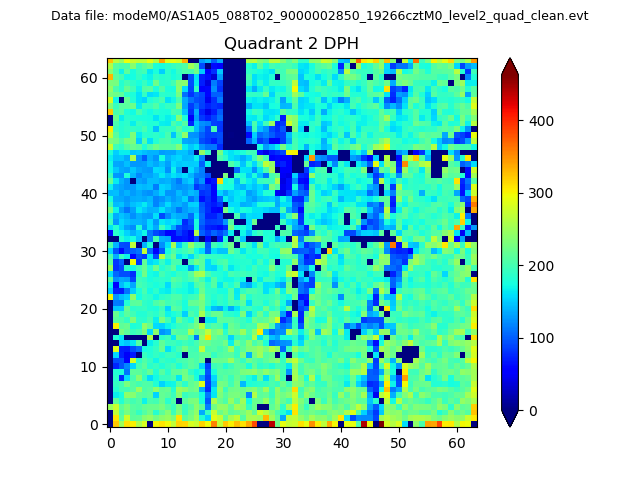
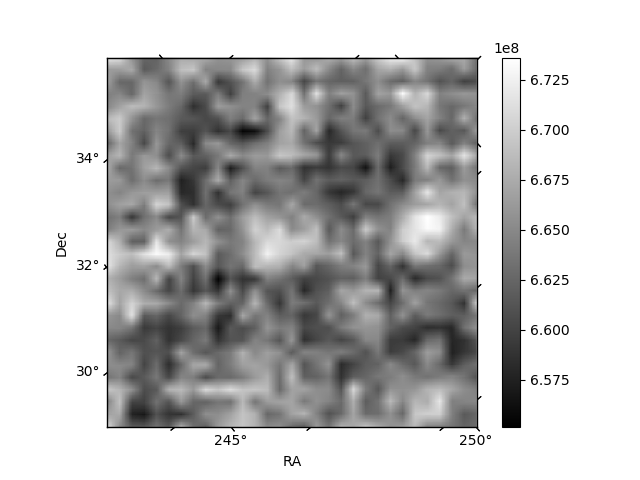
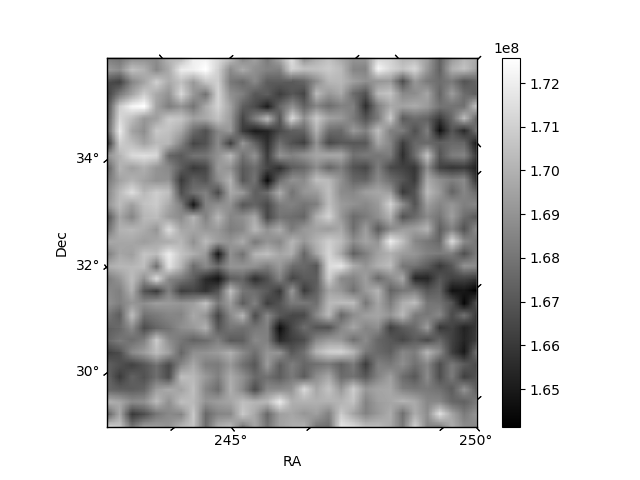
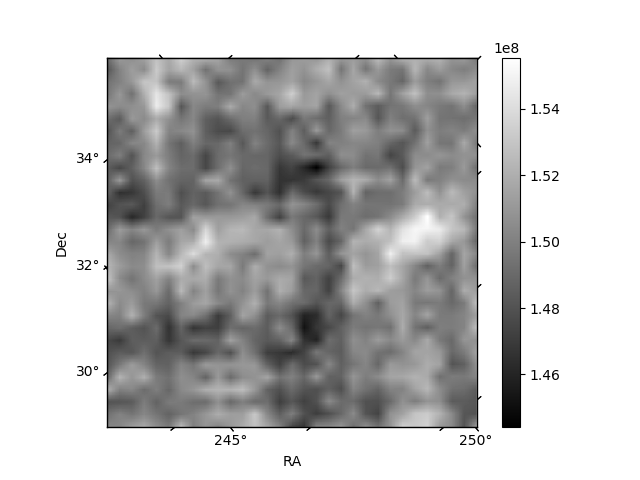
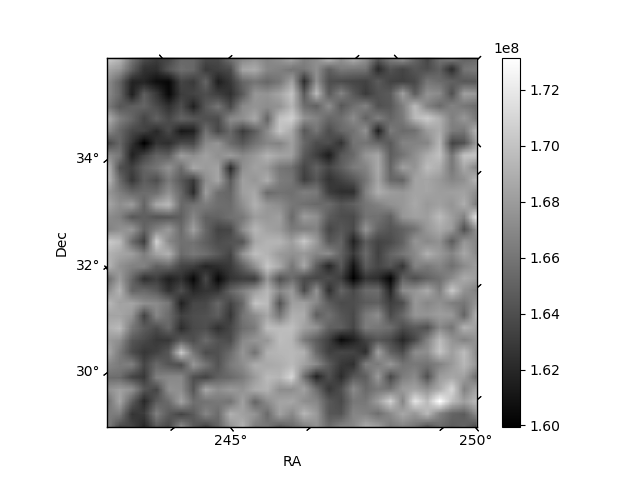
Histogram calculated using DETX and DETY for each event in the final _common_clean file
| Quadrant A | 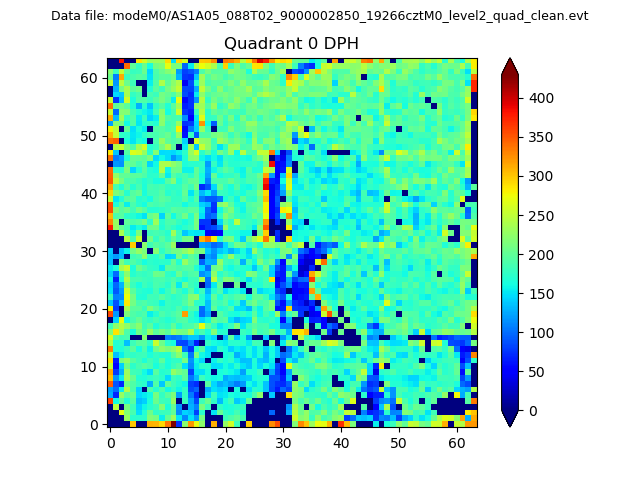 |
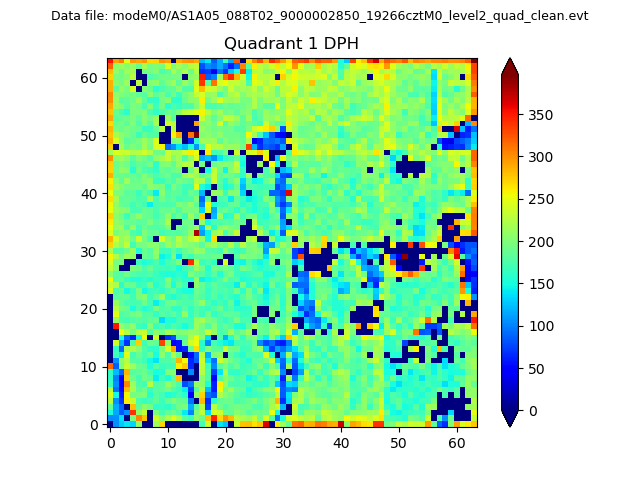 |
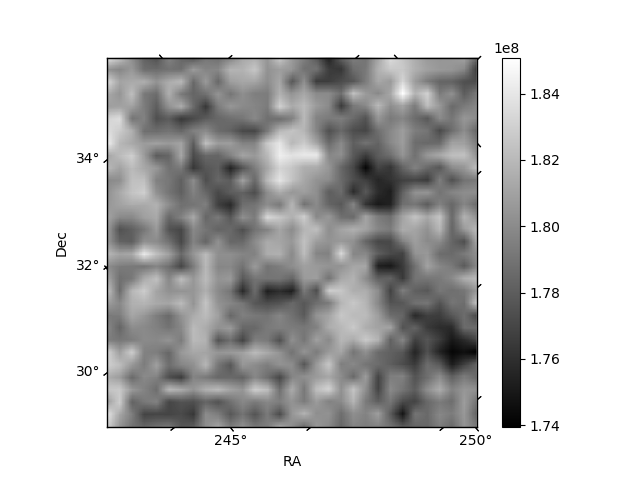
Quadrant B |
|---|---|---|---|
| Quadrant D | 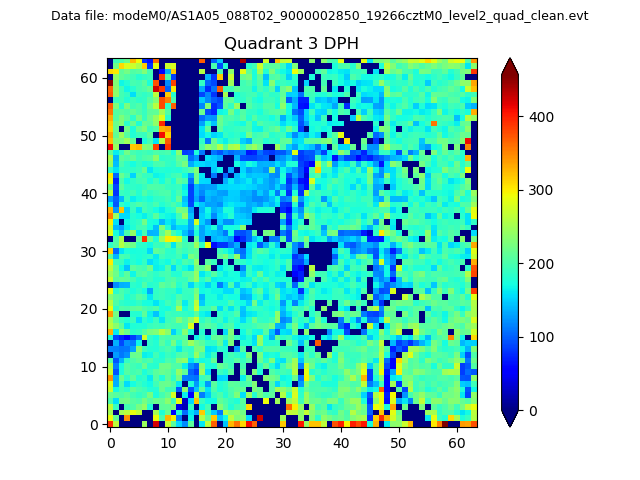 |
 |
Quadrant C |
| Plot type | Count rate plots | Images |
|---|---|---|
| Comparison with Poisson distribution Blue bars denote a histogram of data divided into 1 sec bins. Red curve is a Poisson curve with rate = median count rate of data. |
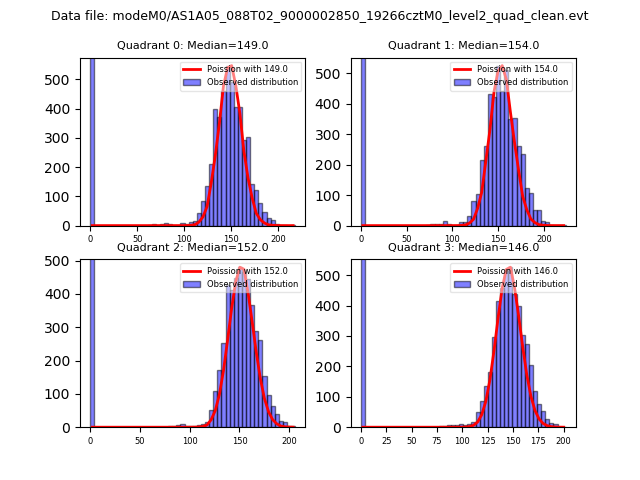 |
 |
| Quadrant-wise count rates Data is divided into 100 sec bins |
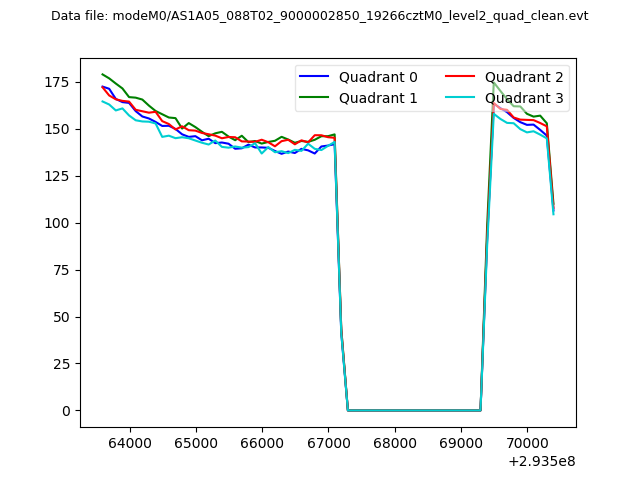 |
|
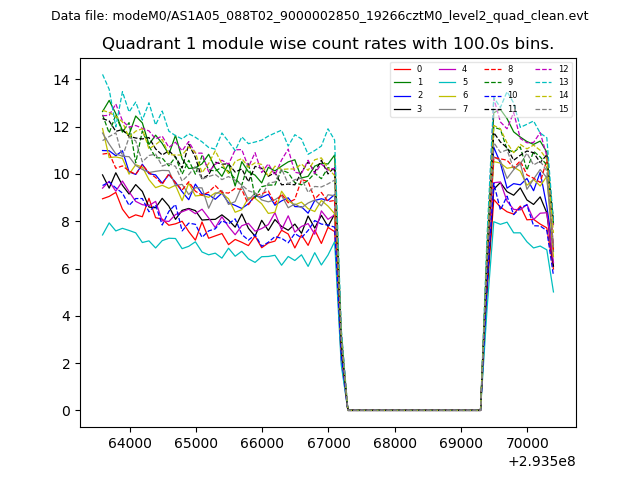
| Module-wise count rates for Quadrant A Data is divided into 100 sec bins |
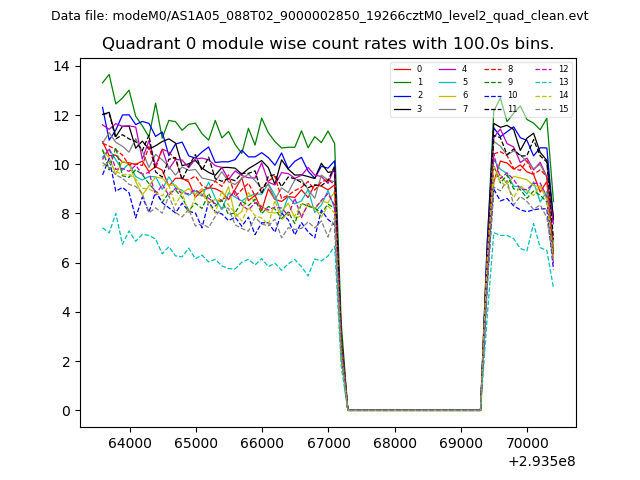 |
 |
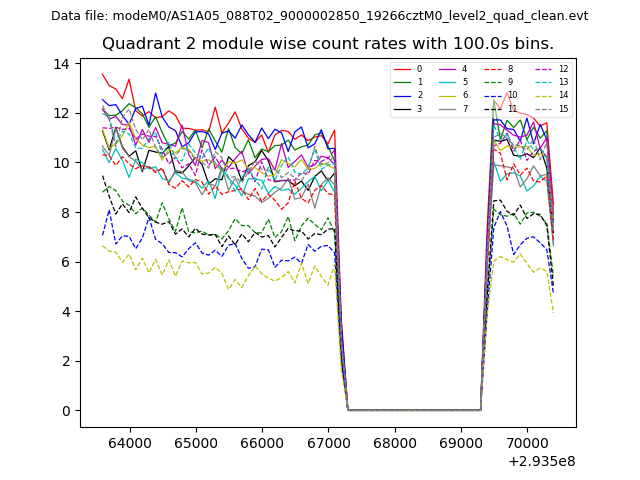
| Module-wise count rates for Quadrant B Data is divided into 100 sec bins |
 |
 |
| Module-wise count rates for Quadrant C Data is divided into 100 sec bins |
 |
 |
| Module-wise count rates for Quadrant D Data is divided into 100 sec bins |
 |
 |
| Parameter | Plot |
|---|---|
| CZT HV Monitor | 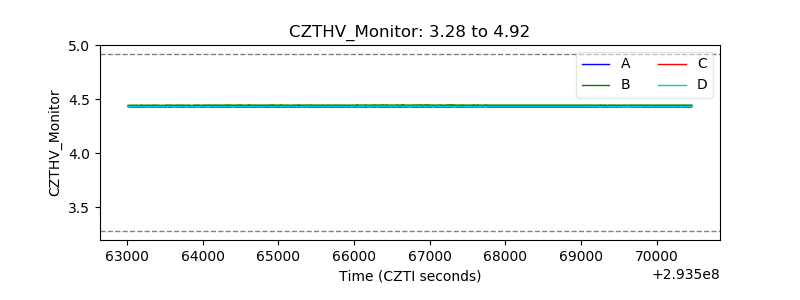 |
| D_VDD | 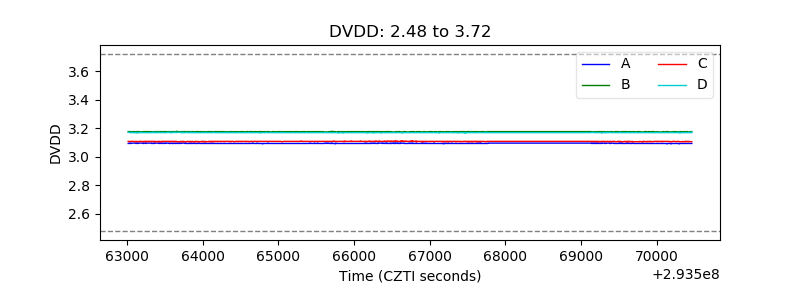 |
| Temperature 1 | 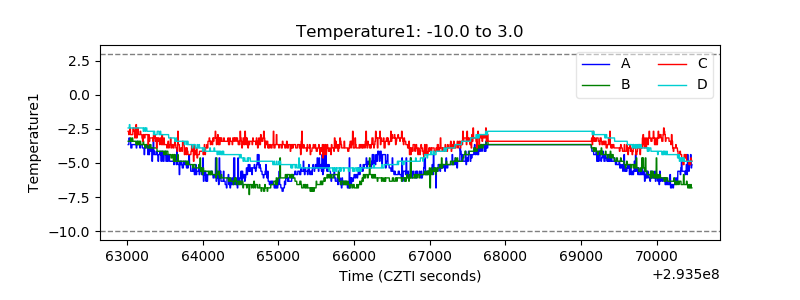 |
| Veto HV Monitor | 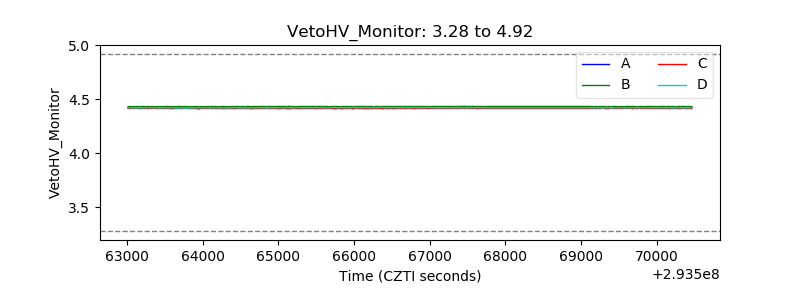 |
| Veto LLD | 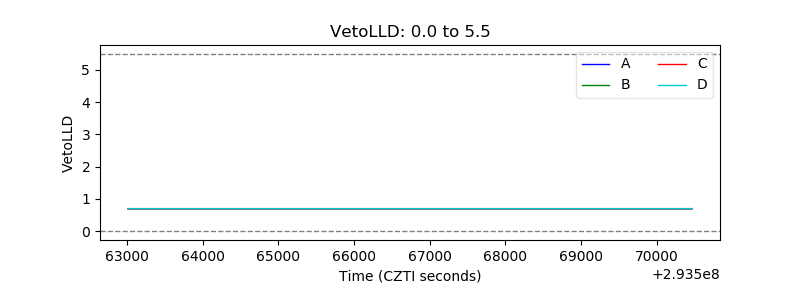 |
| Alpha Counter | 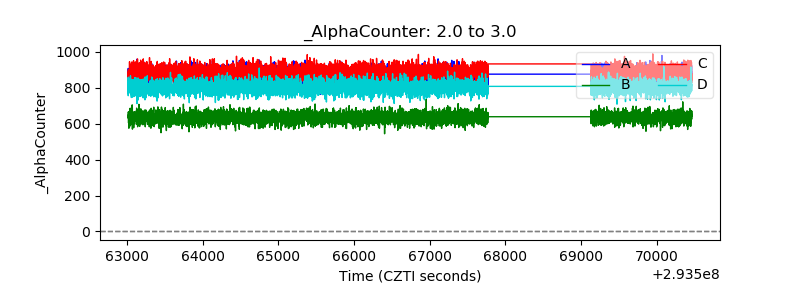 |
| _CPM_Rate | 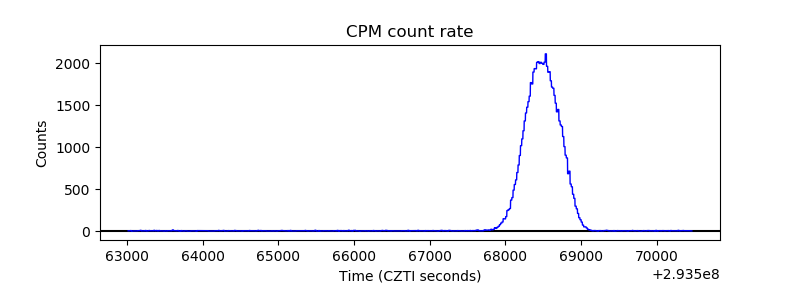 |
| CZT Counter | 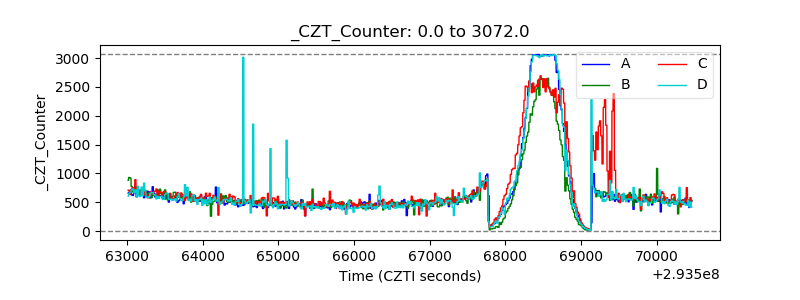 |
| +2.5 Volts monitor |  |
| +5 Volts monitor |  |
| _ROLL_ROT | 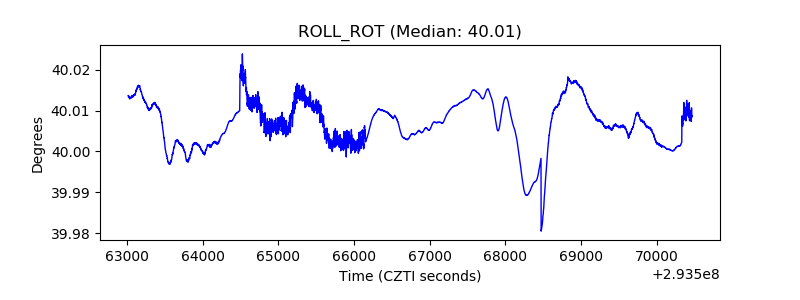 |
| _Roll_DEC | 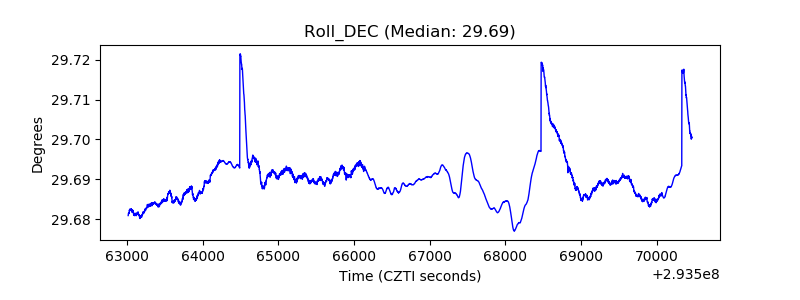 |
| _Roll_RA | 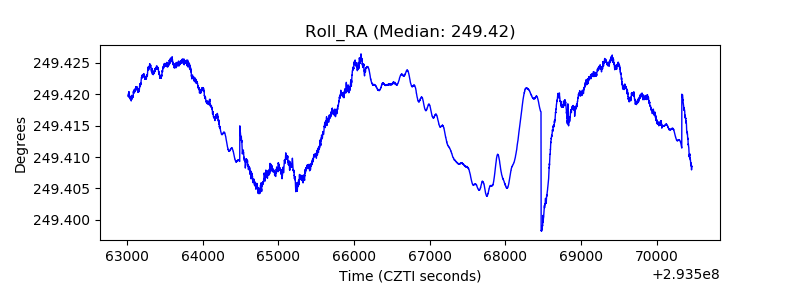 |
| Veto Counter | 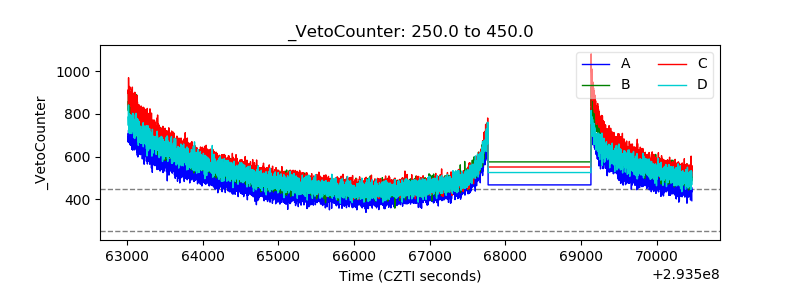 |