| Param | Original file | Final file |
|---|---|---|
| Filename | modeM0/AS1A05_088T02_9000002850_19267cztM0_level2.evt | modeM0/AS1A05_088T02_9000002850_19267cztM0_level2_quad_clean.evt |
| Size (bytes) | 422,864,640 | 97,943,040 |
| Size | 403.3 MB | 93.4 MB |
| Events in quadrant A | 2,967,072 | 632,145 |
| Events in quadrant B | 3,053,725 | 655,543 |
| Events in quadrant C | 3,384,692 | 644,057 |
| Events in quadrant D | 3,001,450 | 623,883 |
| Mode M0 | |||
|---|---|---|---|
| Quadrant | BADHDUFLAG | Total packets | Discarded packets |
| A | 0 | 12538 | 2 |
| B | 0 | 12796 | 2 |
| C | 0 | 13647 | 2 |
| D | 0 | 12793 | 2 |
| Mode SS | |||
|---|---|---|---|
| Quadrant | BADHDUFLAG | Total packets | Discarded packets |
| A | 0 | 120 | 0 |
| B | 0 | 120 | 0 |
| C | 0 | 120 | 0 |
| D | 0 | 120 | 0 |
| Mode M9 | |||
|---|---|---|---|
| Quadrant | BADHDUFLAG | Total packets | Discarded packets |
| A | 0 | 21 | 0 |
| B | 0 | 22 | 0 |
| C | 0 | 22 | 0 |
| D | 0 | 22 | 0 |
| Quadrant | Total seconds | Saturated seconds | Saturation percentage |
|---|---|---|---|
| A | 5875 | 39 | 0.663830% |
| B | 5875 | 75 | 1.276596% |
| C | 5875 | 250 | 4.255319% |
| D | 5875 | 65 | 1.106383% |
Noise dominated data is calculated using 1-second bins in cleaned event files. If a bin has >2000 counts, and if more than 50% of those come from <1% of pixels, then it is considered to be noise-dominated and hence unusable.
| Quadrant | # 1 sec bins | Bins with >0 counts | Bins with >2000 counts | High rate bins dominated by noise | Noise dominated (total time) | Noise dominated (detector-on time) | Marked lightcurve |
|---|---|---|---|---|---|---|---|
| A | 7080 | 5876 | 1 | 1 | 0.01% | 0.02% | 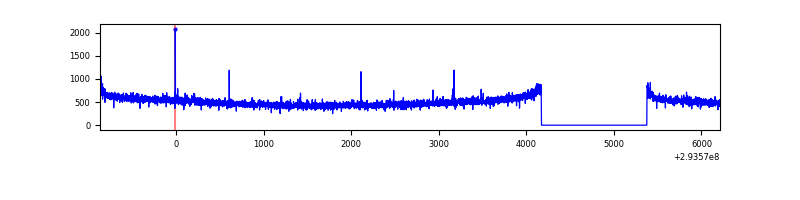 |
| B | 7080 | 5876 | 0 | 0 | 0.00% | 0.00% | 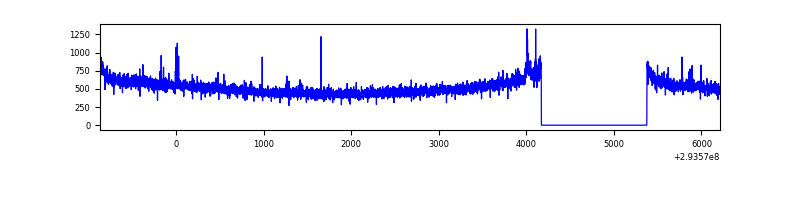 |
| C | 7080 | 5876 | 59 | 59 | 0.83% | 1.00% | 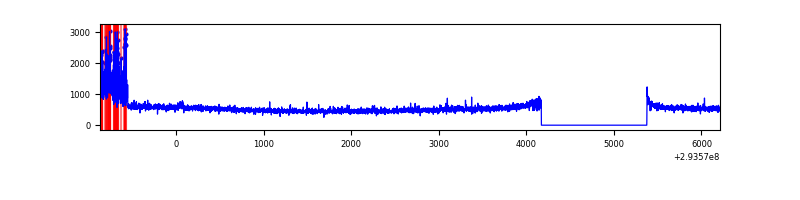 |
| D | 7080 | 5876 | 5 | 5 | 0.07% | 0.09% | 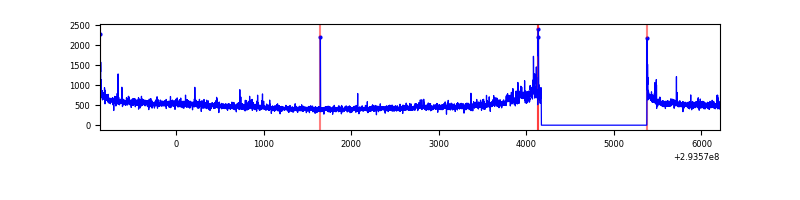 |
Top three noisy pixels from each quadrant. If the there are fewer than three noisy pixels in the level2.evt file, extra rows are filled as -1
| Pixel properties | Quadrant properties | ||||||
|---|---|---|---|---|---|---|---|
| Quadrant | DetID | PixID | Counts | Sigma | Mean | Median | Sigma |
| A | 4 | 2 | 15559 | 97.23 | 762 | 748 | 152.3 |
| A | 3 | 1 | 8509 | 50.95 | 762 | 748 | 152.3 |
| A | 13 | 254 | 8247 | 49.23 | 762 | 748 | 152.3 |
| B | 0 | 229 | 23257 | 156.3 | 768 | 751 | 144.0 |
| B | 0 | 230 | 22228 | 149.15 | 768 | 751 | 144.0 |
| B | 12 | 111 | 17438 | 115.89 | 768 | 751 | 144.0 |
| C | 3 | 247 | 290945 | 1672.9 | 747 | 754 | 173.5 |
| C | 14 | 238 | 117079 | 670.59 | 747 | 754 | 173.5 |
| C | 3 | 233 | 64120 | 365.29 | 747 | 754 | 173.5 |
| D | 1 | 52 | 123210 | 674.5 | 755 | 735 | 181.6 |
| D | 2 | 234 | 25206 | 134.77 | 755 | 735 | 181.6 |
| D | 12 | 221 | 9517 | 48.36 | 755 | 735 | 181.6 |
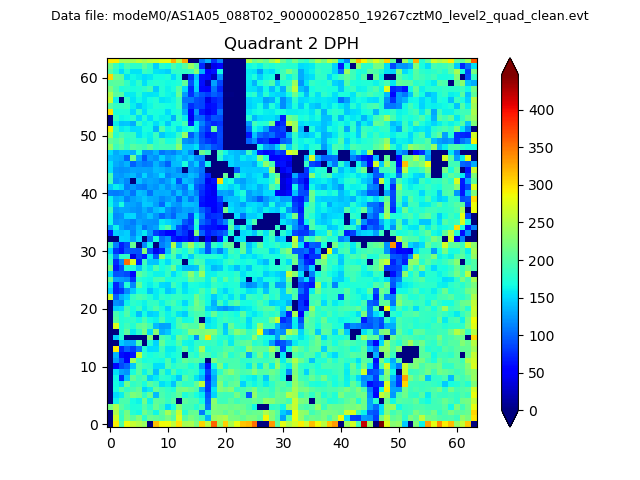
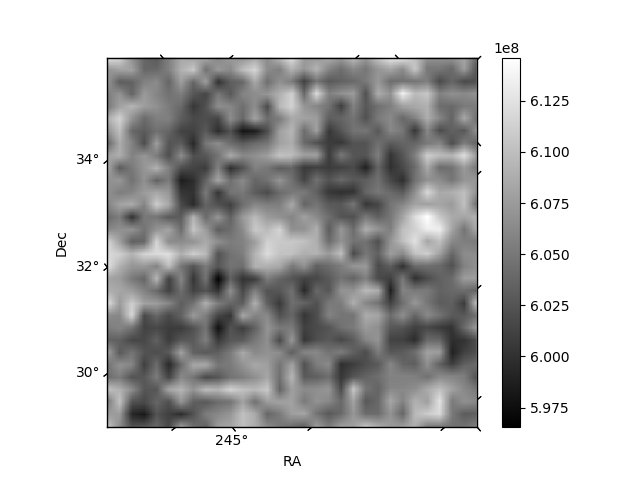
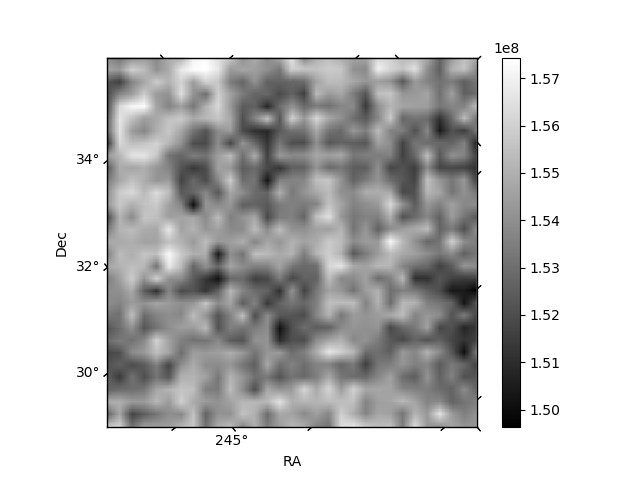
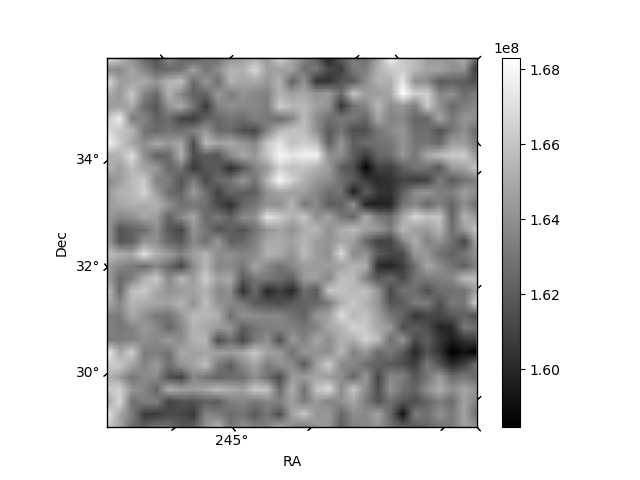
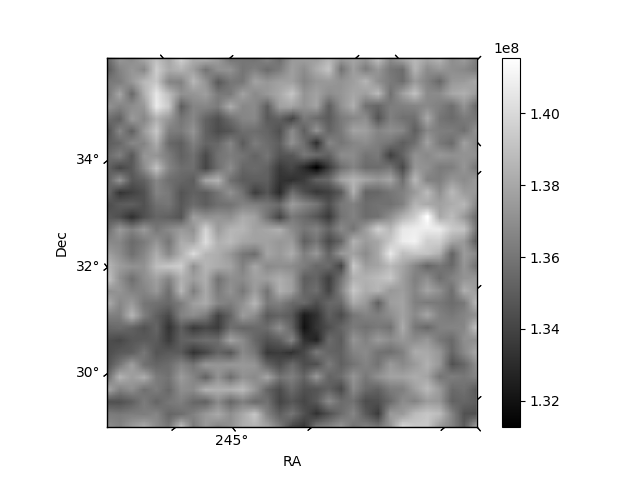
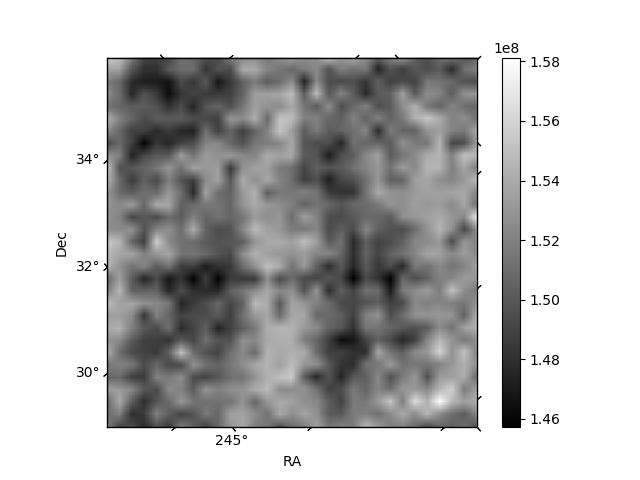
Histogram calculated using DETX and DETY for each event in the final _common_clean file
| Quadrant A | 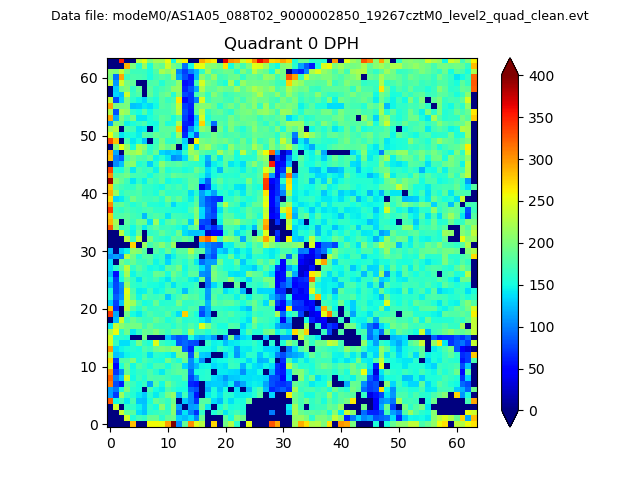 |
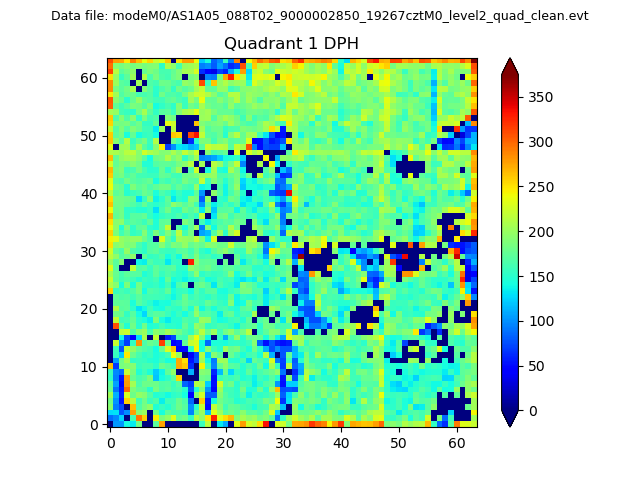 |
Quadrant B |
|---|---|---|---|
| Quadrant D | 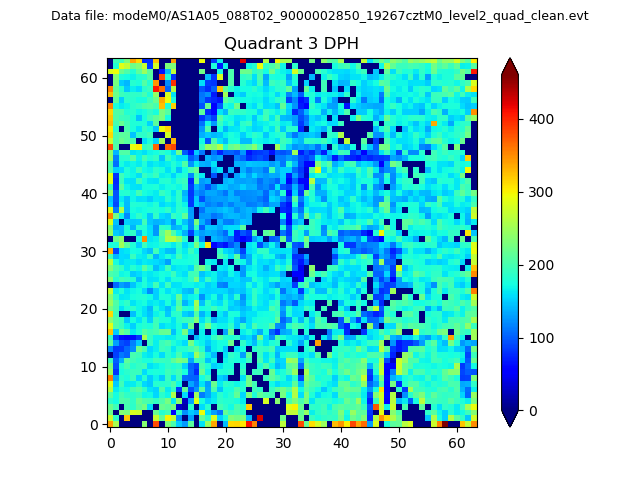 |
 |
Quadrant C |
| Plot type | Count rate plots | Images |
|---|---|---|
| Comparison with Poisson distribution Blue bars denote a histogram of data divided into 1 sec bins. Red curve is a Poisson curve with rate = median count rate of data. |
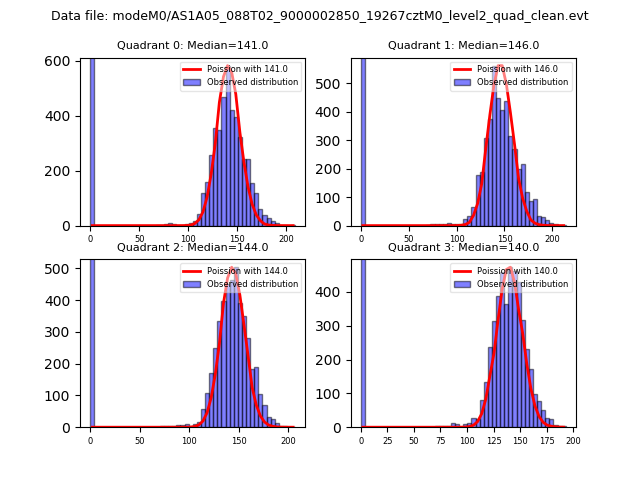 |
 |
| Quadrant-wise count rates Data is divided into 100 sec bins |
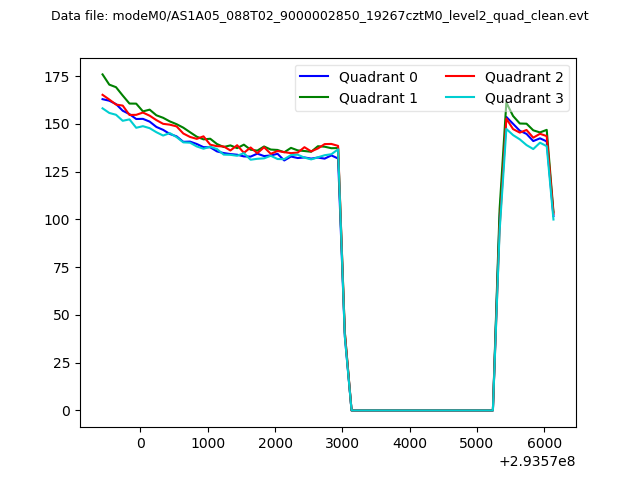 |
|
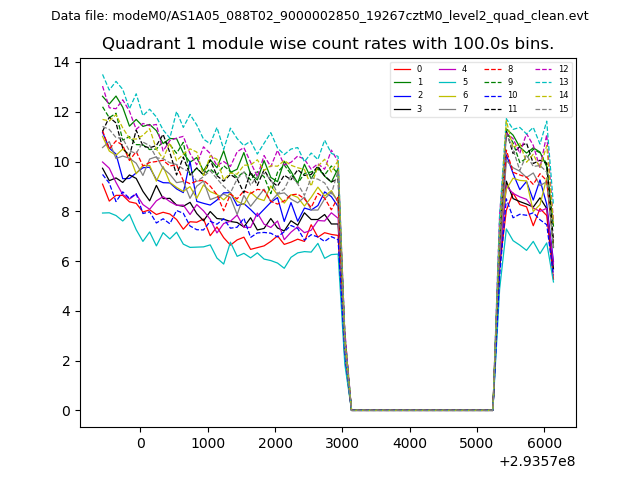
| Module-wise count rates for Quadrant A Data is divided into 100 sec bins |
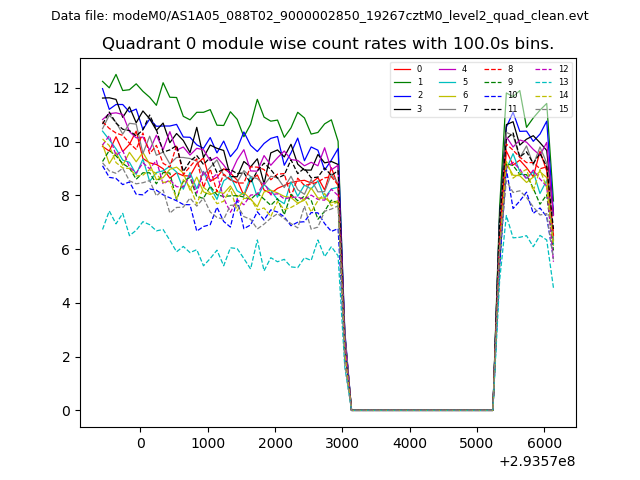 |
 |
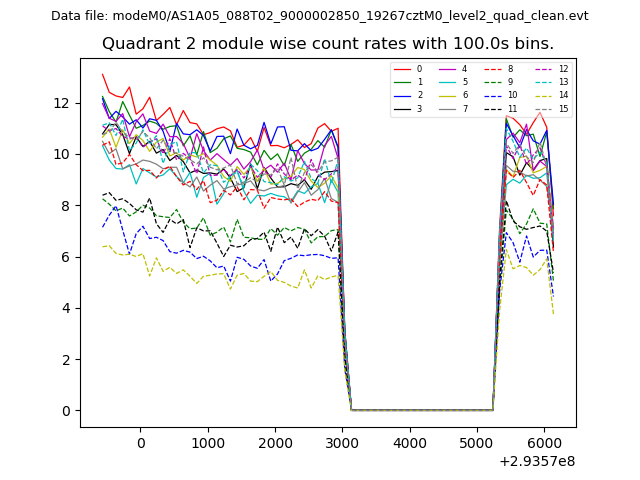
| Module-wise count rates for Quadrant B Data is divided into 100 sec bins |
 |
 |
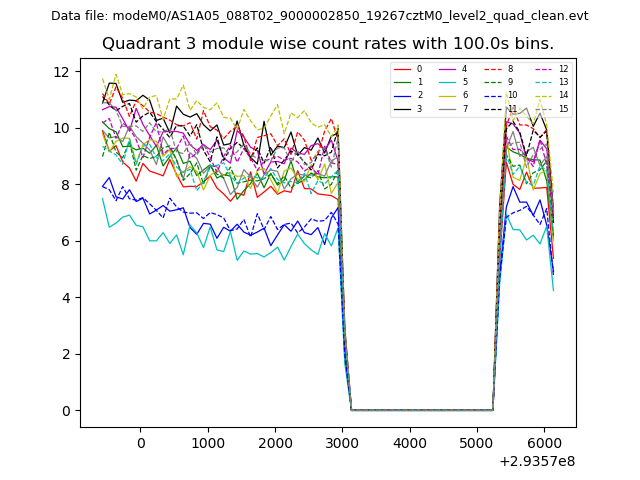
| Module-wise count rates for Quadrant C Data is divided into 100 sec bins |
 |
 |
| Module-wise count rates for Quadrant D Data is divided into 100 sec bins |
 |
 |
| Parameter | Plot |
|---|---|
| CZT HV Monitor | 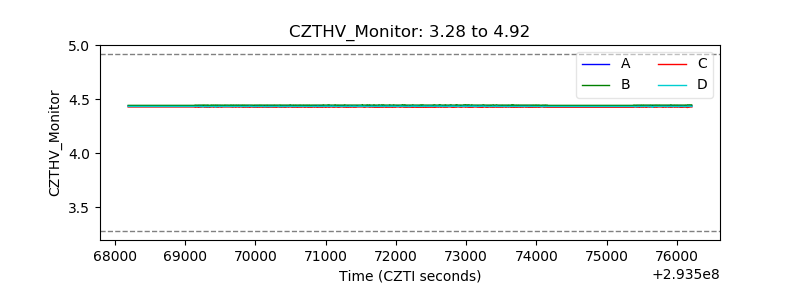 |
| D_VDD | 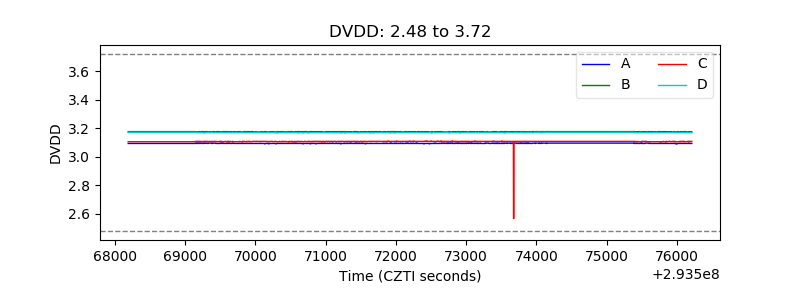 |
| Temperature 1 | 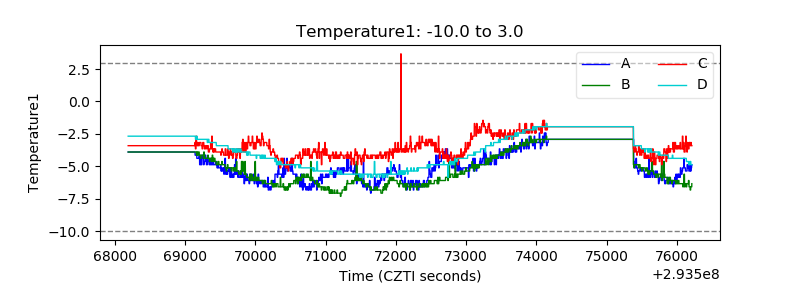 |
| Veto HV Monitor | 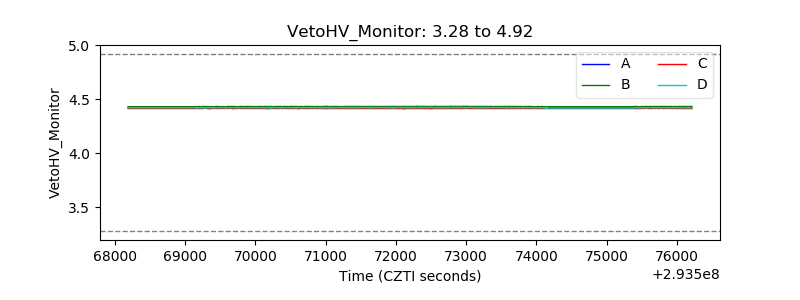 |
| Veto LLD | 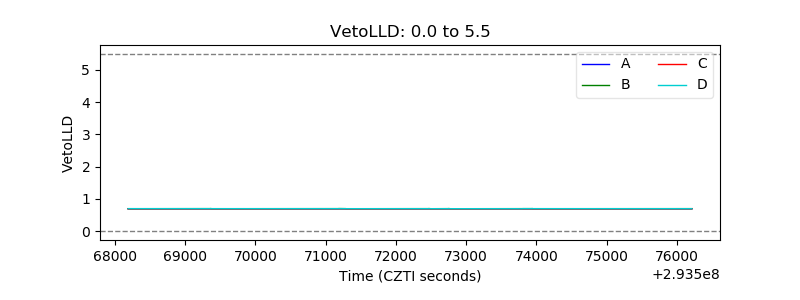 |
| Alpha Counter |  |
| _CPM_Rate | 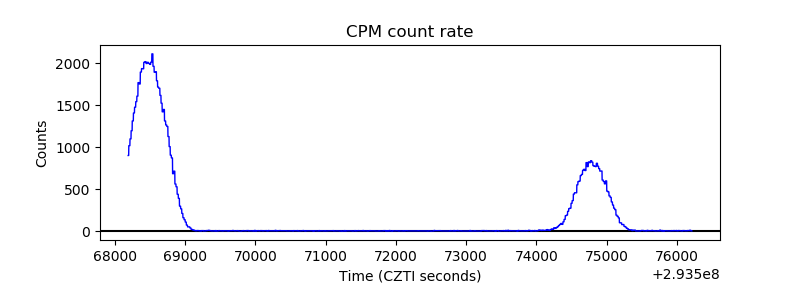 |
| CZT Counter | 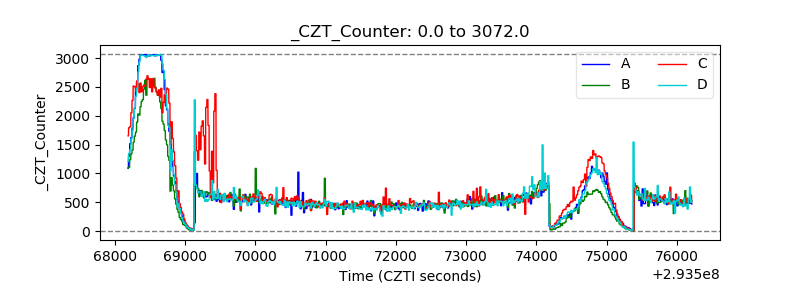 |
| +2.5 Volts monitor | 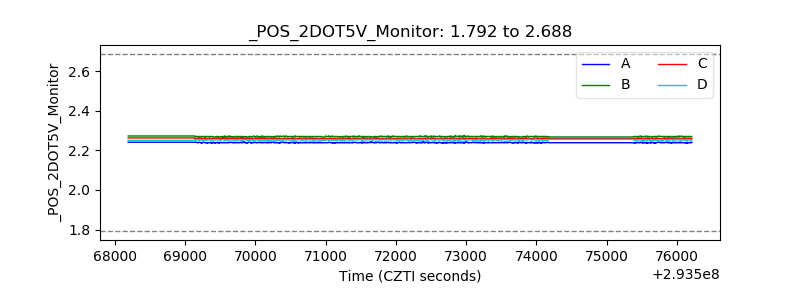 |
| +5 Volts monitor |  |
| _ROLL_ROT | 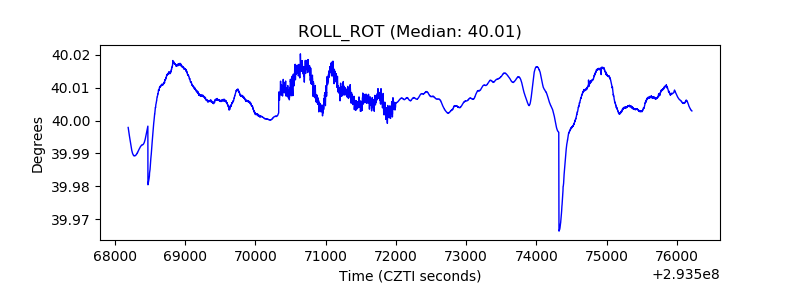 |
| _Roll_DEC |  |
| _Roll_RA | 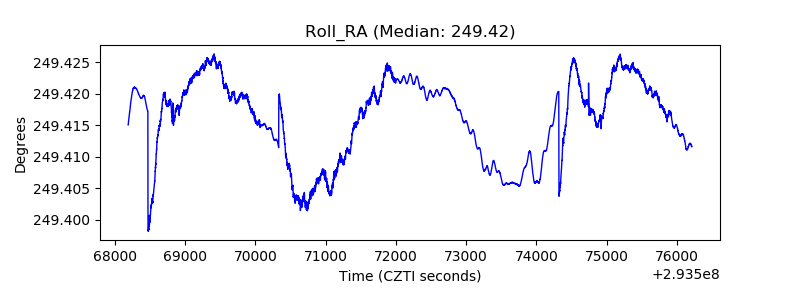 |
| Veto Counter | 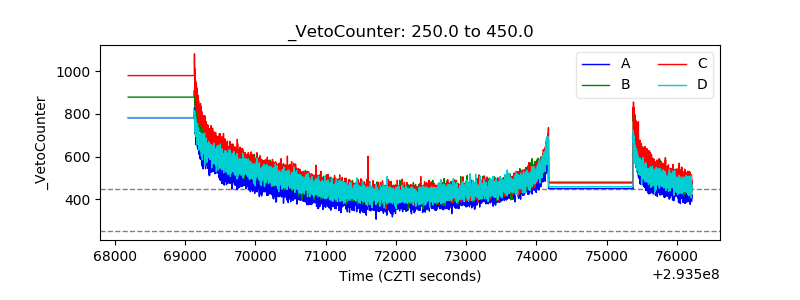 |