| Param | Original file | Final file |
|---|---|---|
| Filename | modeM0/AS1A05_088T02_9000002850_19268cztM0_level2.evt | modeM0/AS1A05_088T02_9000002850_19268cztM0_level2_quad_clean.evt |
| Size (bytes) | 107,006,400 | 19,480,320 |
| Size | 102.0 MB | 18.6 MB |
| Events in quadrant A | 754,311 | 122,106 |
| Events in quadrant B | 791,958 | 126,470 |
| Events in quadrant C | 780,106 | 122,224 |
| Events in quadrant D | 821,038 | 118,803 |
| Mode M0 | |||
|---|---|---|---|
| Quadrant | BADHDUFLAG | Total packets | Discarded packets |
| A | 0 | 3054 | 1 |
| B | 0 | 3196 | 1 |
| C | 0 | 3140 | 1 |
| D | 0 | 3269 | 1 |
| Mode SS | |||
|---|---|---|---|
| Quadrant | BADHDUFLAG | Total packets | Discarded packets |
| A | 0 | 30 | 0 |
| B | 0 | 30 | 0 |
| C | 0 | 30 | 0 |
| D | 0 | 30 | 0 |
| Mode M9 | |||
|---|---|---|---|
| Quadrant | BADHDUFLAG | Total packets | Discarded packets |
| A | 0 | 12 | 0 |
| B | 0 | 12 | 0 |
| C | 0 | 12 | 0 |
| D | 0 | 12 | 0 |
| Quadrant | Total seconds | Saturated seconds | Saturation percentage |
|---|---|---|---|
| A | 1325 | 32 | 2.415094% |
| B | 1326 | 67 | 5.052790% |
| C | 1326 | 84 | 6.334842% |
| D | 1326 | 55 | 4.147813% |
Noise dominated data is calculated using 1-second bins in cleaned event files. If a bin has >2000 counts, and if more than 50% of those come from <1% of pixels, then it is considered to be noise-dominated and hence unusable.
| Quadrant | # 1 sec bins | Bins with >0 counts | Bins with >2000 counts | High rate bins dominated by noise | Noise dominated (total time) | Noise dominated (detector-on time) | Marked lightcurve |
|---|---|---|---|---|---|---|---|
| A | 2530 | 1326 | 0 | 0 | 0.00% | 0.00% | 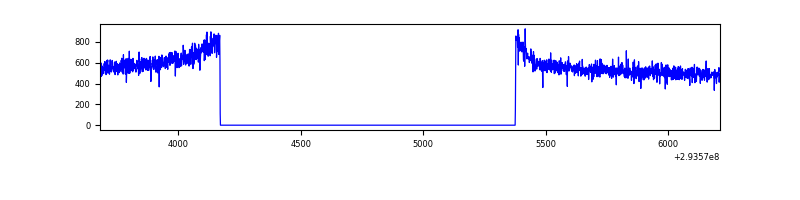 |
| B | 2531 | 1327 | 0 | 0 | 0.00% | 0.00% | 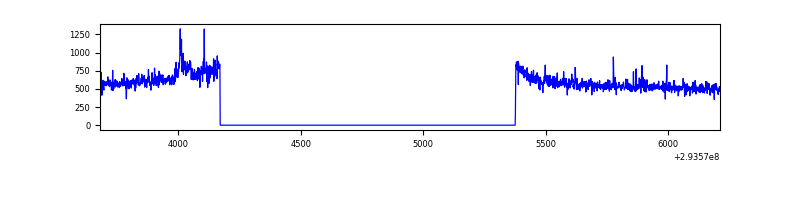 |
| C | 2531 | 1327 | 0 | 0 | 0.00% | 0.00% | 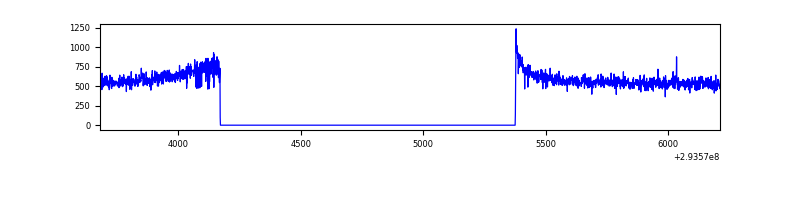 |
| D | 2531 | 1327 | 3 | 3 | 0.12% | 0.23% | 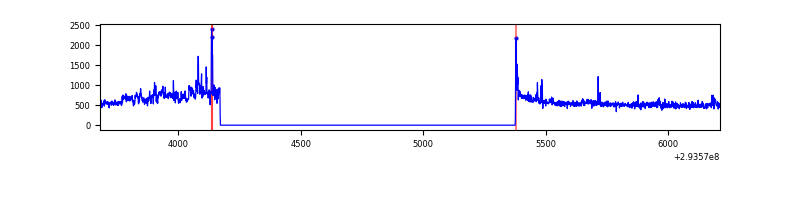 |
Top three noisy pixels from each quadrant. If the there are fewer than three noisy pixels in the level2.evt file, extra rows are filled as -1
| Pixel properties | Quadrant properties | ||||||
|---|---|---|---|---|---|---|---|
| Quadrant | DetID | PixID | Counts | Sigma | Mean | Median | Sigma |
| A | 11 | 29 | 2968 | 67.07 | 194 | 190 | 41.4 |
| A | 13 | 254 | 1870 | 40.56 | 194 | 190 | 41.4 |
| A | 0 | 226 | 1692 | 36.26 | 194 | 190 | 41.4 |
| B | 0 | 230 | 15161 | 380.94 | 195 | 190 | 39.3 |
| B | 0 | 229 | 4688 | 114.45 | 195 | 190 | 39.3 |
| B | 12 | 111 | 4663 | 113.82 | 195 | 190 | 39.3 |
| C | 14 | 238 | 29181 | 632.44 | 190 | 191 | 45.8 |
| C | 3 | 233 | 7226 | 153.47 | 190 | 191 | 45.8 |
| C | 3 | 247 | 1636 | 31.52 | 190 | 191 | 45.8 |
| D | 1 | 52 | 83834 | 1719.48 | 193 | 186 | 48.6 |
| D | 2 | 234 | 5425 | 107.69 | 193 | 186 | 48.6 |
| D | 13 | 138 | 5093 | 100.87 | 193 | 186 | 48.6 |
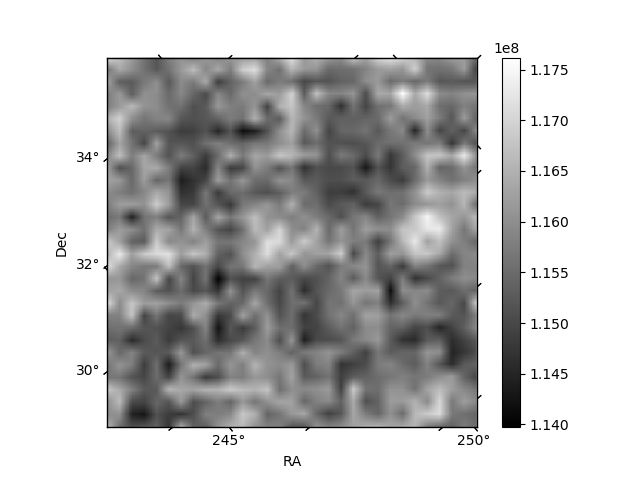
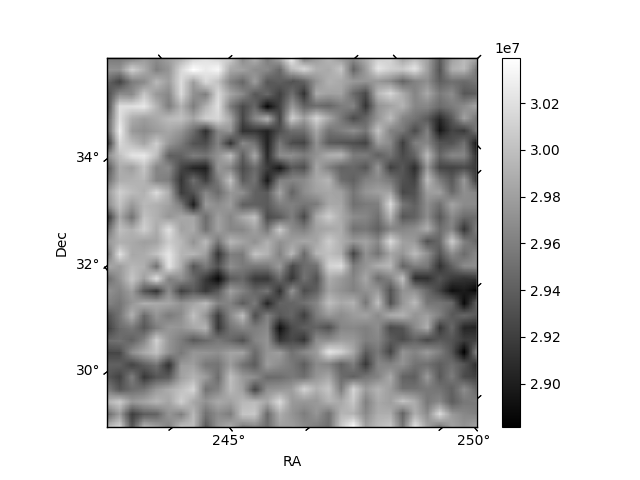
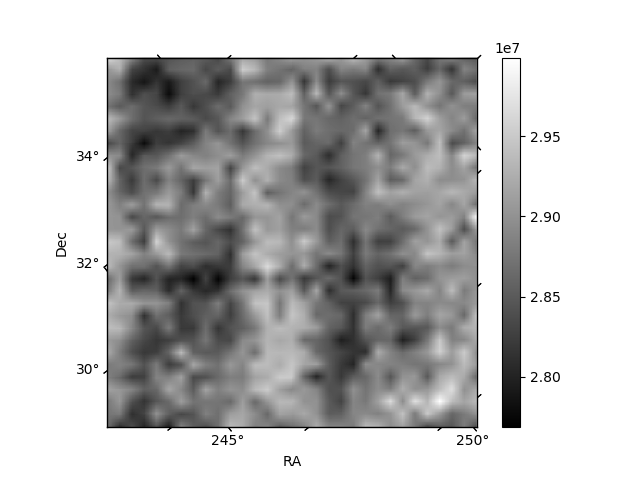
Histogram calculated using DETX and DETY for each event in the final _common_clean file
| Quadrant A | 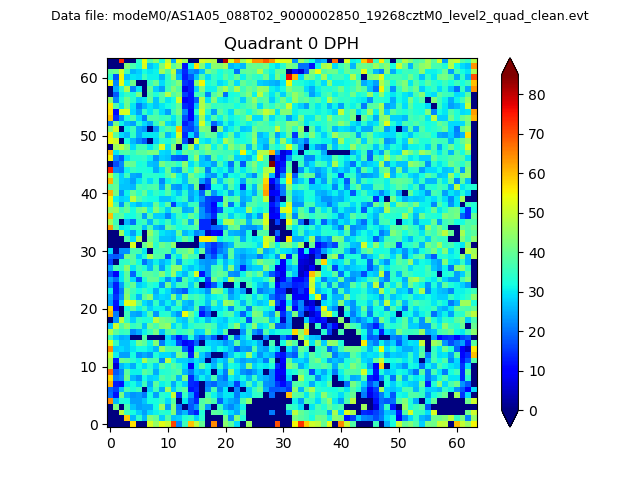 |
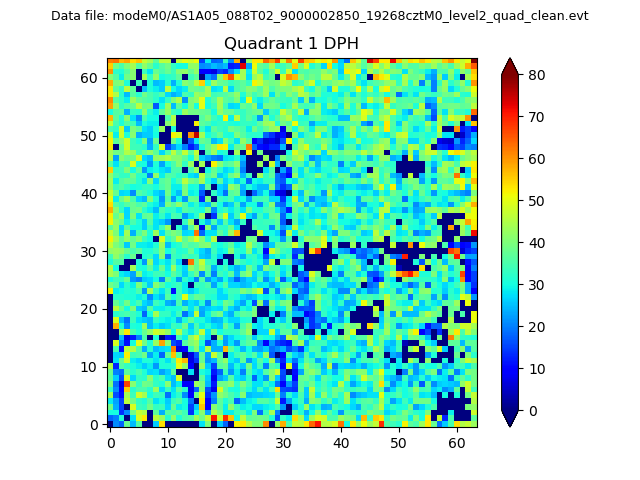 |
Quadrant B |
|---|---|---|---|
| Quadrant D | 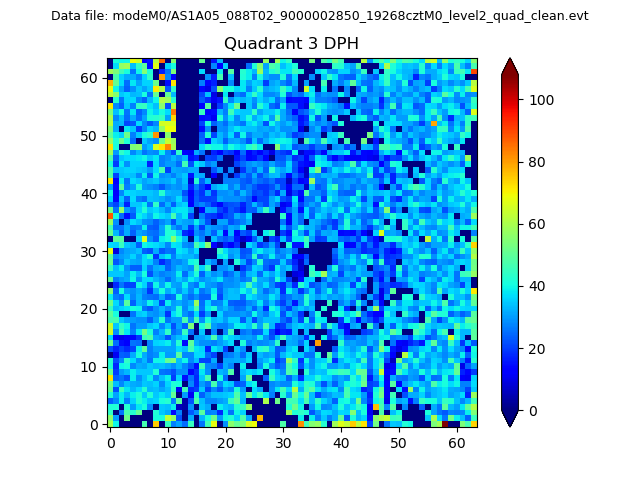 |
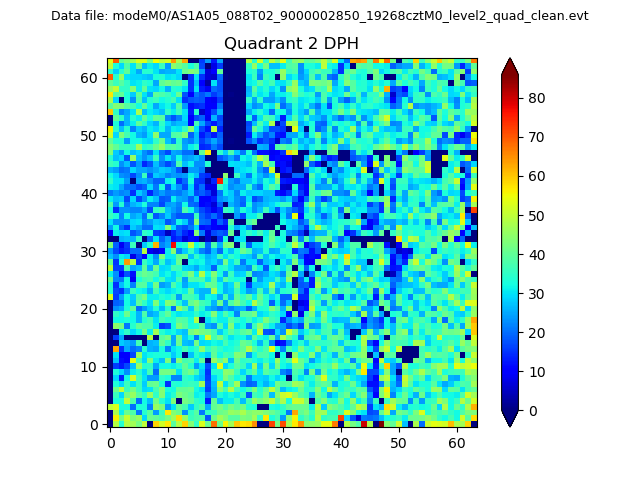 |
Quadrant C |
| Plot type | Count rate plots | Images |
|---|---|---|
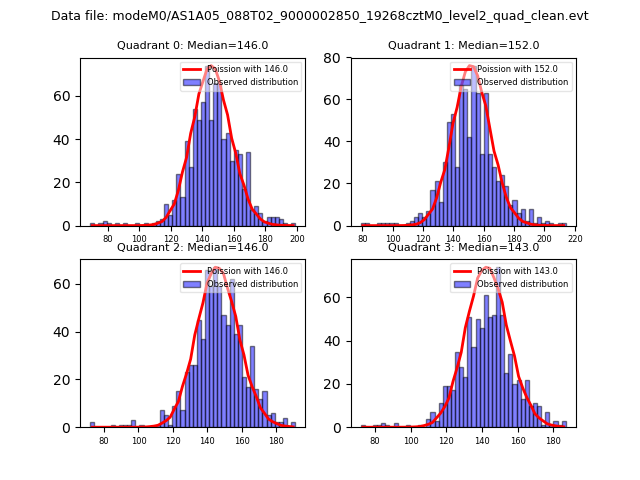
| Comparison with Poisson distribution Blue bars denote a histogram of data divided into 1 sec bins. Red curve is a Poisson curve with rate = median count rate of data. |
 |
 |
| Quadrant-wise count rates Data is divided into 100 sec bins |
 |
|
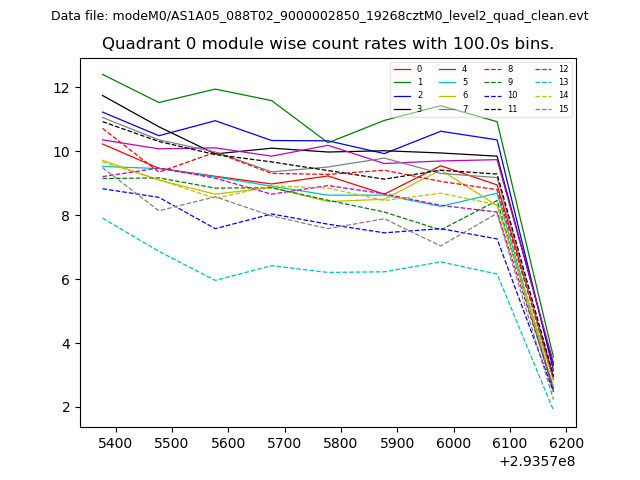
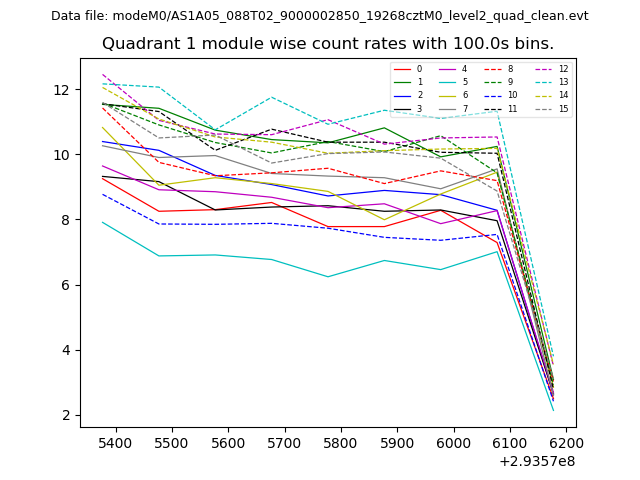
| Module-wise count rates for Quadrant A Data is divided into 100 sec bins |
 |
 |
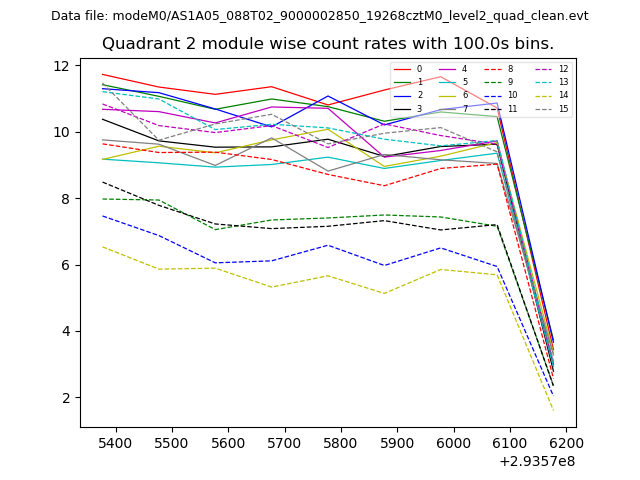
| Module-wise count rates for Quadrant B Data is divided into 100 sec bins |
 |
 |
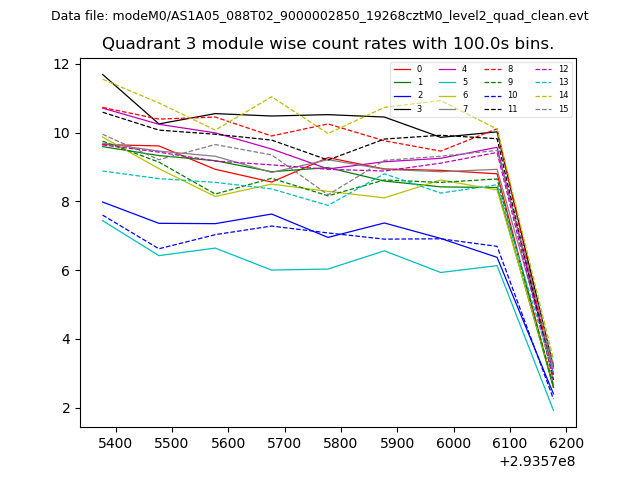
| Module-wise count rates for Quadrant C Data is divided into 100 sec bins |
 |
 |
| Module-wise count rates for Quadrant D Data is divided into 100 sec bins |
 |
 |
| Parameter | Plot |
|---|---|
| CZT HV Monitor | 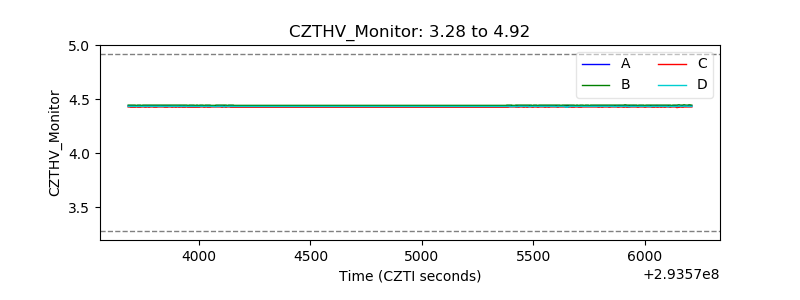 |
| D_VDD | 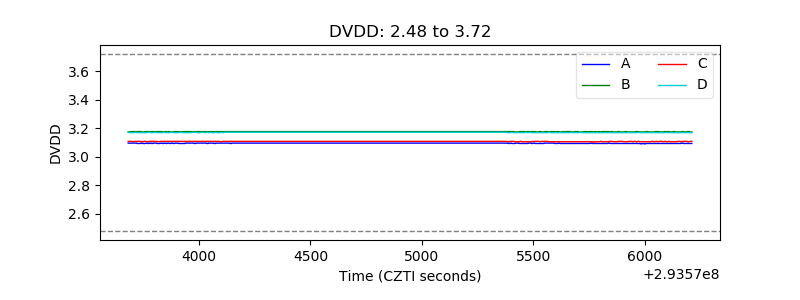 |
| Temperature 1 | 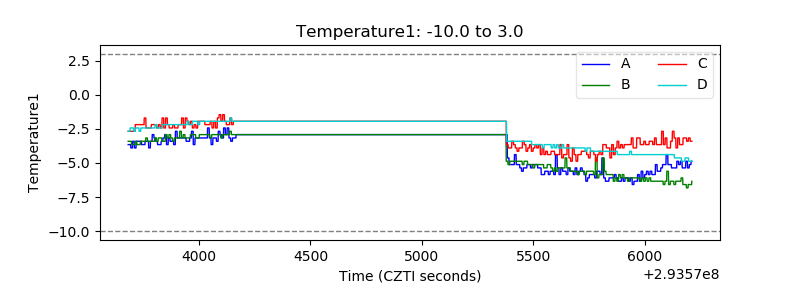 |
| Veto HV Monitor | 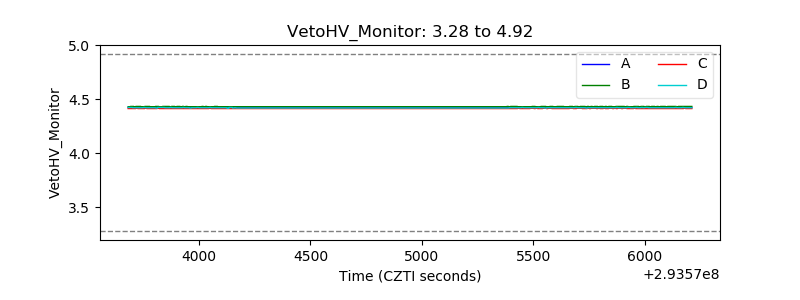 |
| Veto LLD | 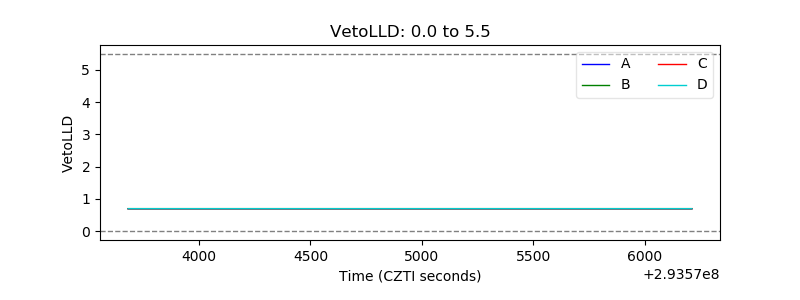 |
| Alpha Counter |  |
| _CPM_Rate | 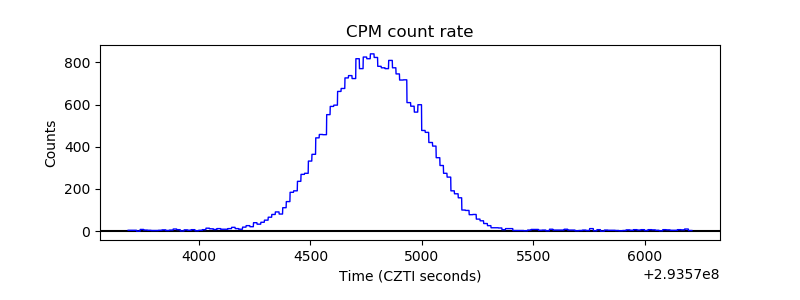 |
| CZT Counter | 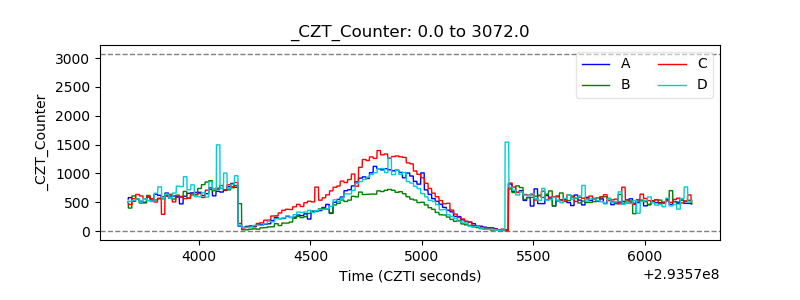 |
| +2.5 Volts monitor |  |
| +5 Volts monitor |  |
| _ROLL_ROT | 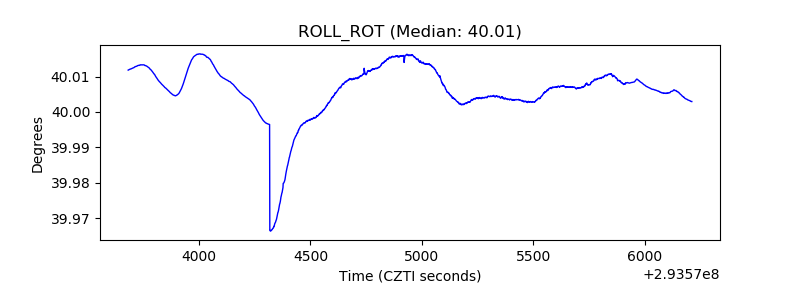 |
| _Roll_DEC | 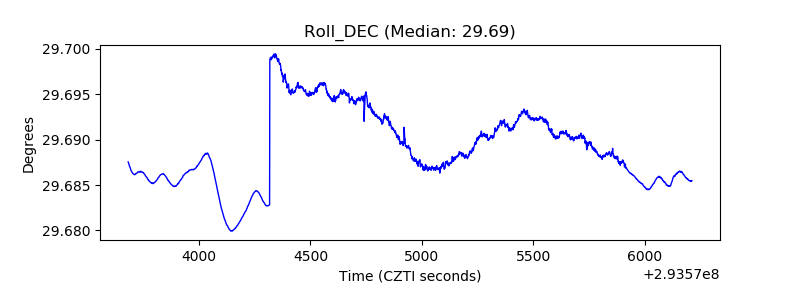 |
| _Roll_RA | 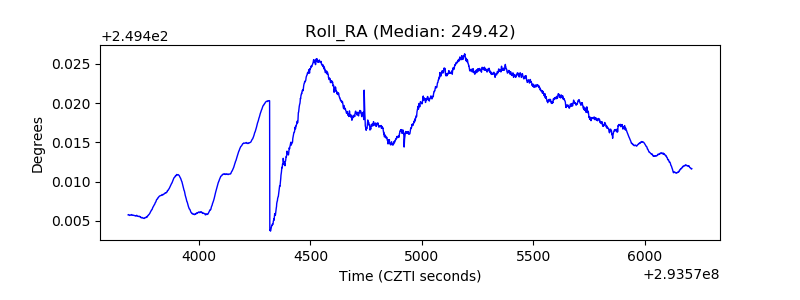 |
| Veto Counter | 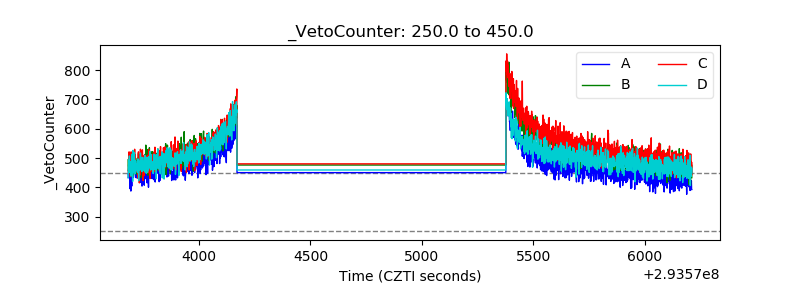 |