| Param | Original file | Final file |
|---|---|---|
| Filename | modeM0/AS1A05_107T01_9000002852cztM0_level2.fits | modeM0/AS1A05_107T01_9000002852cztM0_level2_quad_clean.evt |
| Size (bytes) | 969,719,040 | 875,928,960 |
| Size | 924.8 MB | 835.4 MB |
| Events in quadrant A | 5,939,536 | 5,107,642 |
| Events in quadrant B | 5,727,898 | 5,171,571 |
| Events in quadrant C | 5,911,540 | 5,031,201 |
| Events in quadrant D | 5,087,982 | 4,516,298 |
| Mode M0 | |||
|---|---|---|---|
| Quadrant | BADHDUFLAG | Total packets | Discarded packets |
| A | 0 | 205761 | 0 |
| B | 0 | 207314 | 0 |
| C | 0 | 207696 | 0 |
| D | 0 | 246396 | 0 |
| Mode SS | |||
|---|---|---|---|
| Quadrant | BADHDUFLAG | Total packets | Discarded packets |
| A | 0 | 1986 | 0 |
| B | 0 | 1986 | 0 |
| C | 0 | 1986 | 0 |
| D | 0 | 1986 | 0 |
| Mode M9 | |||
|---|---|---|---|
| Quadrant | BADHDUFLAG | Total packets | Discarded packets |
| A | 0 | 129 | 0 |
| B | 0 | 129 | 0 |
| C | 0 | 129 | 0 |
| D | 0 | 129 | 0 |
| Quadrant | Total seconds | Saturated seconds | Saturation percentage |
|---|---|---|---|
| A | 97766 | 1180 | 1.206964% |
| B | 97766 | 1495 | 1.529161% |
| C | 97766 | 1873 | 1.915799% |
| D | 97766 | 3876 | 3.964568% |
Noise dominated data is calculated using 1-second bins in cleaned event files. If a bin has >2000 counts, and if more than 50% of those come from <1% of pixels, then it is considered to be noise-dominated and hence unusable.
| Quadrant | # 1 sec bins | Bins with >0 counts | Bins with >2000 counts | High rate bins dominated by noise | Noise dominated (total time) | Noise dominated (detector-on time) | Marked lightcurve |
|---|---|---|---|---|---|---|---|
| A | 110546 | 97756 | 0 | 0 | 0.00% | 0.00% |  |
| B | 110546 | 97756 | 0 | 0 | 0.00% | 0.00% |  |
| C | 110546 | 97756 | 0 | 0 | 0.00% | 0.00% |  |
| D | 110546 | 97614 | 0 | 0 | 0.00% | 0.00% |  |
Top three noisy pixels from each quadrant. If the there are fewer than three noisy pixels in the level2.evt file, extra rows are filled as -1
| Pixel properties | Quadrant properties | ||||||
|---|---|---|---|---|---|---|---|
| Quadrant | DetID | PixID | Counts | Sigma | Mean | Median | Sigma |
| A | 0 | 29 | 5607 | 11.08 | 1546 | 1454 | 374.8 |
| A | 7 | 110 | 4659 | 8.55 | 1546 | 1454 | 374.8 |
| A | 9 | 19 | 4482 | 8.08 | 1546 | 1454 | 374.8 |
| B | 2 | 9 | 4654 | 10.81 | 1514 | 1441 | 297.3 |
| B | 2 | 8 | 3910 | 8.3 | 1514 | 1441 | 297.3 |
| B | 5 | 128 | 3792 | 7.91 | 1514 | 1441 | 297.3 |
| C | 1 | 80 | 4481 | 7.62 | 1559 | 1457 | 396.7 |
| C | 1 | 81 | 4450 | 7.54 | 1559 | 1457 | 396.7 |
| C | 12 | 241 | 4120 | 6.71 | 1559 | 1457 | 396.7 |
| D | 10 | 190 | 3778 | 6.52 | 1450 | 1325 | 376.1 |
| D | 3 | 14 | 3678 | 6.26 | 1450 | 1325 | 376.1 |
| D | 10 | 189 | 3609 | 6.07 | 1450 | 1325 | 376.1 |
Histogram calculated using DETX and DETY for each event in the final _common_clean file
| Quadrant A | 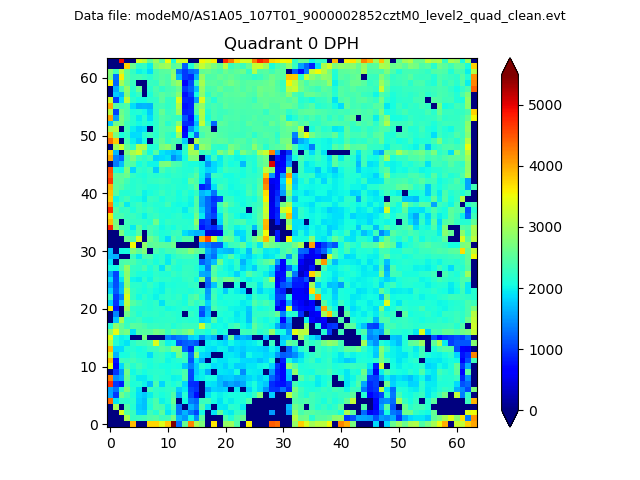 |
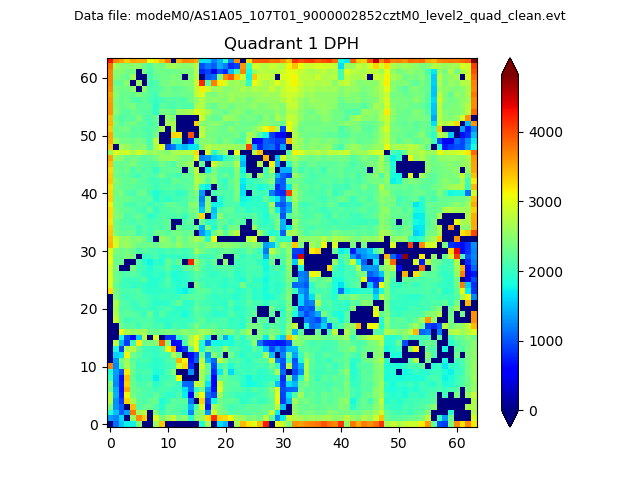 |
Quadrant B |
|---|---|---|---|
| Quadrant D |  |
 |
Quadrant C |
| Plot type | Count rate plots | Images |
|---|---|---|
| Comparison with Poisson distribution Blue bars denote a histogram of data divided into 1 sec bins. Red curve is a Poisson curve with rate = median count rate of data. |
 |
 |
| Quadrant-wise count rates Data is divided into 100 sec bins |
 |
|
| Module-wise count rates for Quadrant A Data is divided into 100 sec bins |
 |
 |
| Module-wise count rates for Quadrant B Data is divided into 100 sec bins |
 |
 |
| Module-wise count rates for Quadrant C Data is divided into 100 sec bins |
 |
 |
| Module-wise count rates for Quadrant D Data is divided into 100 sec bins |
 |
 |
| Parameter | Plot |
|---|---|
| CZT HV Monitor |  |
| D_VDD | 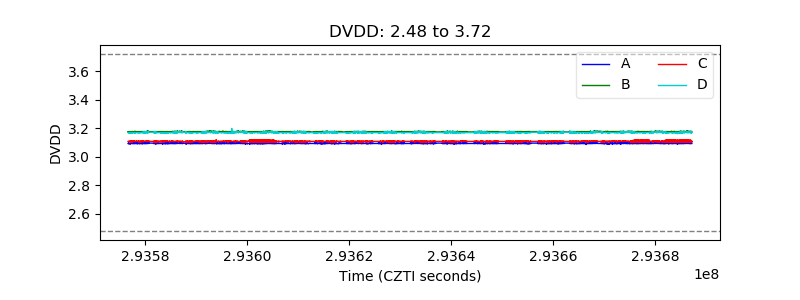 |
| Temperature 1 |  |
| Veto HV Monitor |  |
| Veto LLD |  |
| Alpha Counter |  |
| _CPM_Rate | 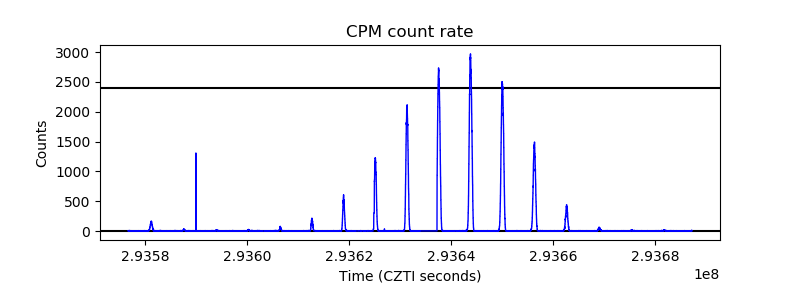 |
| CZT Counter |  |
| +2.5 Volts monitor |  |
| +5 Volts monitor | 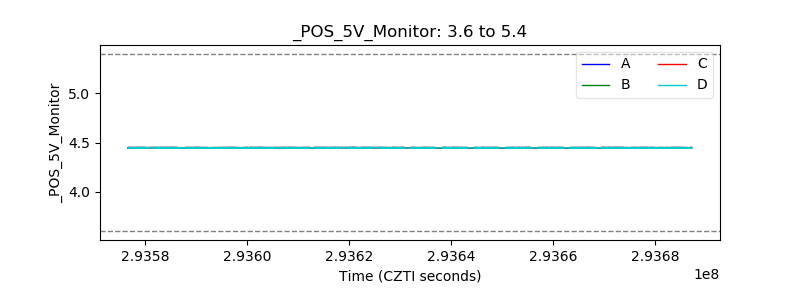 |
| _ROLL_ROT |  |
| _Roll_DEC |  |
| _Roll_RA |  |
| Veto Counter |  |