| Param | Original file | Final file |
|---|---|---|
| Filename | modeM0/AS1A05_107T01_9000002852_19268cztM0_level2.evt | modeM0/AS1A05_107T01_9000002852_19268cztM0_level2_quad_clean.evt |
| Size (bytes) | 393,045,120 | 76,930,560 |
| Size | 374.8 MB | 73.4 MB |
| Events in quadrant A | 2,563,327 | 485,461 |
| Events in quadrant B | 2,738,235 | 498,792 |
| Events in quadrant C | 2,690,924 | 493,698 |
| Events in quadrant D | 3,536,536 | 466,692 |
| Mode M0 | |||
|---|---|---|---|
| Quadrant | BADHDUFLAG | Total packets | Discarded packets |
| A | 0 | 11336 | 1 |
| B | 0 | 11745 | 1 |
| C | 0 | 11502 | 2 |
| D | 0 | 14452 | 1 |
| Mode SS | |||
|---|---|---|---|
| Quadrant | BADHDUFLAG | Total packets | Discarded packets |
| A | 0 | 112 | 0 |
| B | 0 | 112 | 0 |
| C | 0 | 112 | 0 |
| D | 0 | 112 | 0 |
| Mode M9 | |||
|---|---|---|---|
| Quadrant | BADHDUFLAG | Total packets | Discarded packets |
| A | 0 | 8 | 0 |
| B | 0 | 8 | 0 |
| C | 0 | 8 | 0 |
| D | 0 | 8 | 0 |
| Quadrant | Total seconds | Saturated seconds | Saturation percentage |
|---|---|---|---|
| A | 5500 | 24 | 0.436364% |
| B | 5500 | 78 | 1.418182% |
| C | 5499 | 77 | 1.400255% |
| D | 5499 | 352 | 6.401164% |
Noise dominated data is calculated using 1-second bins in cleaned event files. If a bin has >2000 counts, and if more than 50% of those come from <1% of pixels, then it is considered to be noise-dominated and hence unusable.
| Quadrant | # 1 sec bins | Bins with >0 counts | Bins with >2000 counts | High rate bins dominated by noise | Noise dominated (total time) | Noise dominated (detector-on time) | Marked lightcurve |
|---|---|---|---|---|---|---|---|
| A | 6335 | 5501 | 0 | 0 | 0.00% | 0.00% | 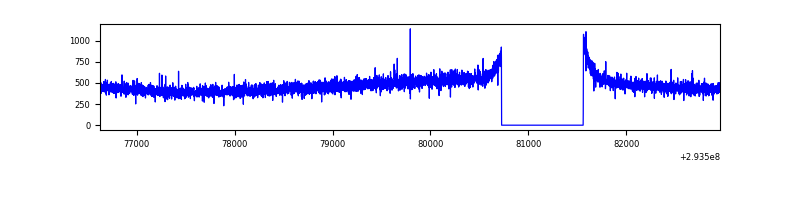 |
| B | 6335 | 5501 | 13 | 13 | 0.21% | 0.24% | 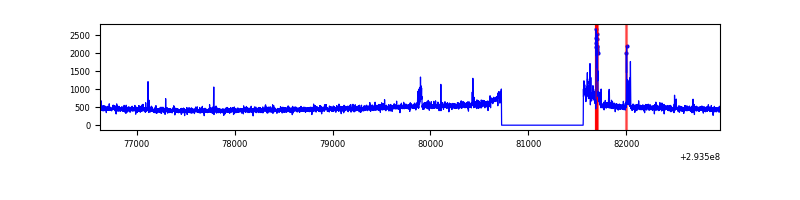 |
| C | 6334 | 5500 | 1 | 1 | 0.02% | 0.02% | 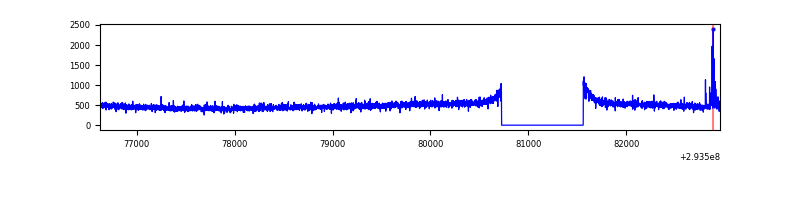 |
| D | 6334 | 5500 | 247 | 247 | 3.90% | 4.49% | 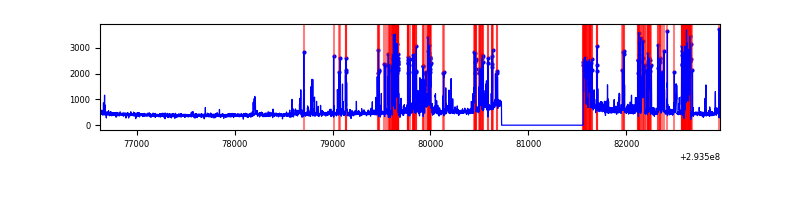 |
Top three noisy pixels from each quadrant. If the there are fewer than three noisy pixels in the level2.evt file, extra rows are filled as -1
| Pixel properties | Quadrant properties | ||||||
|---|---|---|---|---|---|---|---|
| Quadrant | DetID | PixID | Counts | Sigma | Mean | Median | Sigma |
| A | 13 | 254 | 8585 | 58.82 | 664 | 649 | 134.9 |
| A | 0 | 226 | 5852 | 38.56 | 664 | 649 | 134.9 |
| A | 3 | 137 | 5365 | 34.95 | 664 | 649 | 134.9 |
| B | 10 | 244 | 51503 | 403.15 | 665 | 648 | 126.1 |
| B | 0 | 230 | 39235 | 305.89 | 665 | 648 | 126.1 |
| B | 12 | 111 | 15537 | 118.03 | 665 | 648 | 126.1 |
| C | 14 | 238 | 100971 | 660.28 | 648 | 655 | 151.9 |
| C | 3 | 233 | 30527 | 196.62 | 648 | 655 | 151.9 |
| C | 9 | 54 | 24788 | 158.84 | 648 | 655 | 151.9 |
| D | 7 | 238 | 904425 | 5940.91 | 629 | 612 | 152.1 |
| D | 1 | 52 | 215556 | 1412.86 | 629 | 612 | 152.1 |
| D | 2 | 234 | 21586 | 137.87 | 629 | 612 | 152.1 |
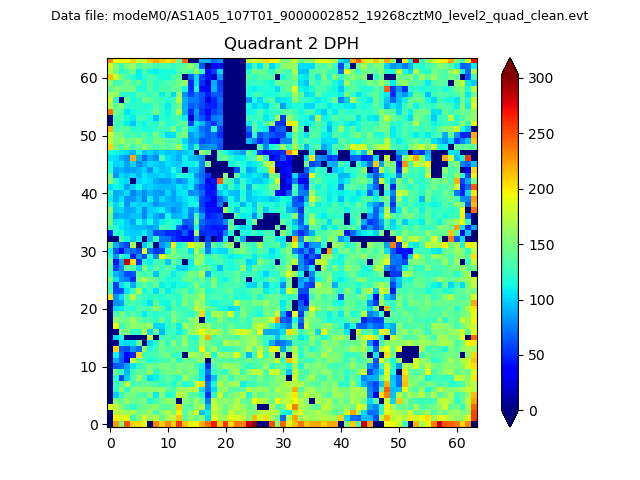
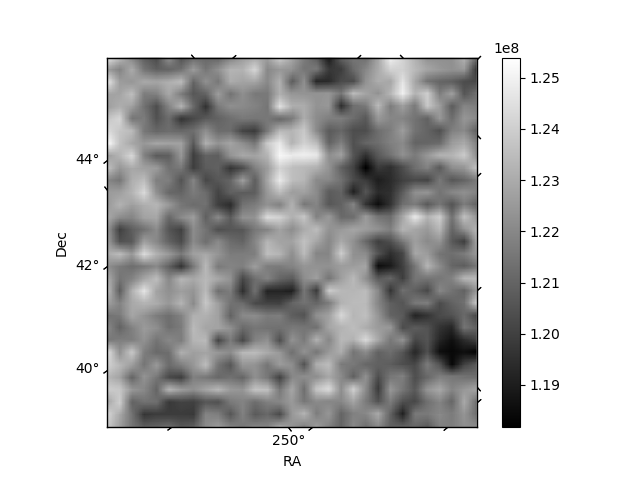
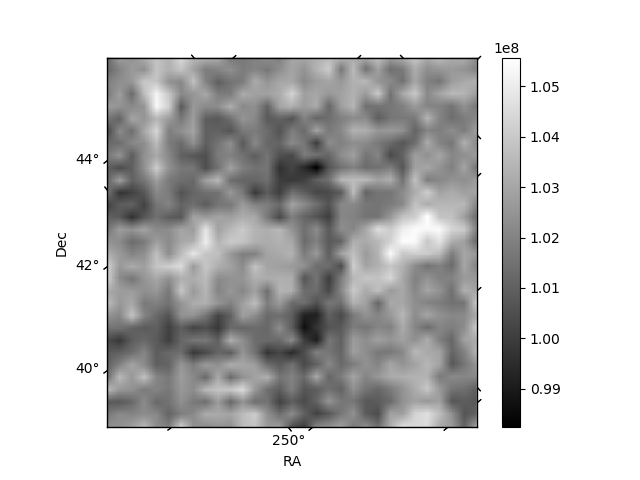
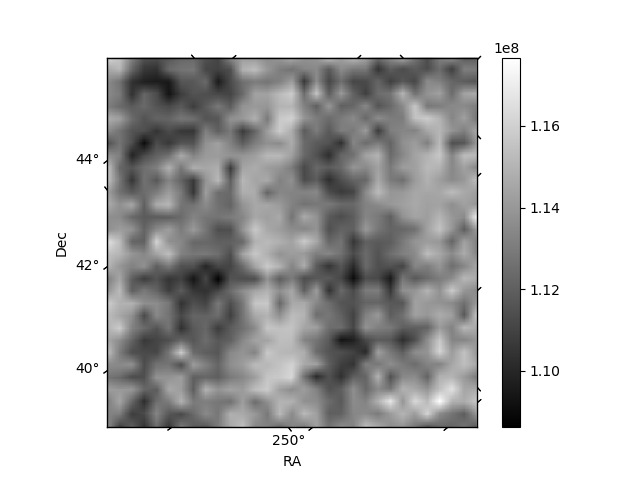
Histogram calculated using DETX and DETY for each event in the final _common_clean file
| Quadrant A | 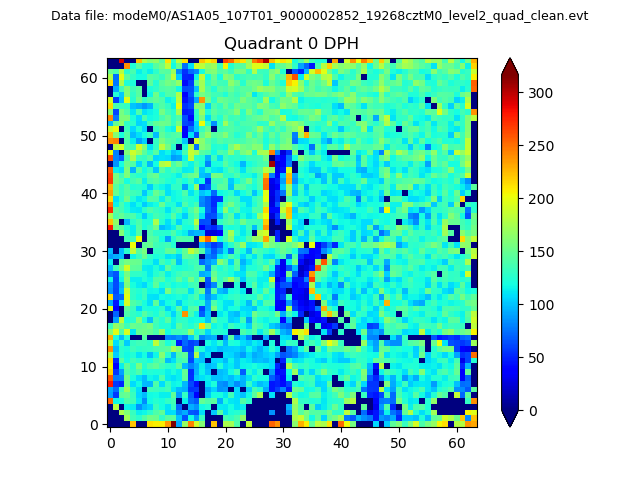 |
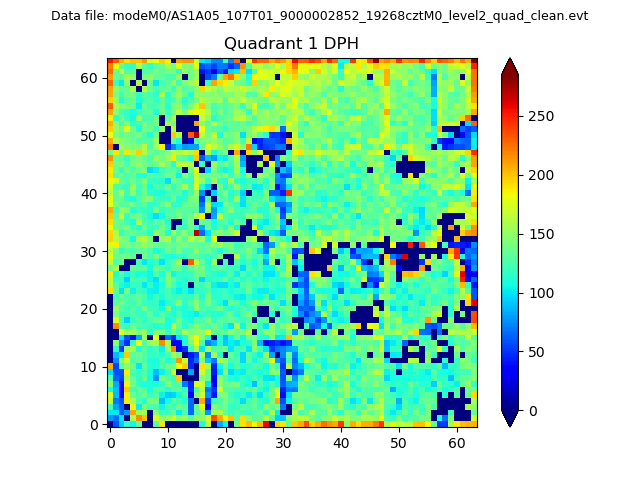 |
Quadrant B |
|---|---|---|---|
| Quadrant D | 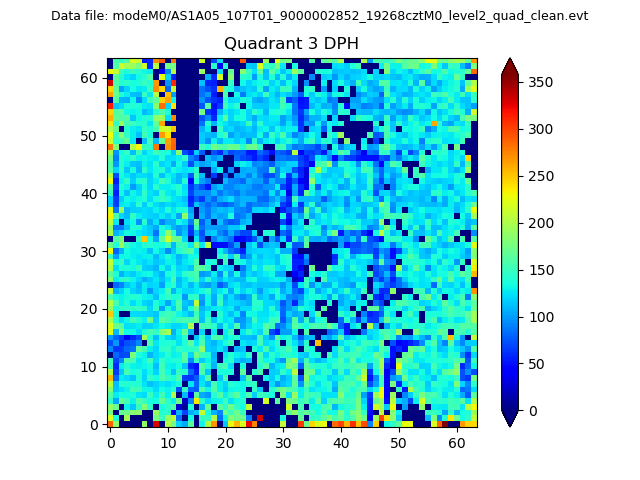 |
 |
Quadrant C |
| Plot type | Count rate plots | Images |
|---|---|---|
| Comparison with Poisson distribution Blue bars denote a histogram of data divided into 1 sec bins. Red curve is a Poisson curve with rate = median count rate of data. |
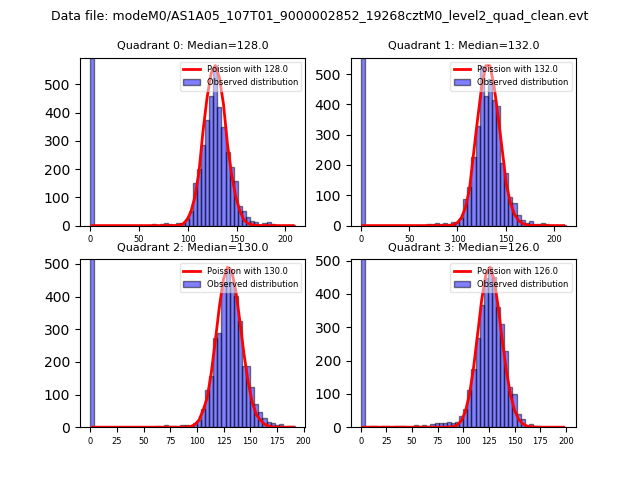 |
 |
| Quadrant-wise count rates Data is divided into 100 sec bins |
 |
|
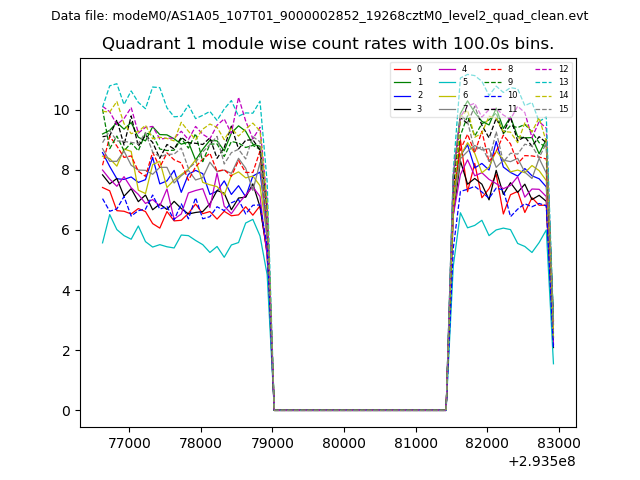
| Module-wise count rates for Quadrant A Data is divided into 100 sec bins |
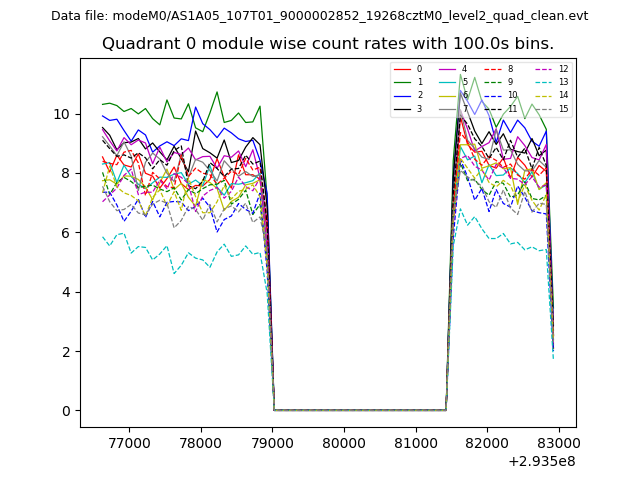 |
 |
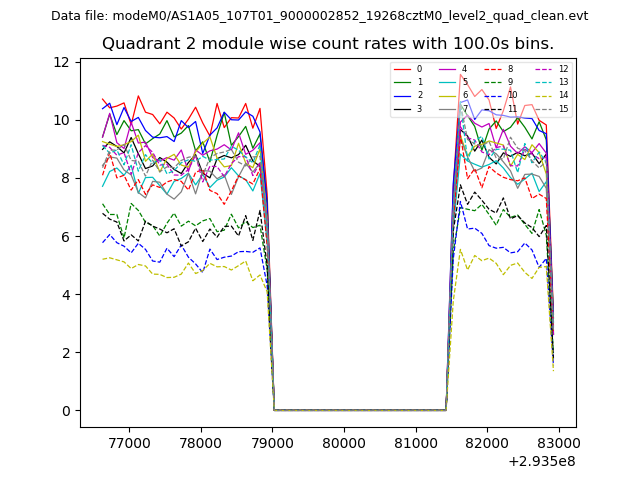
| Module-wise count rates for Quadrant B Data is divided into 100 sec bins |
 |
 |
| Module-wise count rates for Quadrant C Data is divided into 100 sec bins |
 |
 |
| Module-wise count rates for Quadrant D Data is divided into 100 sec bins |
 |
 |
| Parameter | Plot |
|---|---|
| CZT HV Monitor | 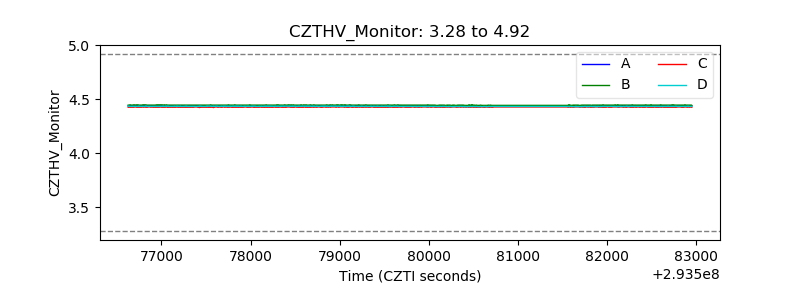 |
| D_VDD | 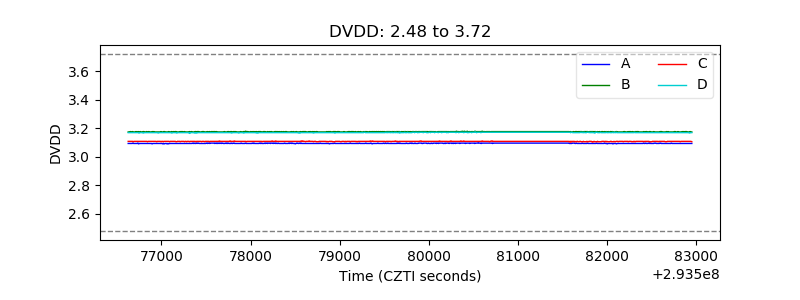 |
| Temperature 1 | 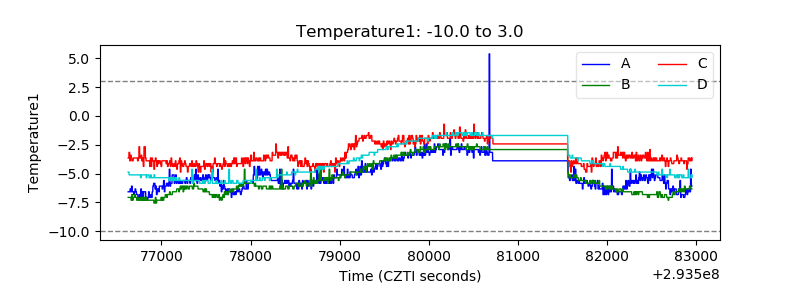 |
| Veto HV Monitor | 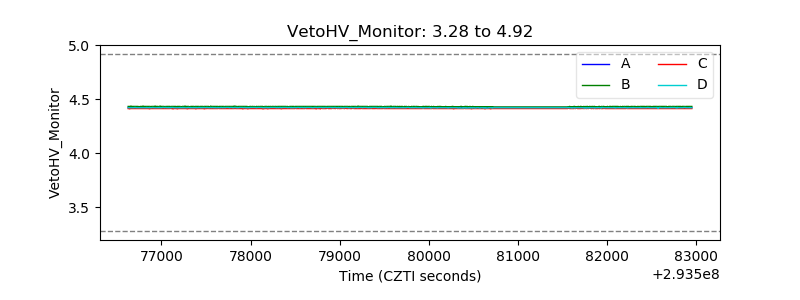 |
| Veto LLD | 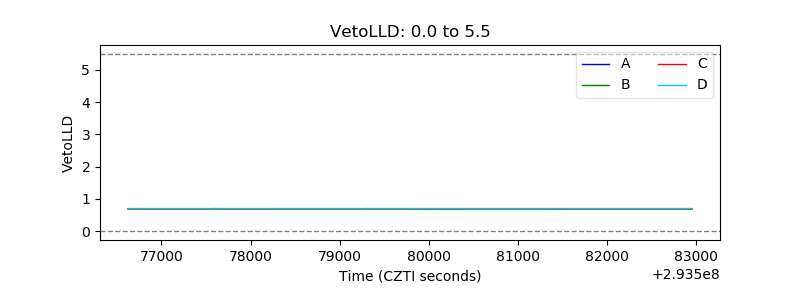 |
| Alpha Counter |  |
| _CPM_Rate | 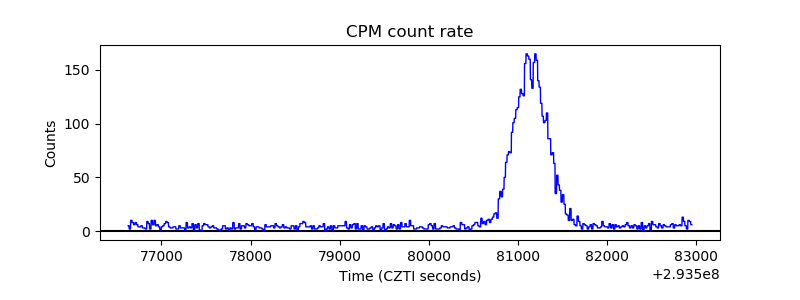 |
| CZT Counter | 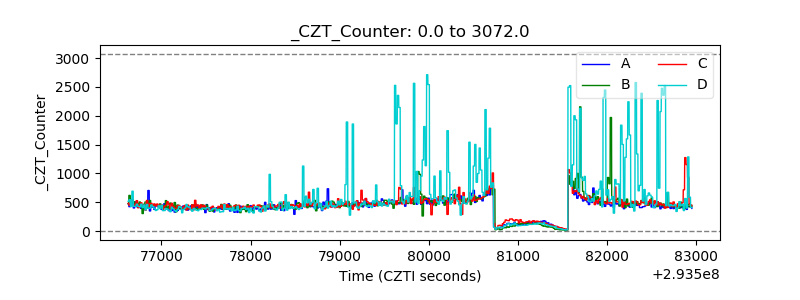 |
| +2.5 Volts monitor |  |
| +5 Volts monitor |  |
| _ROLL_ROT | 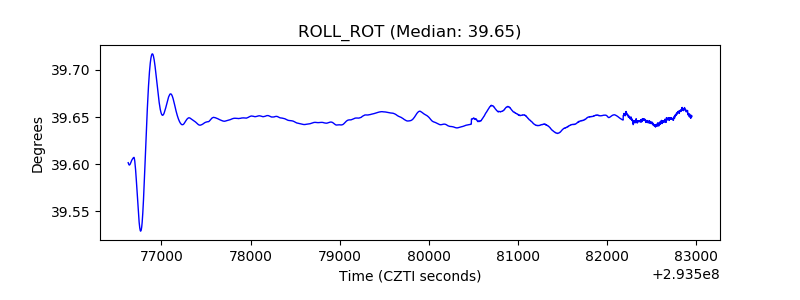 |
| _Roll_DEC |  |
| _Roll_RA | 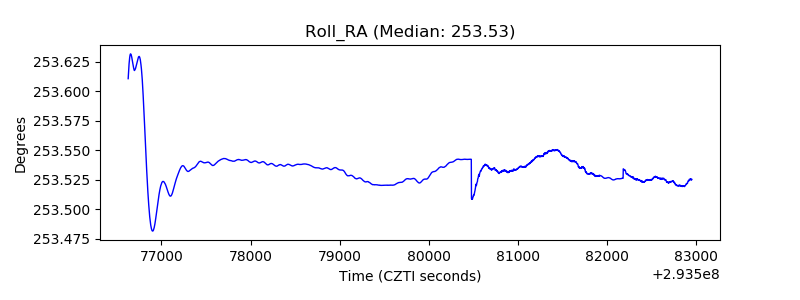 |
| Veto Counter | 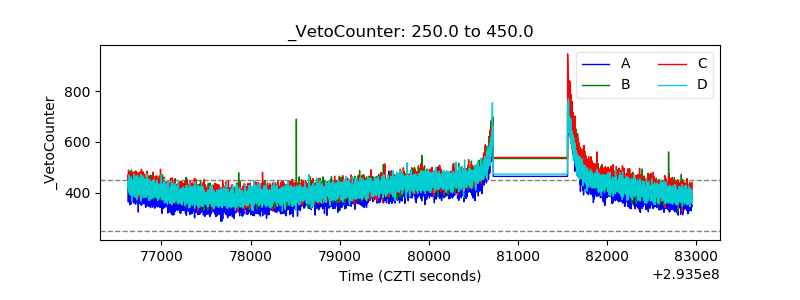 |