| Param | Original file | Final file |
|---|---|---|
| Filename | modeM0/AS1A05_107T01_9000002852_19273cztM0_level2.evt | modeM0/AS1A05_107T01_9000002852_19273cztM0_level2_quad_clean.evt |
| Size (bytes) | 804,916,800 | 145,226,880 |
| Size | 767.6 MB | 138.5 MB |
| Events in quadrant A | 5,450,699 | 900,699 |
| Events in quadrant B | 5,430,465 | 923,011 |
| Events in quadrant C | 5,427,909 | 902,825 |
| Events in quadrant D | 7,289,413 | 876,211 |
| Mode M0 | |||
|---|---|---|---|
| Quadrant | BADHDUFLAG | Total packets | Discarded packets |
| A | 0 | 23791 | 2 |
| B | 0 | 23558 | 2 |
| C | 0 | 23565 | 2 |
| D | 0 | 29544 | 2 |
| Mode SS | |||
|---|---|---|---|
| Quadrant | BADHDUFLAG | Total packets | Discarded packets |
| A | 0 | 234 | 0 |
| B | 0 | 234 | 0 |
| C | 0 | 234 | 0 |
| D | 0 | 234 | 0 |
| Mode M9 | |||
|---|---|---|---|
| Quadrant | BADHDUFLAG | Total packets | Discarded packets |
| A | 0 | 12 | 0 |
| B | 0 | 13 | 0 |
| C | 0 | 13 | 0 |
| D | 0 | 13 | 0 |
| Quadrant | Total seconds | Saturated seconds | Saturation percentage |
|---|---|---|---|
| A | 11496 | 126 | 1.096033% |
| B | 11496 | 121 | 1.052540% |
| C | 11496 | 140 | 1.217815% |
| D | 11496 | 269 | 2.339944% |
Noise dominated data is calculated using 1-second bins in cleaned event files. If a bin has >2000 counts, and if more than 50% of those come from <1% of pixels, then it is considered to be noise-dominated and hence unusable.
| Quadrant | # 1 sec bins | Bins with >0 counts | Bins with >2000 counts | High rate bins dominated by noise | Noise dominated (total time) | Noise dominated (detector-on time) | Marked lightcurve |
|---|---|---|---|---|---|---|---|
| A | 11995 | 11495 | 9 | 9 | 0.08% | 0.08% | 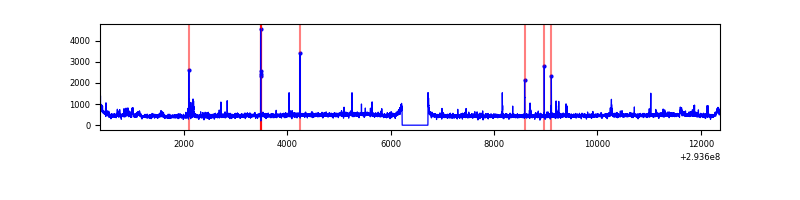 |
| B | 11995 | 11496 | 0 | 0 | 0.00% | 0.00% | 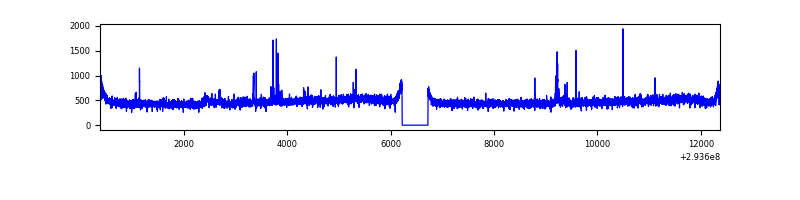 |
| C | 11995 | 11496 | 0 | 0 | 0.00% | 0.00% | 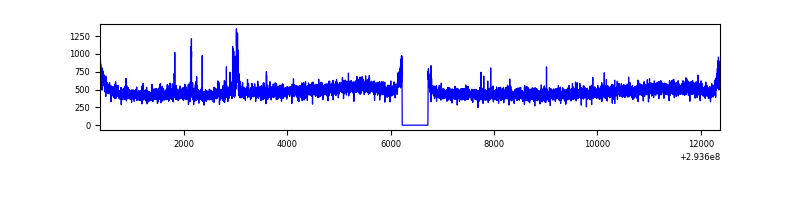 |
| D | 11995 | 11496 | 168 | 168 | 1.40% | 1.46% | 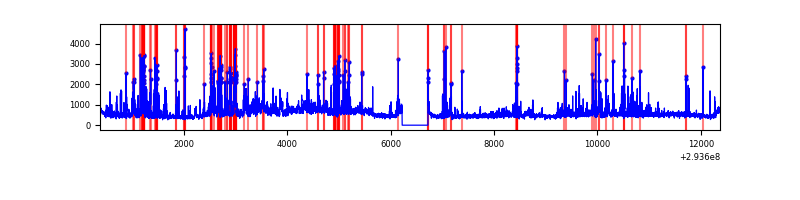 |
Top three noisy pixels from each quadrant. If the there are fewer than three noisy pixels in the level2.evt file, extra rows are filled as -1
| Pixel properties | Quadrant properties | ||||||
|---|---|---|---|---|---|---|---|
| Quadrant | DetID | PixID | Counts | Sigma | Mean | Median | Sigma |
| A | 4 | 2 | 127655 | 464.47 | 1350 | 1317 | 272.0 |
| A | 9 | 143 | 61553 | 221.45 | 1350 | 1317 | 272.0 |
| A | 12 | 96 | 37792 | 134.1 | 1350 | 1317 | 272.0 |
| B | 0 | 229 | 40643 | 151.85 | 1353 | 1318 | 259.0 |
| B | 0 | 230 | 35710 | 132.8 | 1353 | 1318 | 259.0 |
| B | 12 | 111 | 32667 | 121.05 | 1353 | 1318 | 259.0 |
| C | 14 | 238 | 204505 | 664.35 | 1308 | 1314 | 305.9 |
| C | 3 | 233 | 99051 | 319.56 | 1308 | 1314 | 305.9 |
| C | 8 | 128 | 13207 | 38.88 | 1308 | 1314 | 305.9 |
| D | 1 | 52 | 1181499 | 3696.0 | 1315 | 1276 | 319.3 |
| D | 7 | 238 | 470243 | 1468.62 | 1315 | 1276 | 319.3 |
| D | 12 | 218 | 464578 | 1450.88 | 1315 | 1276 | 319.3 |
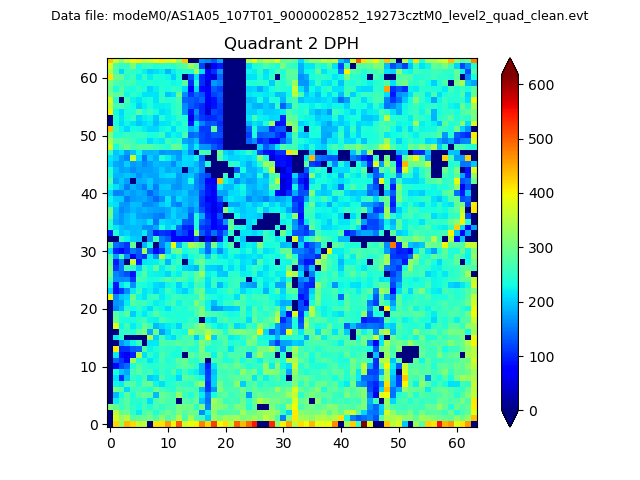
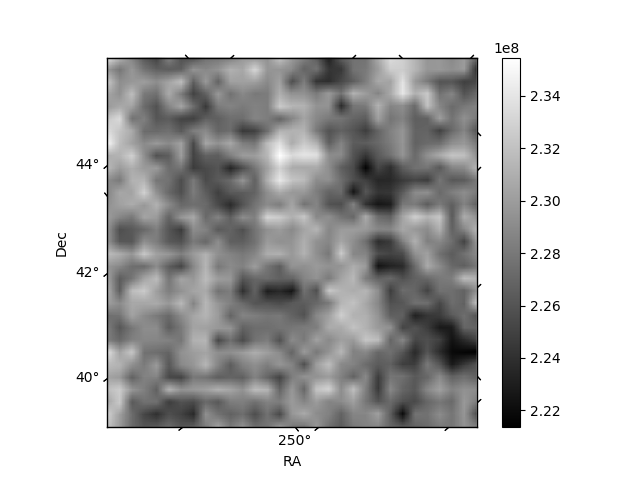
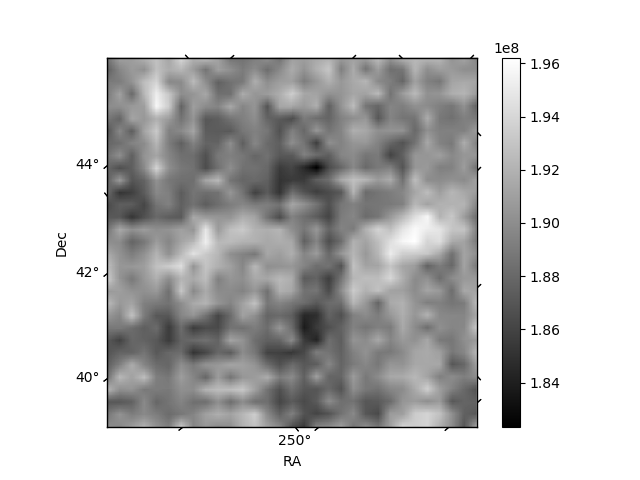
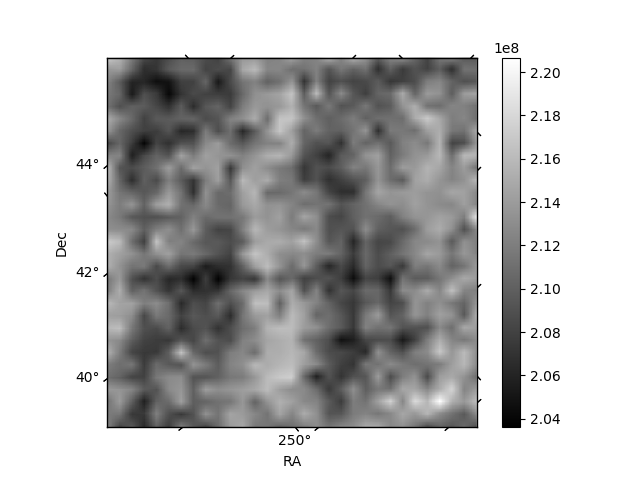
Histogram calculated using DETX and DETY for each event in the final _common_clean file
| Quadrant A | 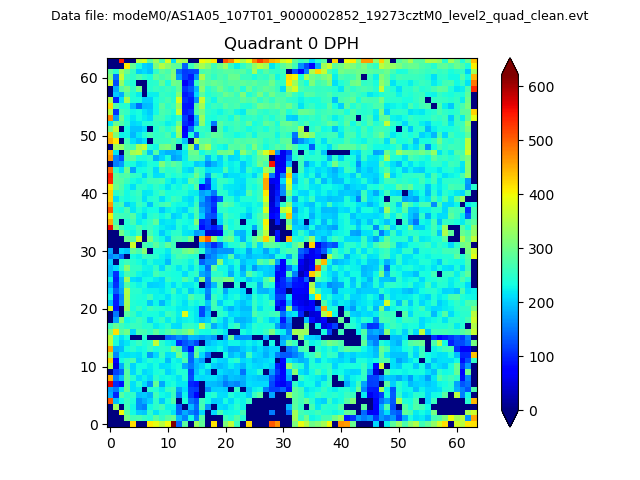 |
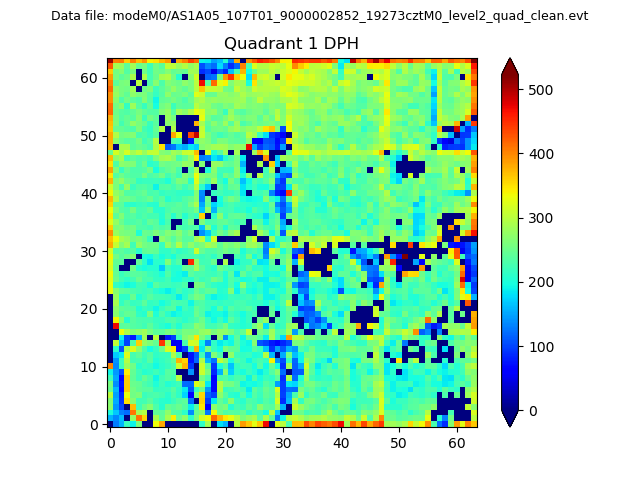 |
Quadrant B |
|---|---|---|---|
| Quadrant D | 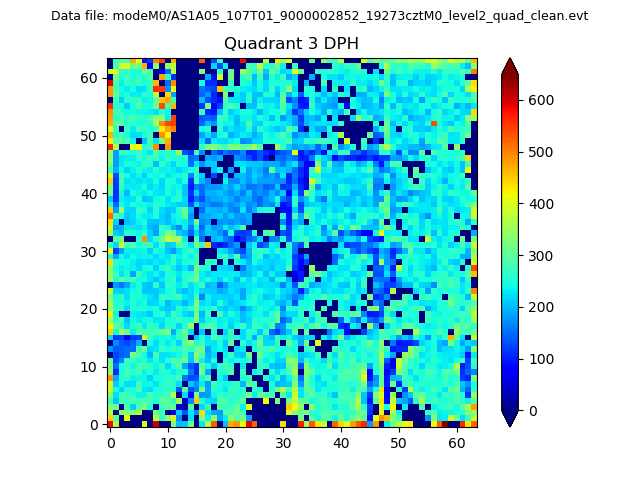 |
 |
Quadrant C |
| Plot type | Count rate plots | Images |
|---|---|---|
| Comparison with Poisson distribution Blue bars denote a histogram of data divided into 1 sec bins. Red curve is a Poisson curve with rate = median count rate of data. |
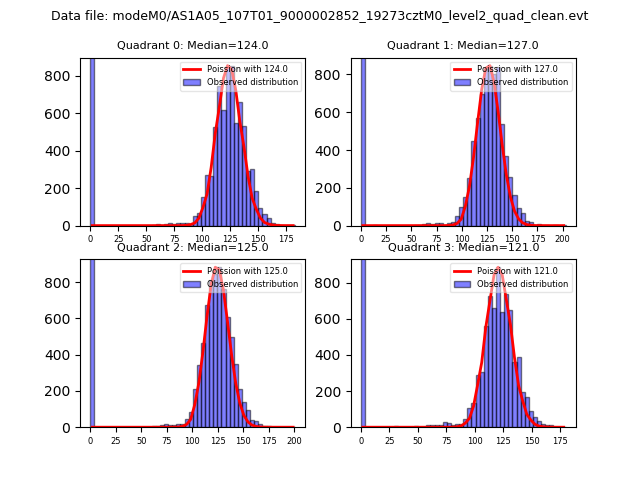 |
 |
| Quadrant-wise count rates Data is divided into 100 sec bins |
 |
|
| Module-wise count rates for Quadrant A Data is divided into 100 sec bins |
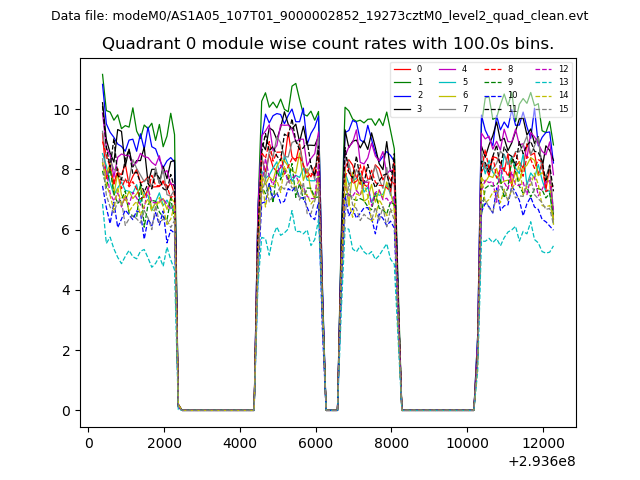 |
 |
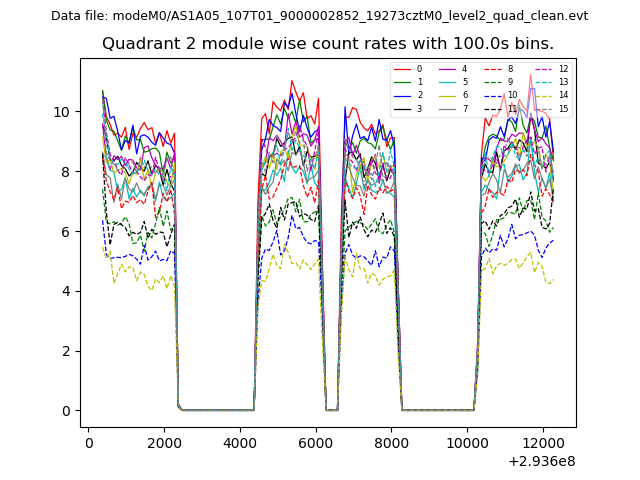
| Module-wise count rates for Quadrant B Data is divided into 100 sec bins |
 |
 |
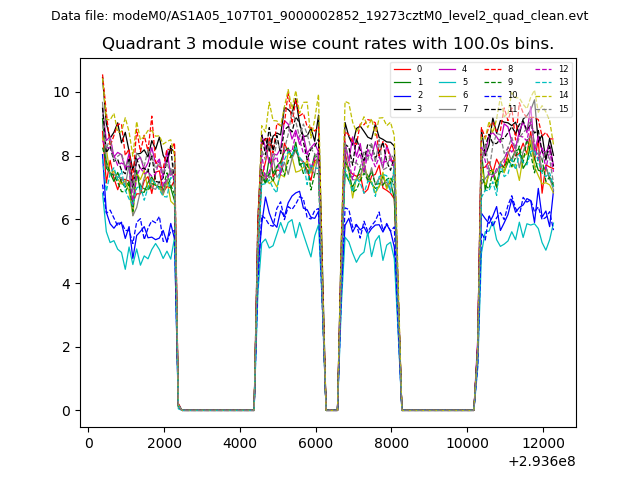
| Module-wise count rates for Quadrant C Data is divided into 100 sec bins |
 |
 |
| Module-wise count rates for Quadrant D Data is divided into 100 sec bins |
 |
 |
| Parameter | Plot |
|---|---|
| CZT HV Monitor | 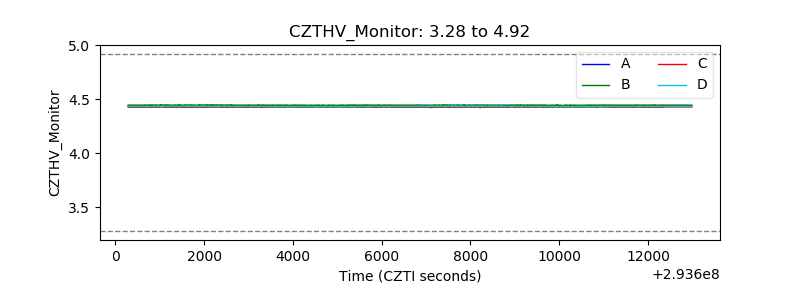 |
| D_VDD | 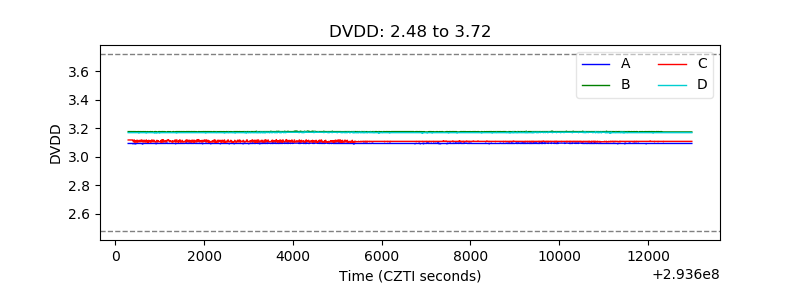 |
| Temperature 1 | 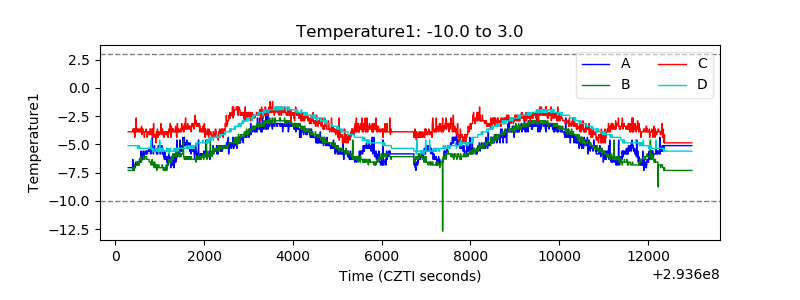 |
| Veto HV Monitor | 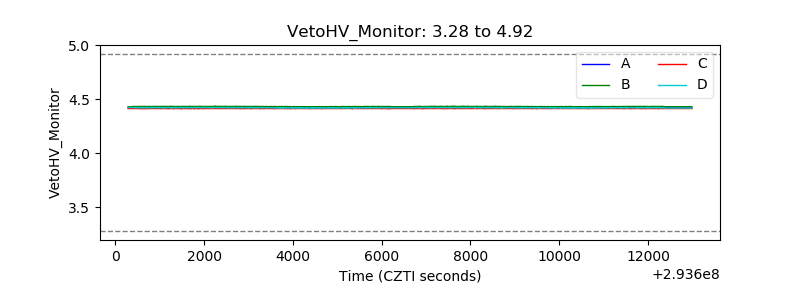 |
| Veto LLD | 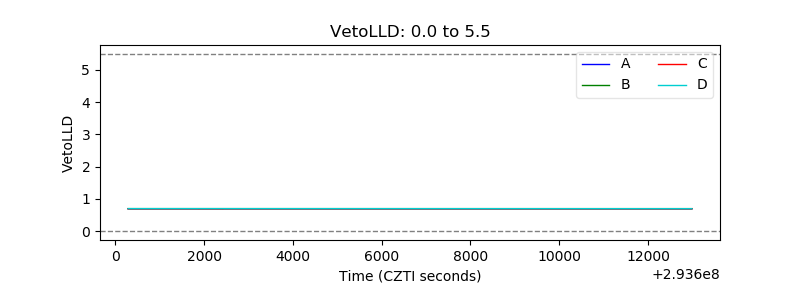 |
| Alpha Counter | 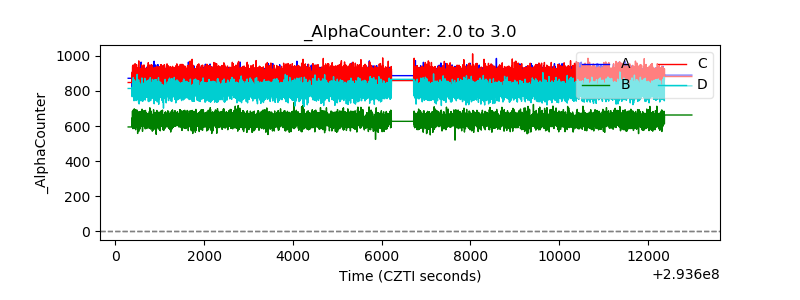 |
| _CPM_Rate | 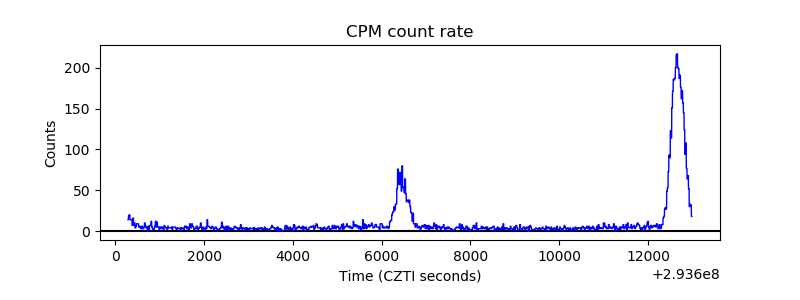 |
| CZT Counter | 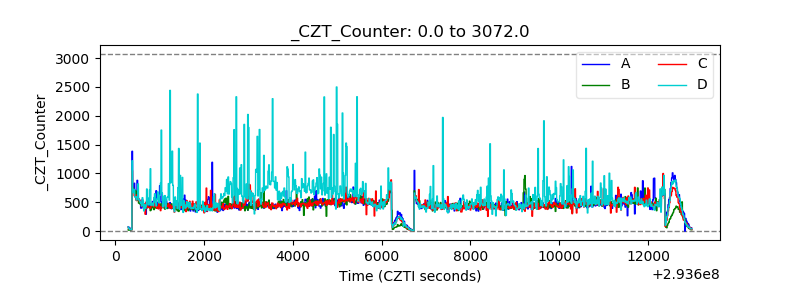 |
| +2.5 Volts monitor |  |
| +5 Volts monitor |  |
| _ROLL_ROT | 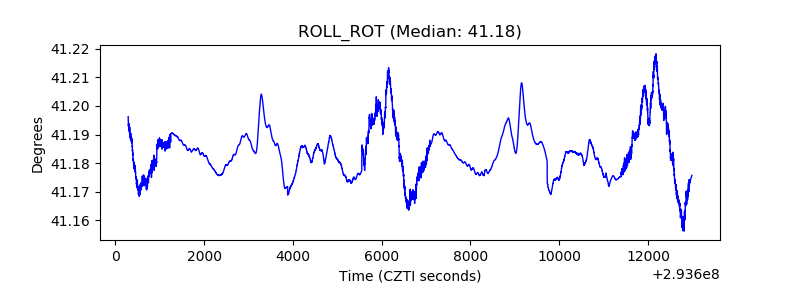 |
| _Roll_DEC | 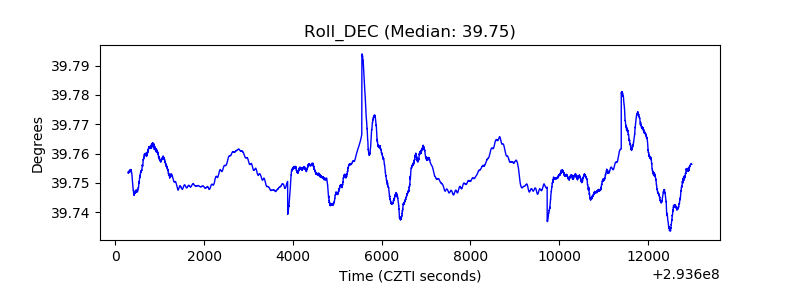 |
| _Roll_RA | 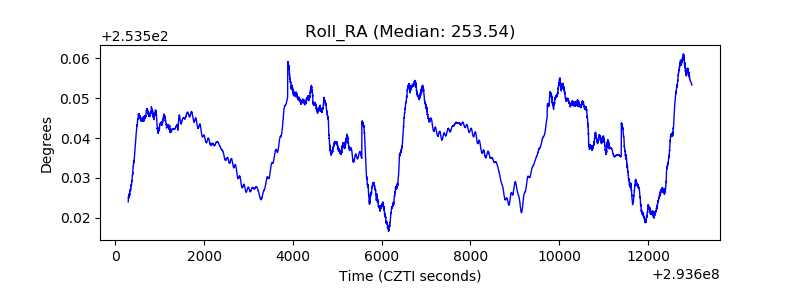 |
| Veto Counter | 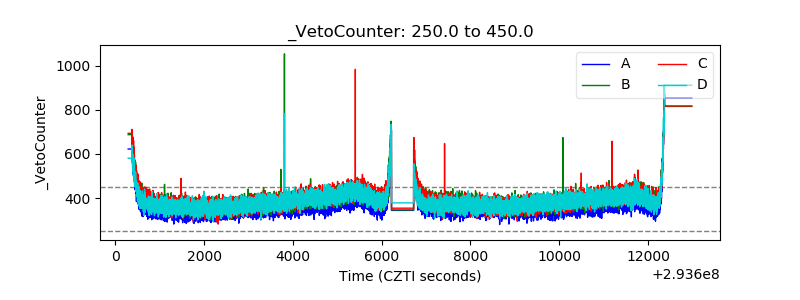 |