| Param | Original file | Final file |
|---|---|---|
| Filename | modeM0/AS1A05_107T01_9000002852_19274cztM0_level2.evt | modeM0/AS1A05_107T01_9000002852_19274cztM0_level2_quad_clean.evt |
| Size (bytes) | 480,781,440 | 88,752,960 |
| Size | 458.5 MB | 84.6 MB |
| Events in quadrant A | 3,397,593 | 548,298 |
| Events in quadrant B | 3,511,388 | 560,102 |
| Events in quadrant C | 3,430,883 | 547,385 |
| Events in quadrant D | 3,730,311 | 529,584 |
| Mode M0 | |||
|---|---|---|---|
| Quadrant | BADHDUFLAG | Total packets | Discarded packets |
| A | 0 | 14747 | 2 |
| B | 0 | 14847 | 2 |
| C | 0 | 14723 | 2 |
| D | 0 | 15882 | 2 |
| Mode SS | |||
|---|---|---|---|
| Quadrant | BADHDUFLAG | Total packets | Discarded packets |
| A | 0 | 148 | 0 |
| B | 0 | 148 | 0 |
| C | 0 | 148 | 0 |
| D | 0 | 148 | 0 |
| Mode M9 | |||
|---|---|---|---|
| Quadrant | BADHDUFLAG | Total packets | Discarded packets |
| A | 0 | 16 | 0 |
| B | 0 | 16 | 0 |
| C | 0 | 16 | 0 |
| D | 0 | 16 | 0 |
| Quadrant | Total seconds | Saturated seconds | Saturation percentage |
|---|---|---|---|
| A | 7212 | 107 | 1.483638% |
| B | 7213 | 117 | 1.622071% |
| C | 7213 | 122 | 1.691391% |
| D | 7213 | 191 | 2.647997% |
Noise dominated data is calculated using 1-second bins in cleaned event files. If a bin has >2000 counts, and if more than 50% of those come from <1% of pixels, then it is considered to be noise-dominated and hence unusable.
| Quadrant | # 1 sec bins | Bins with >0 counts | Bins with >2000 counts | High rate bins dominated by noise | Noise dominated (total time) | Noise dominated (detector-on time) | Marked lightcurve |
|---|---|---|---|---|---|---|---|
| A | 8727 | 7212 | 1 | 1 | 0.01% | 0.01% | 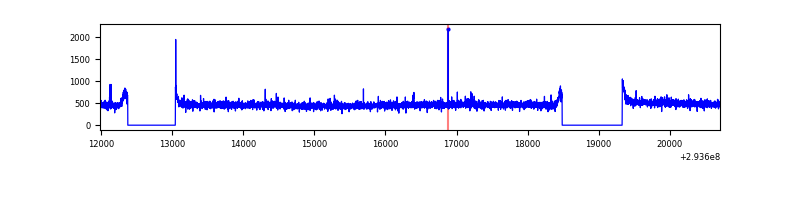 |
| B | 8728 | 7213 | 5 | 5 | 0.06% | 0.07% | 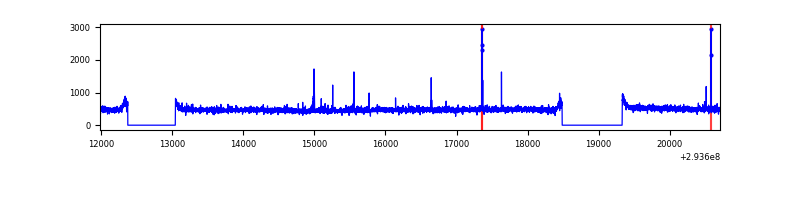 |
| C | 8728 | 7214 | 0 | 0 | 0.00% | 0.00% | 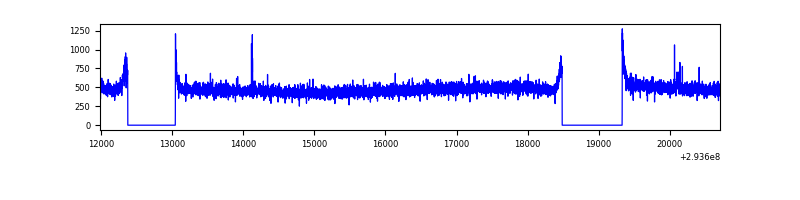 |
| D | 8728 | 7213 | 76 | 76 | 0.87% | 1.05% | 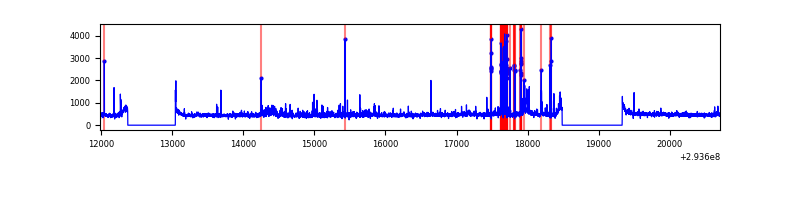 |
Top three noisy pixels from each quadrant. If the there are fewer than three noisy pixels in the level2.evt file, extra rows are filled as -1
| Pixel properties | Quadrant properties | ||||||
|---|---|---|---|---|---|---|---|
| Quadrant | DetID | PixID | Counts | Sigma | Mean | Median | Sigma |
| A | 4 | 2 | 12434 | 65.47 | 875 | 856 | 176.8 |
| A | 9 | 143 | 11378 | 59.5 | 875 | 856 | 176.8 |
| A | 13 | 254 | 9187 | 47.11 | 875 | 856 | 176.8 |
| B | 0 | 229 | 33877 | 194.8 | 873 | 851 | 169.5 |
| B | 12 | 111 | 21458 | 121.55 | 873 | 851 | 169.5 |
| B | 0 | 198 | 19062 | 107.41 | 873 | 851 | 169.5 |
| C | 14 | 238 | 130946 | 657.47 | 841 | 845 | 197.9 |
| C | 3 | 233 | 14376 | 68.38 | 841 | 845 | 197.9 |
| C | 13 | 61 | 5974 | 25.92 | 841 | 845 | 197.9 |
| D | 1 | 52 | 344620 | 1649.92 | 848 | 822 | 208.4 |
| D | 10 | 66 | 66206 | 313.78 | 848 | 822 | 208.4 |
| D | 7 | 238 | 47999 | 226.41 | 848 | 822 | 208.4 |
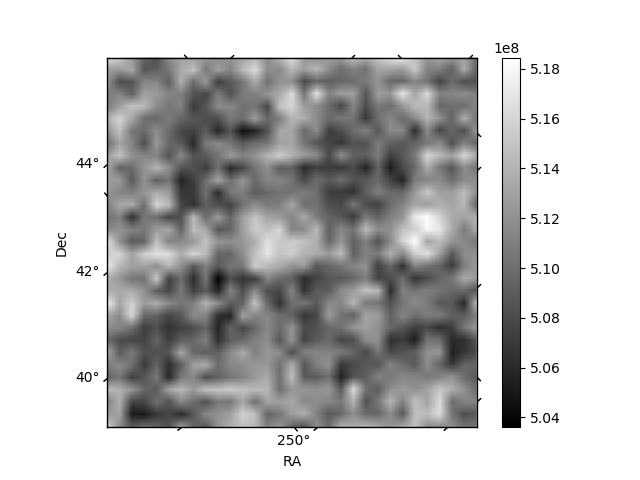
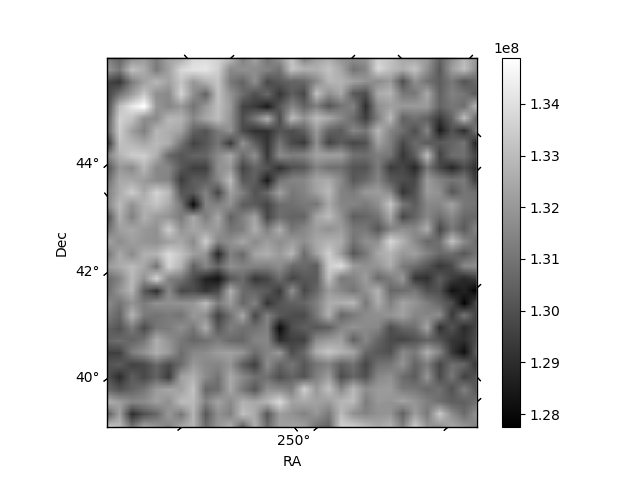
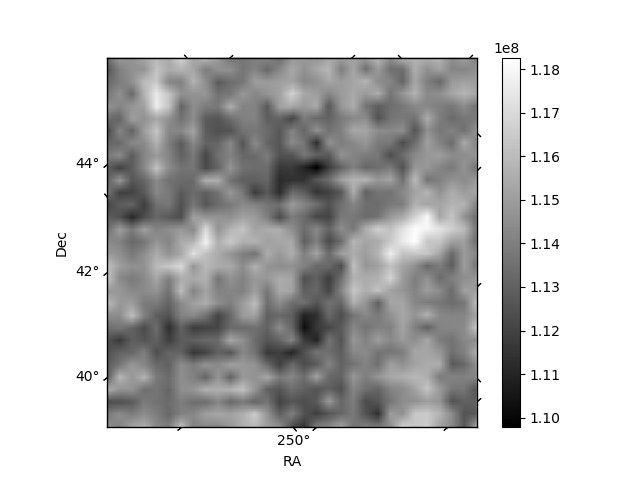
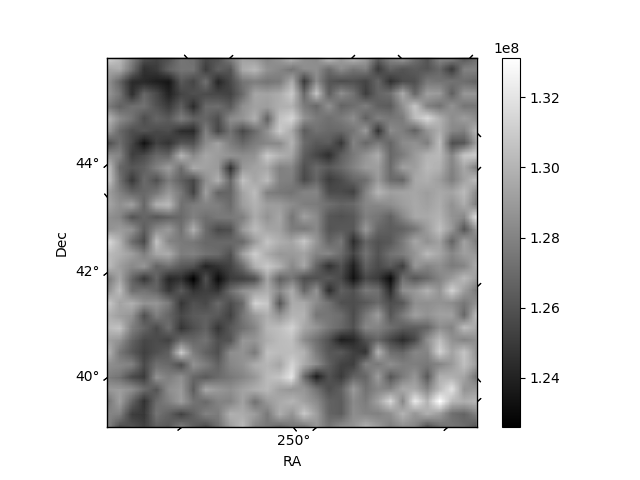
Histogram calculated using DETX and DETY for each event in the final _common_clean file
| Quadrant A | 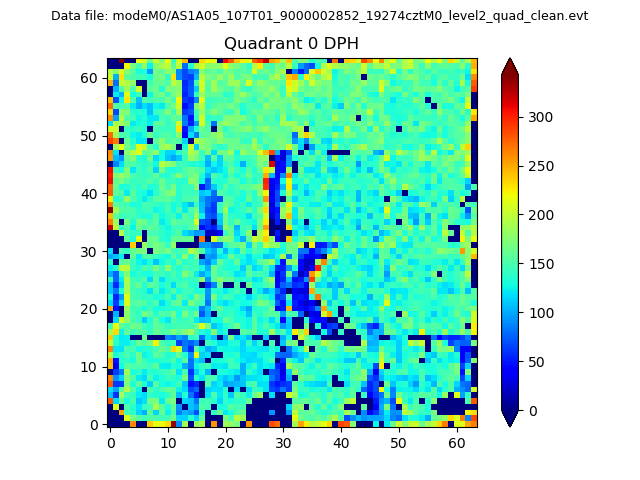 |
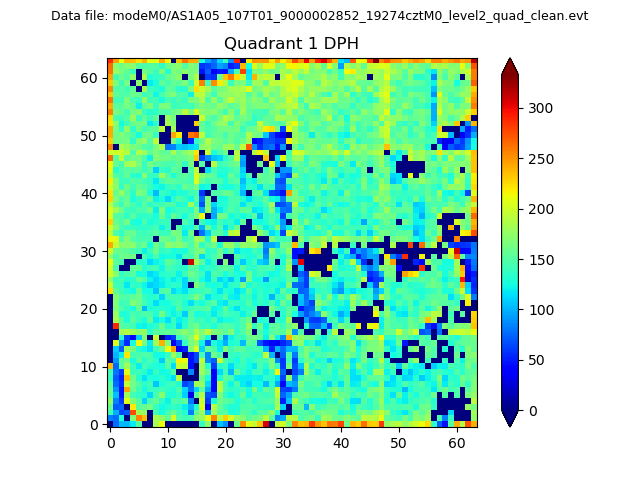 |
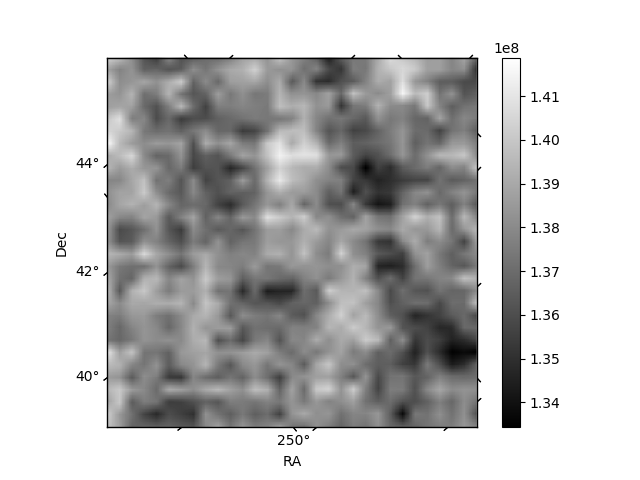
Quadrant B |
|---|---|---|---|
| Quadrant D | 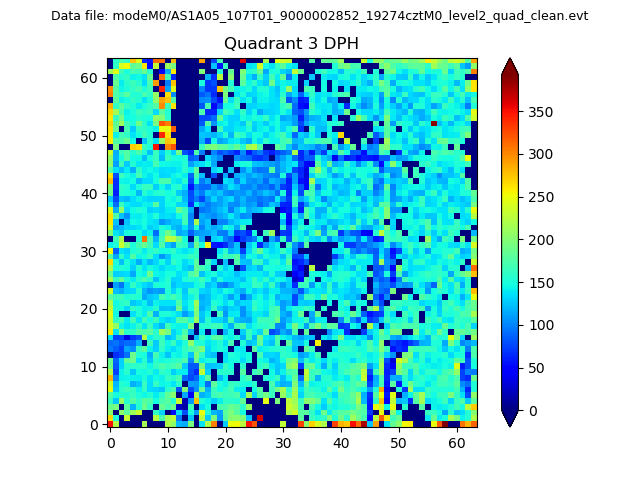 |
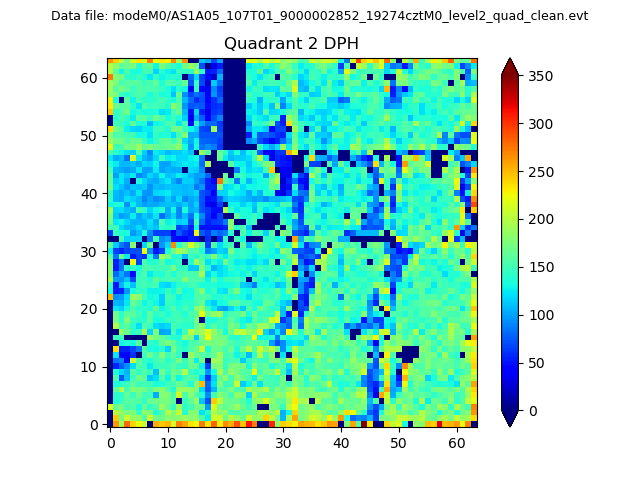 |
Quadrant C |
| Plot type | Count rate plots | Images |
|---|---|---|
| Comparison with Poisson distribution Blue bars denote a histogram of data divided into 1 sec bins. Red curve is a Poisson curve with rate = median count rate of data. |
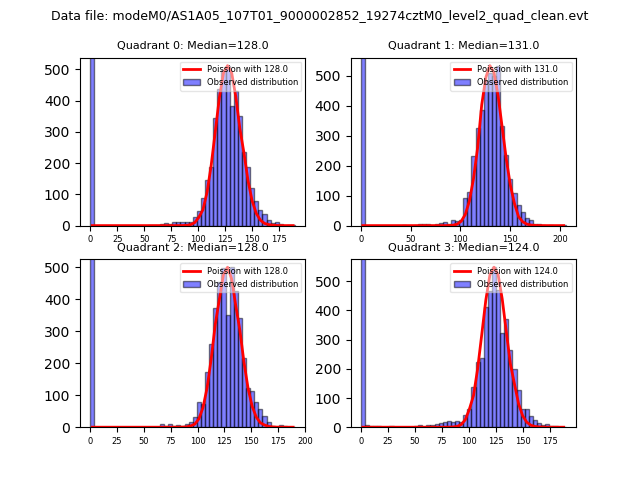 |
 |
| Quadrant-wise count rates Data is divided into 100 sec bins |
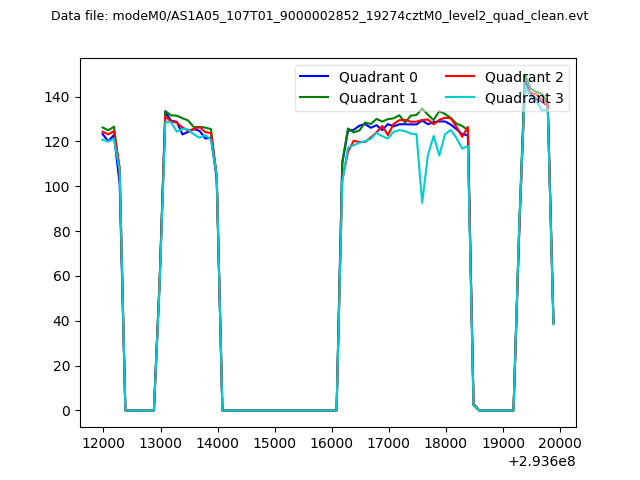 |
|
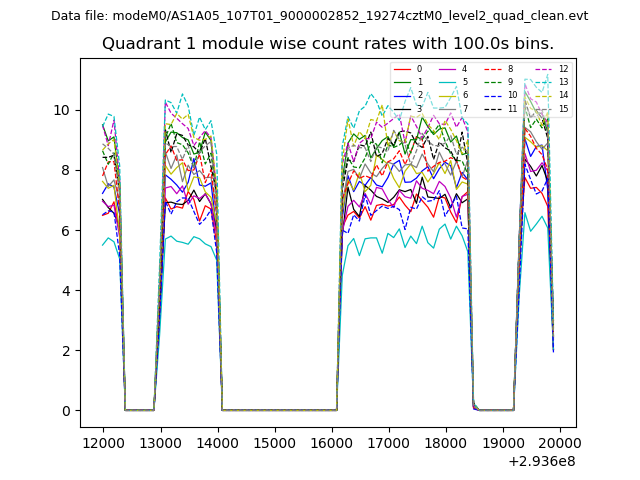
| Module-wise count rates for Quadrant A Data is divided into 100 sec bins |
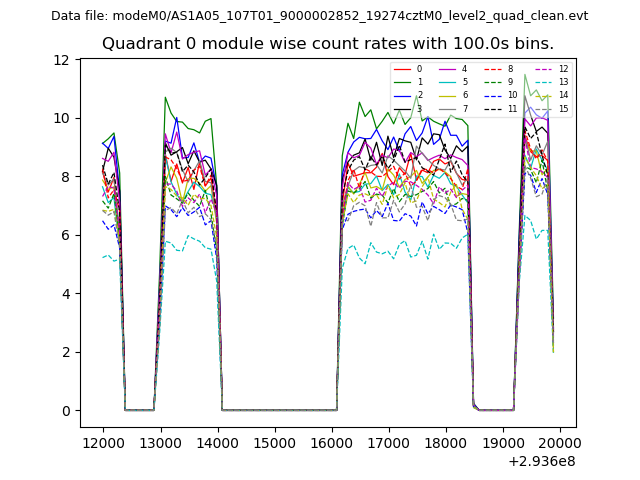 |
 |
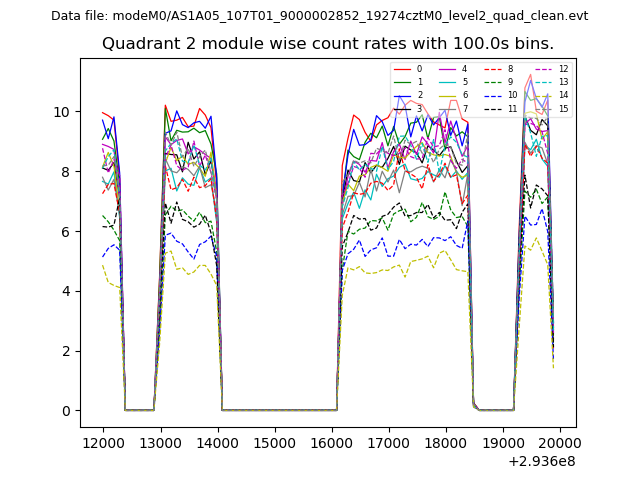
| Module-wise count rates for Quadrant B Data is divided into 100 sec bins |
 |
 |
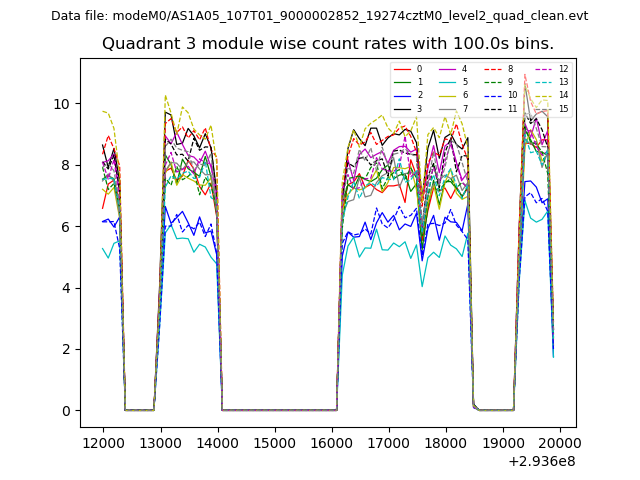
| Module-wise count rates for Quadrant C Data is divided into 100 sec bins |
 |
 |
| Module-wise count rates for Quadrant D Data is divided into 100 sec bins |
 |
 |
| Parameter | Plot |
|---|---|
| CZT HV Monitor | 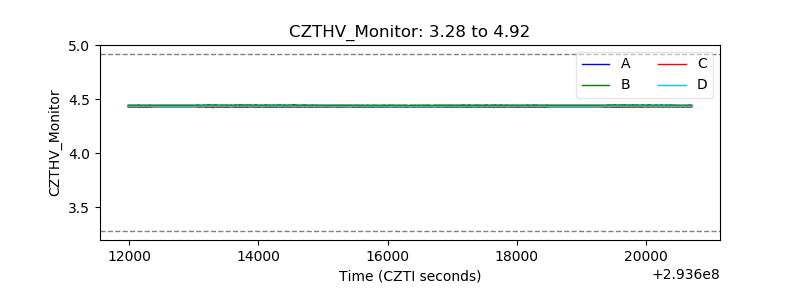 |
| D_VDD | 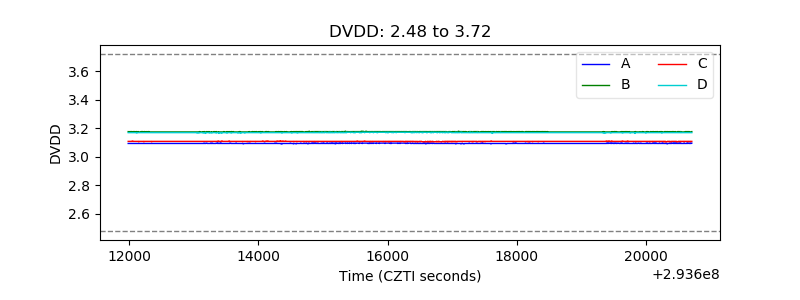 |
| Temperature 1 | 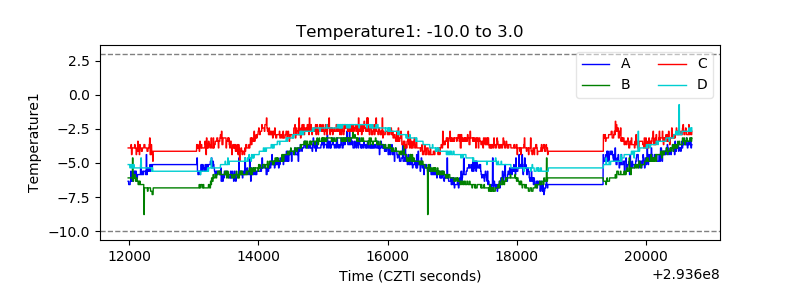 |
| Veto HV Monitor | 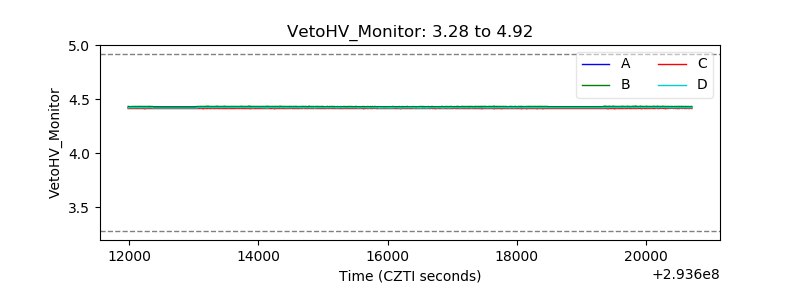 |
| Veto LLD | 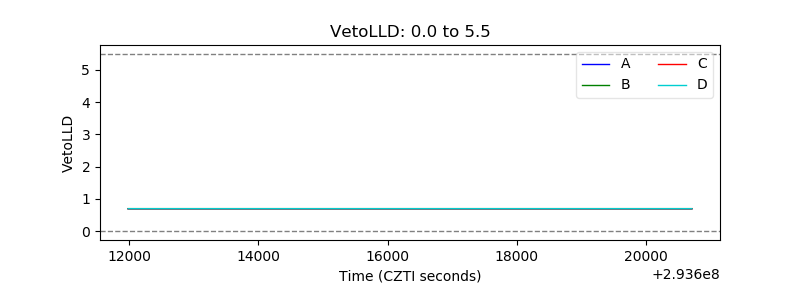 |
| Alpha Counter |  |
| _CPM_Rate | 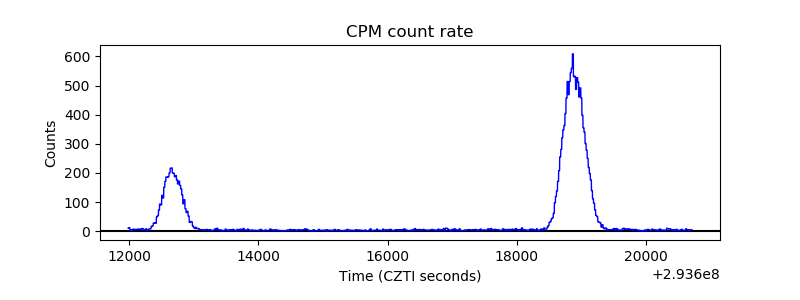 |
| CZT Counter |  |
| +2.5 Volts monitor |  |
| +5 Volts monitor |  |
| _ROLL_ROT | 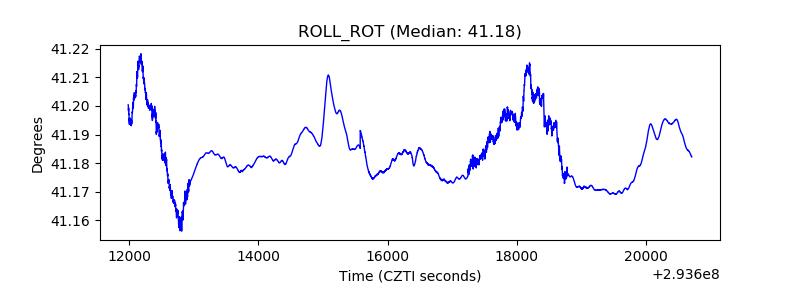 |
| _Roll_DEC | 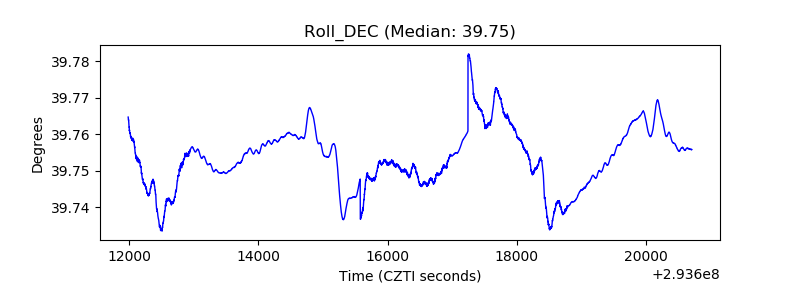 |
| _Roll_RA | 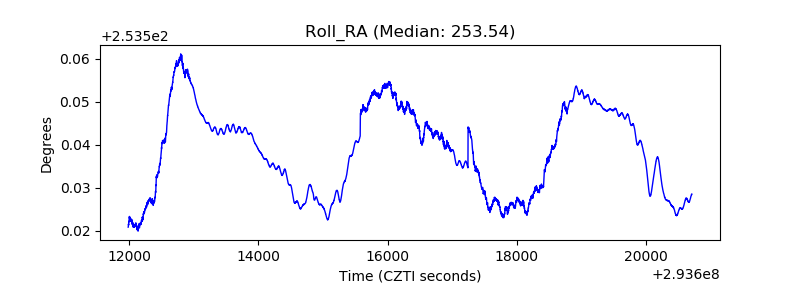 |
| Veto Counter | 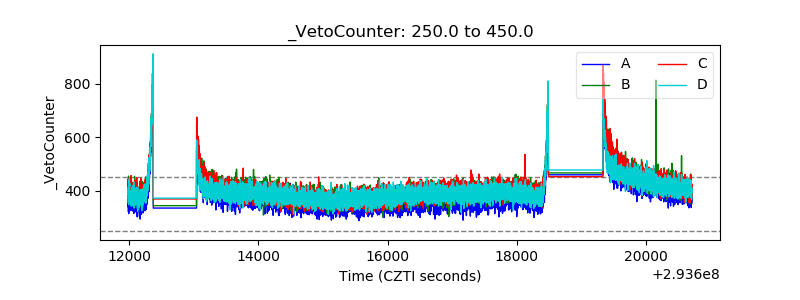 |