| Param | Original file | Final file |
|---|---|---|
| Filename | modeM0/AS1A05_107T01_9000002852_19278cztM0_level2.evt | modeM0/AS1A05_107T01_9000002852_19278cztM0_level2_quad_clean.evt |
| Size (bytes) | 476,547,840 | 72,469,440 |
| Size | 454.5 MB | 69.1 MB |
| Events in quadrant A | 3,446,193 | 441,313 |
| Events in quadrant B | 3,540,191 | 446,158 |
| Events in quadrant C | 3,536,867 | 433,500 |
| Events in quadrant D | 3,475,837 | 427,976 |
| Mode M0 | |||
|---|---|---|---|
| Quadrant | BADHDUFLAG | Total packets | Discarded packets |
| A | 0 | 14492 | 2 |
| B | 0 | 14720 | 2 |
| C | 0 | 14582 | 2 |
| D | 0 | 14638 | 2 |
| Mode SS | |||
|---|---|---|---|
| Quadrant | BADHDUFLAG | Total packets | Discarded packets |
| A | 0 | 130 | 0 |
| B | 0 | 130 | 0 |
| C | 0 | 130 | 0 |
| D | 0 | 130 | 0 |
| Mode M9 | |||
|---|---|---|---|
| Quadrant | BADHDUFLAG | Total packets | Discarded packets |
| A | 0 | 22 | 0 |
| B | 0 | 23 | 0 |
| C | 0 | 23 | 0 |
| D | 0 | 23 | 0 |
| Quadrant | Total seconds | Saturated seconds | Saturation percentage |
|---|---|---|---|
| A | 6388 | 60 | 0.939261% |
| B | 6388 | 89 | 1.393237% |
| C | 6387 | 102 | 1.596994% |
| D | 6387 | 77 | 1.205574% |
Noise dominated data is calculated using 1-second bins in cleaned event files. If a bin has >2000 counts, and if more than 50% of those come from <1% of pixels, then it is considered to be noise-dominated and hence unusable.
| Quadrant | # 1 sec bins | Bins with >0 counts | Bins with >2000 counts | High rate bins dominated by noise | Noise dominated (total time) | Noise dominated (detector-on time) | Marked lightcurve |
|---|---|---|---|---|---|---|---|
| A | 7663 | 6389 | 1 | 1 | 0.01% | 0.02% | 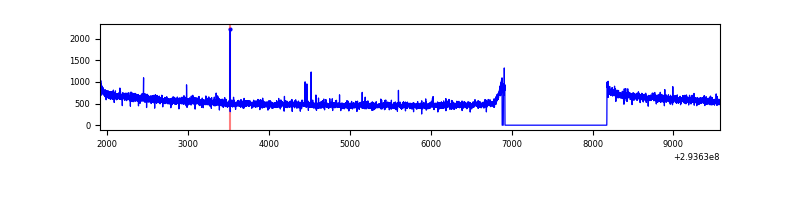 |
| B | 7663 | 6389 | 7 | 7 | 0.09% | 0.11% | 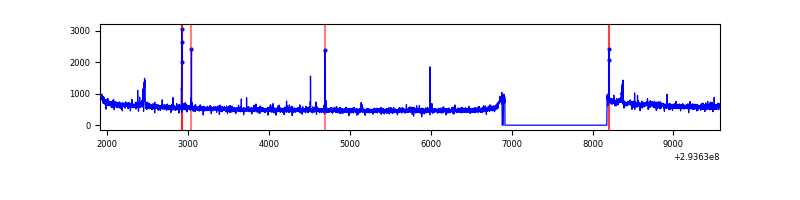 |
| C | 7662 | 6388 | 0 | 0 | 0.00% | 0.00% | 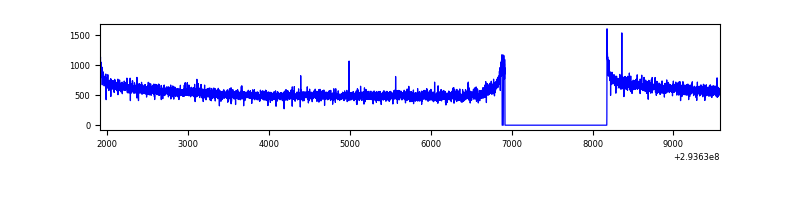 |
| D | 7662 | 6388 | 27 | 27 | 0.35% | 0.42% | 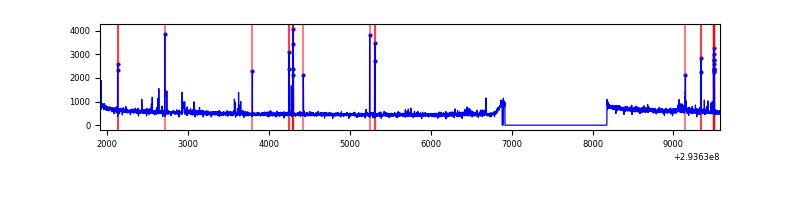 |
Top three noisy pixels from each quadrant. If the there are fewer than three noisy pixels in the level2.evt file, extra rows are filled as -1
| Pixel properties | Quadrant properties | ||||||
|---|---|---|---|---|---|---|---|
| Quadrant | DetID | PixID | Counts | Sigma | Mean | Median | Sigma |
| A | 5 | 16 | 12619 | 66.65 | 889 | 876 | 176.2 |
| A | 13 | 254 | 10060 | 52.13 | 889 | 876 | 176.2 |
| A | 0 | 226 | 7872 | 39.71 | 889 | 876 | 176.2 |
| B | 0 | 230 | 31329 | 185.4 | 880 | 862 | 164.3 |
| B | 3 | 64 | 25100 | 147.49 | 880 | 862 | 164.3 |
| B | 12 | 111 | 19124 | 111.13 | 880 | 862 | 164.3 |
| C | 14 | 238 | 135614 | 685.32 | 854 | 864 | 196.6 |
| C | 3 | 233 | 63601 | 319.07 | 854 | 864 | 196.6 |
| C | 13 | 61 | 5962 | 25.93 | 854 | 864 | 196.6 |
| D | 1 | 52 | 63056 | 295.23 | 869 | 847 | 210.7 |
| D | 12 | 218 | 42847 | 199.32 | 869 | 847 | 210.7 |
| D | 13 | 138 | 35609 | 164.97 | 869 | 847 | 210.7 |
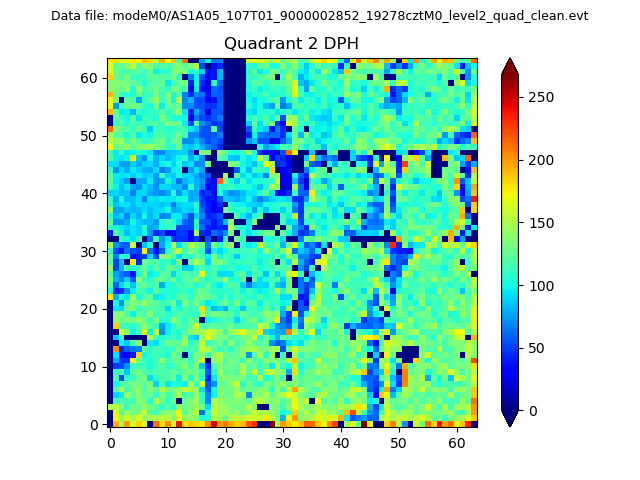
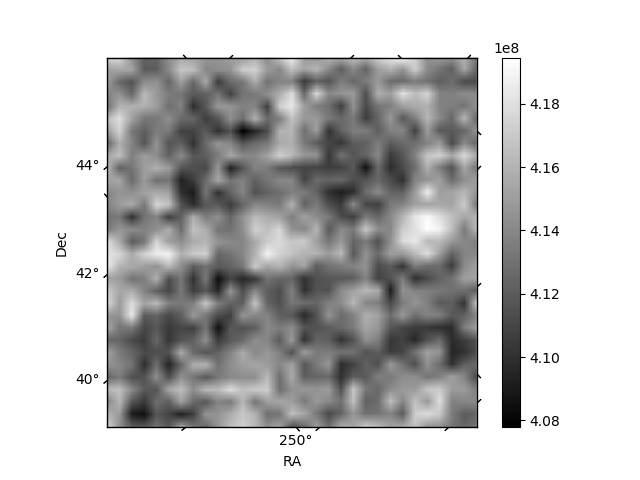
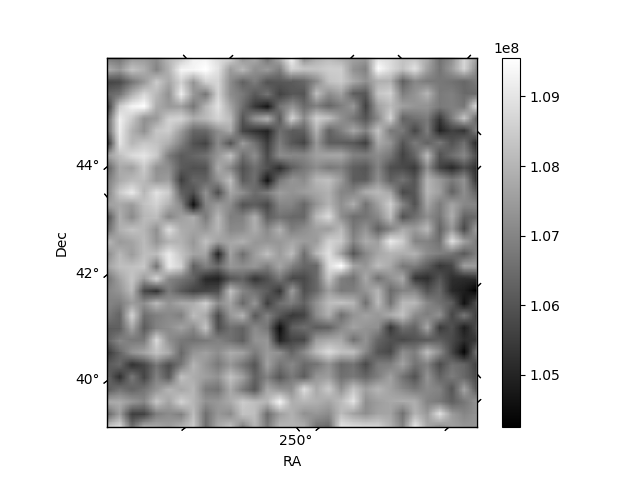
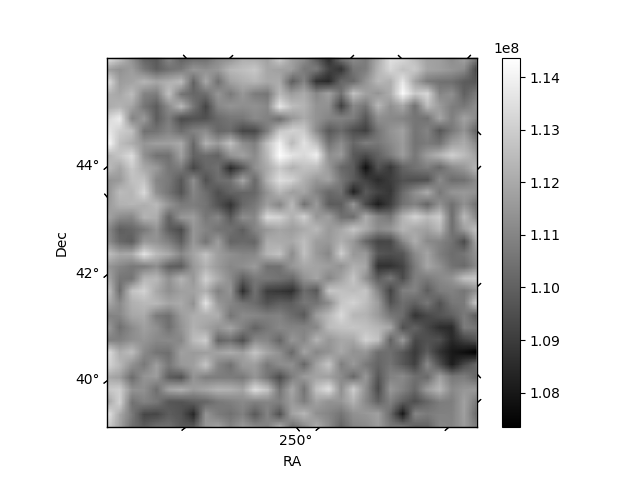
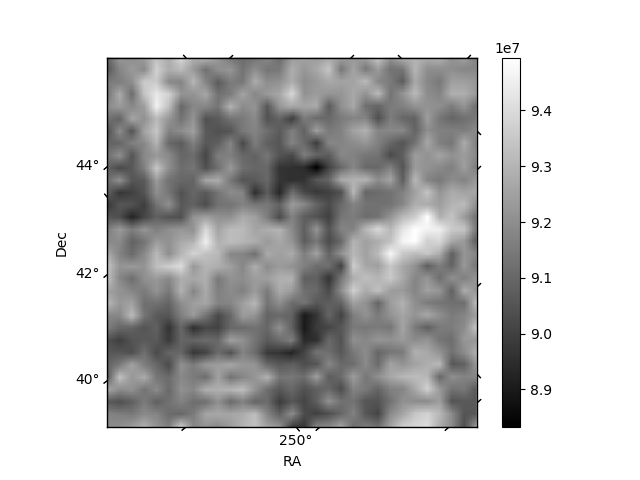
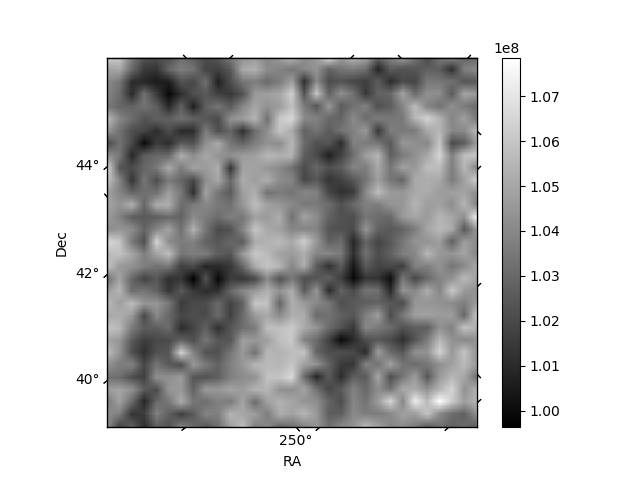
Histogram calculated using DETX and DETY for each event in the final _common_clean file
| Quadrant A | 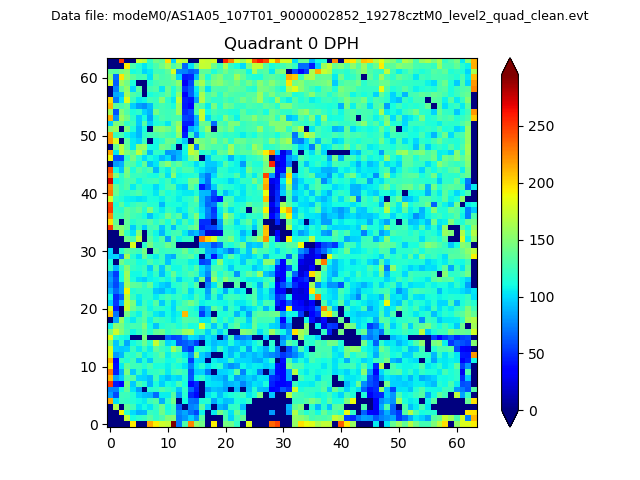 |
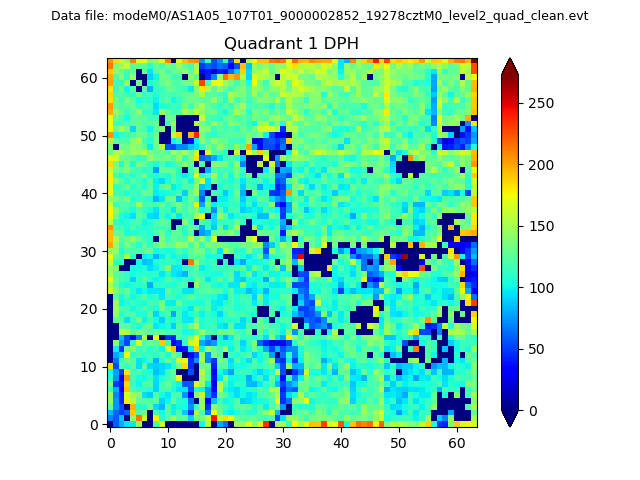 |
Quadrant B |
|---|---|---|---|
| Quadrant D | 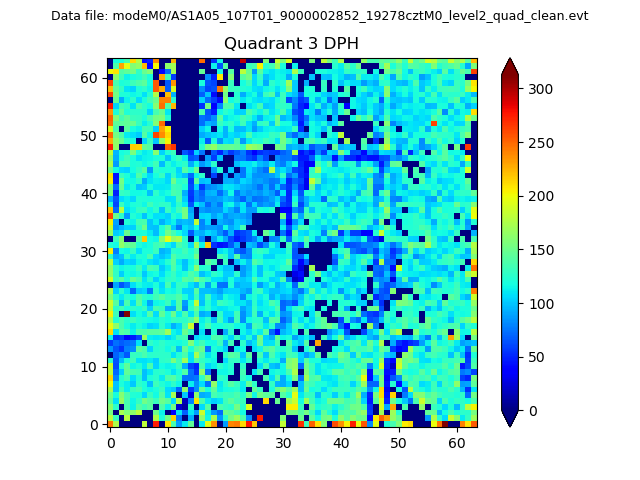 |
 |
Quadrant C |
| Plot type | Count rate plots | Images |
|---|---|---|
| Comparison with Poisson distribution Blue bars denote a histogram of data divided into 1 sec bins. Red curve is a Poisson curve with rate = median count rate of data. |
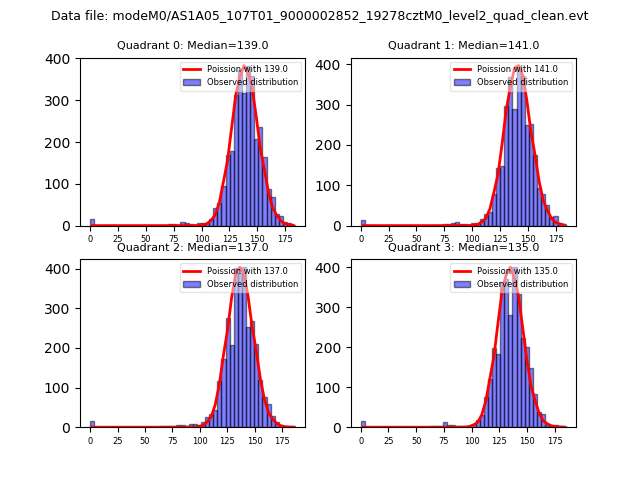 |
 |
| Quadrant-wise count rates Data is divided into 100 sec bins |
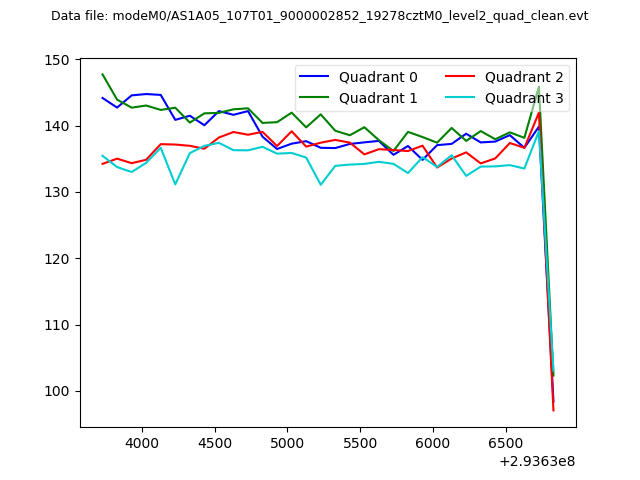 |
|
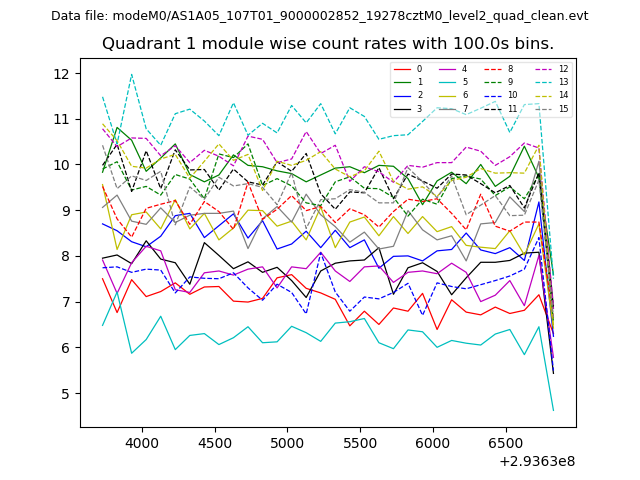
| Module-wise count rates for Quadrant A Data is divided into 100 sec bins |
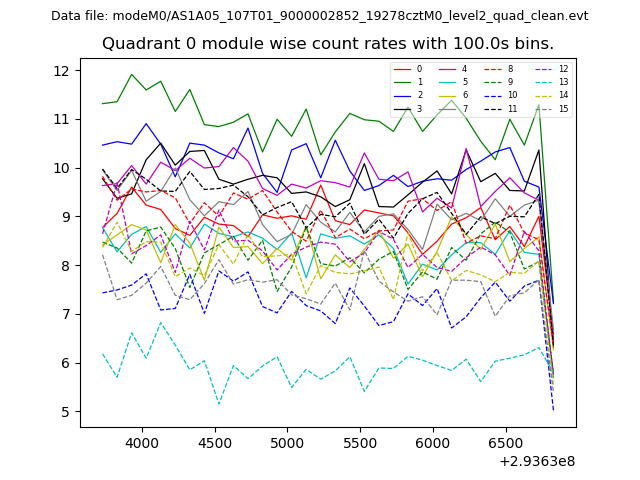 |
 |
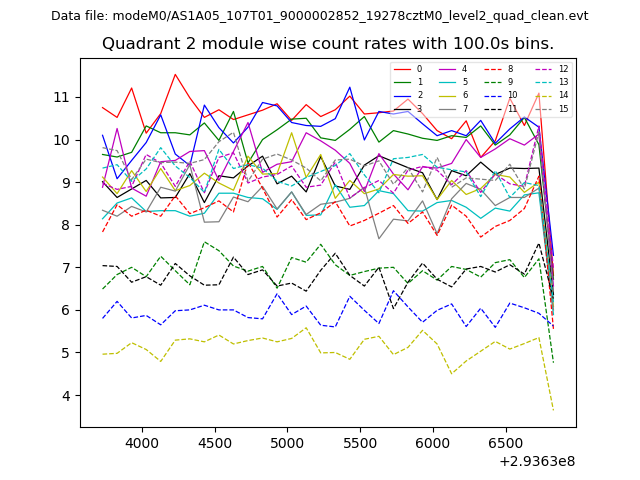
| Module-wise count rates for Quadrant B Data is divided into 100 sec bins |
 |
 |
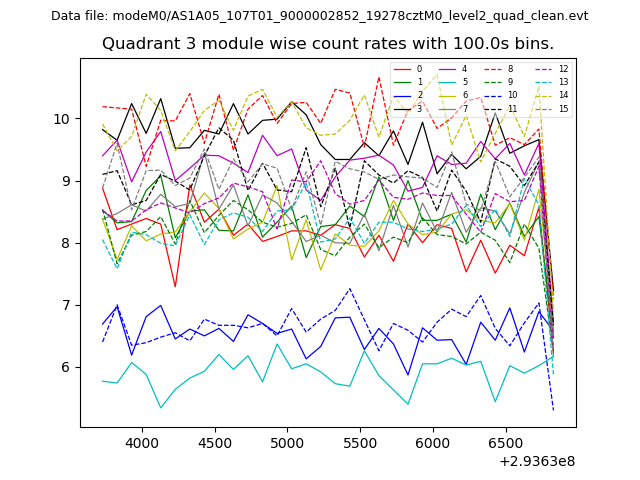
| Module-wise count rates for Quadrant C Data is divided into 100 sec bins |
 |
 |
| Module-wise count rates for Quadrant D Data is divided into 100 sec bins |
 |
 |
| Parameter | Plot |
|---|---|
| CZT HV Monitor | 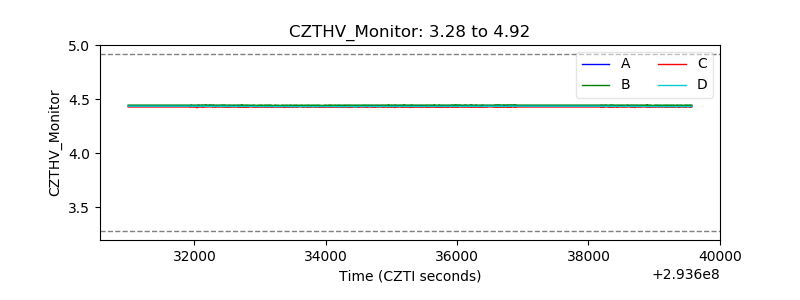 |
| D_VDD | 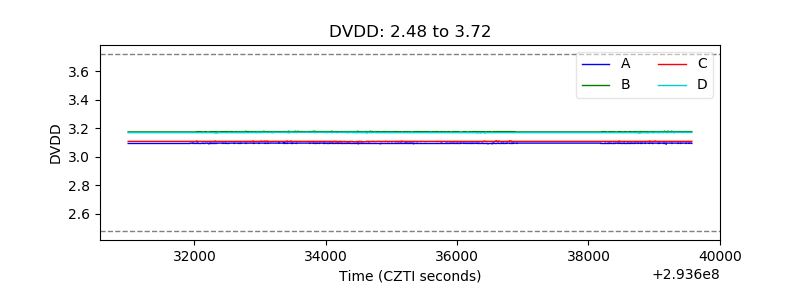 |
| Temperature 1 | 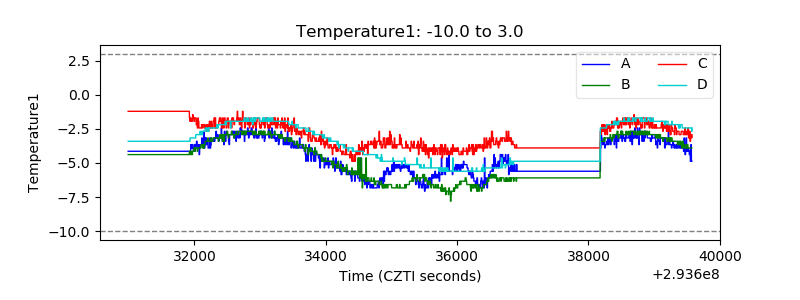 |
| Veto HV Monitor | 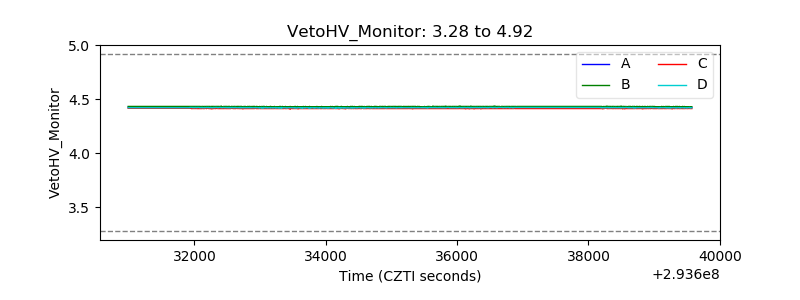 |
| Veto LLD | 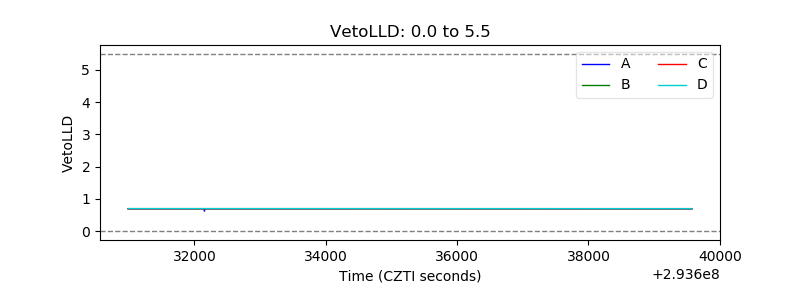 |
| Alpha Counter | 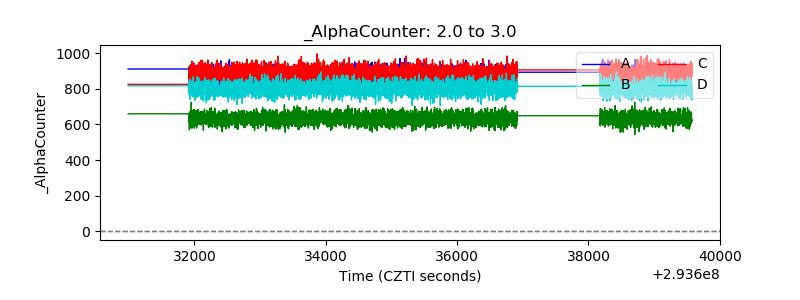 |
| _CPM_Rate | 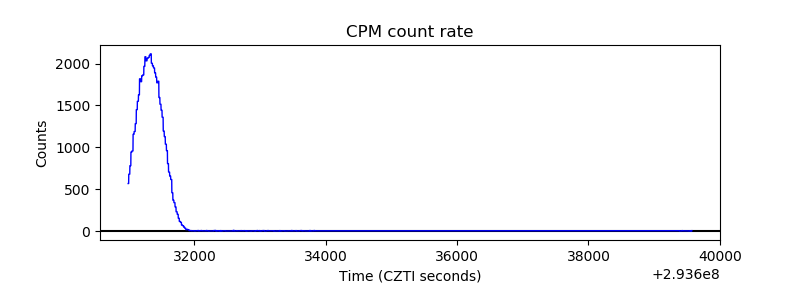 |
| CZT Counter | 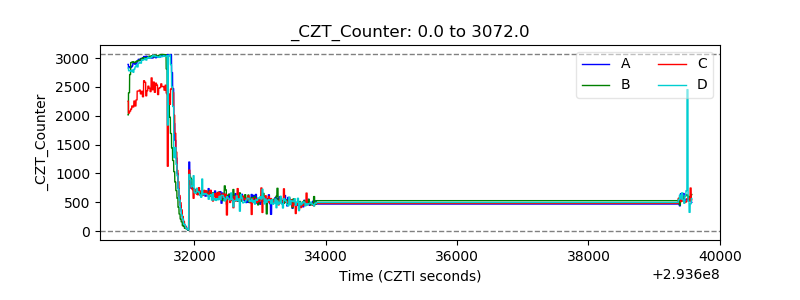 |
| +2.5 Volts monitor |  |
| +5 Volts monitor |  |
| _ROLL_ROT | 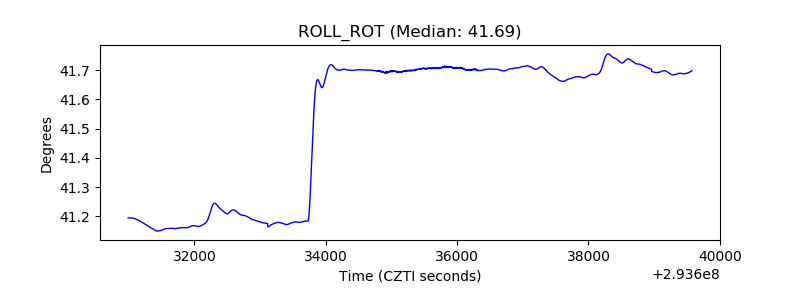 |
| _Roll_DEC | 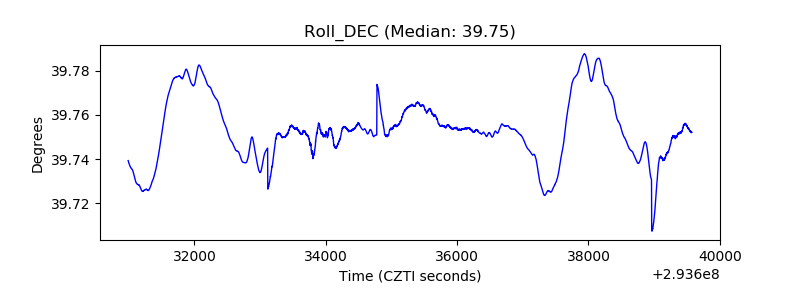 |
| _Roll_RA | 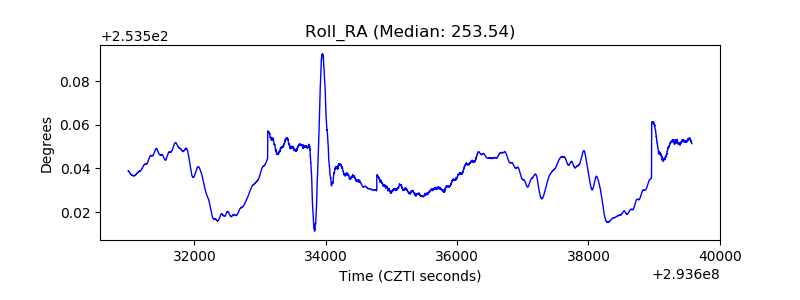 |
| Veto Counter | 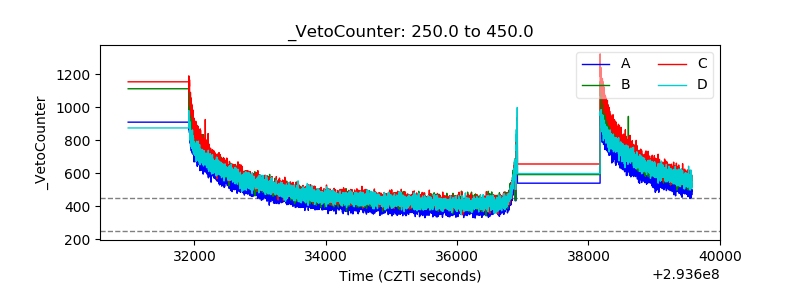 |