| Param | Original file | Final file |
|---|---|---|
| Filename | modeM0/AS1A05_107T01_9000002852_19280cztM0_level2.evt | modeM0/AS1A05_107T01_9000002852_19280cztM0_level2_quad_clean.evt |
| Size (bytes) | 476,297,280 | 101,998,080 |
| Size | 454.2 MB | 97.3 MB |
| Events in quadrant A | 3,363,014 | 663,979 |
| Events in quadrant B | 3,449,472 | 680,927 |
| Events in quadrant C | 3,596,975 | 664,726 |
| Events in quadrant D | 3,596,838 | 649,170 |
| Mode M0 | |||
|---|---|---|---|
| Quadrant | BADHDUFLAG | Total packets | Discarded packets |
| A | 0 | 14051 | 2 |
| B | 0 | 14305 | 2 |
| C | 0 | 14787 | 2 |
| D | 0 | 14913 | 2 |
| Mode SS | |||
|---|---|---|---|
| Quadrant | BADHDUFLAG | Total packets | Discarded packets |
| A | 0 | 128 | 0 |
| B | 0 | 128 | 0 |
| C | 0 | 128 | 0 |
| D | 0 | 128 | 0 |
| Mode M9 | |||
|---|---|---|---|
| Quadrant | BADHDUFLAG | Total packets | Discarded packets |
| A | 0 | 27 | 0 |
| B | 0 | 27 | 0 |
| C | 0 | 27 | 0 |
| D | 0 | 27 | 0 |
| Quadrant | Total seconds | Saturated seconds | Saturation percentage |
|---|---|---|---|
| A | 6160 | 100 | 1.623377% |
| B | 6161 | 120 | 1.947736% |
| C | 6161 | 174 | 2.824217% |
| D | 6161 | 149 | 2.418439% |
Noise dominated data is calculated using 1-second bins in cleaned event files. If a bin has >2000 counts, and if more than 50% of those come from <1% of pixels, then it is considered to be noise-dominated and hence unusable.
| Quadrant | # 1 sec bins | Bins with >0 counts | Bins with >2000 counts | High rate bins dominated by noise | Noise dominated (total time) | Noise dominated (detector-on time) | Marked lightcurve |
|---|---|---|---|---|---|---|---|
| A | 8850 | 6161 | 0 | 0 | 0.00% | 0.00% | 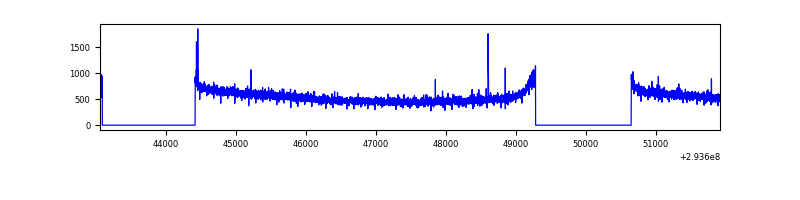 |
| B | 8851 | 6162 | 1 | 1 | 0.01% | 0.02% | 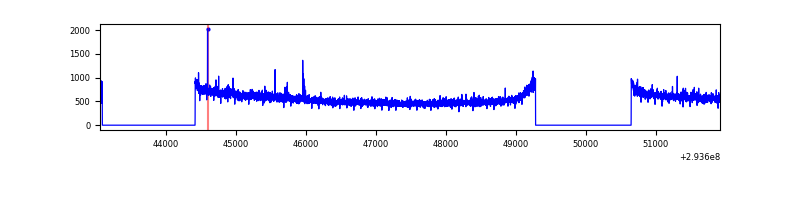 |
| C | 8851 | 6161 | 1 | 1 | 0.01% | 0.02% | 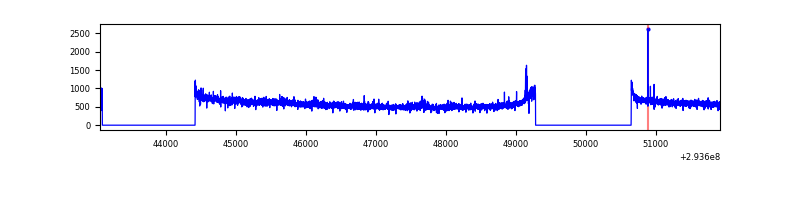 |
| D | 8851 | 6162 | 39 | 39 | 0.44% | 0.63% | 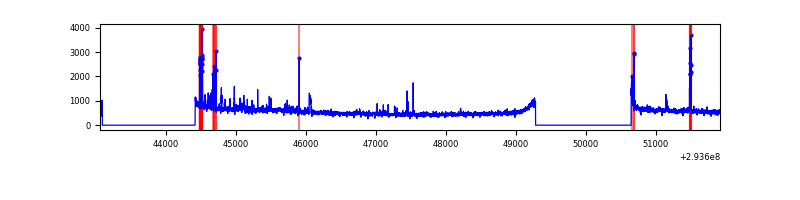 |
Top three noisy pixels from each quadrant. If the there are fewer than three noisy pixels in the level2.evt file, extra rows are filled as -1
| Pixel properties | Quadrant properties | ||||||
|---|---|---|---|---|---|---|---|
| Quadrant | DetID | PixID | Counts | Sigma | Mean | Median | Sigma |
| A | 13 | 254 | 9363 | 49.3 | 869 | 854 | 172.6 |
| A | 4 | 2 | 8529 | 44.47 | 869 | 854 | 172.6 |
| A | 0 | 226 | 7549 | 38.79 | 869 | 854 | 172.6 |
| B | 12 | 111 | 18555 | 108.73 | 871 | 850 | 162.8 |
| B | 0 | 190 | 16732 | 97.53 | 871 | 850 | 162.8 |
| B | 11 | 111 | 16348 | 95.18 | 871 | 850 | 162.8 |
| C | 14 | 238 | 136358 | 690.15 | 855 | 865 | 196.3 |
| C | 3 | 233 | 116418 | 588.58 | 855 | 865 | 196.3 |
| C | 9 | 54 | 7190 | 32.22 | 855 | 865 | 196.3 |
| D | 13 | 138 | 120639 | 578.24 | 861 | 839 | 207.2 |
| D | 7 | 238 | 70121 | 334.4 | 861 | 839 | 207.2 |
| D | 10 | 66 | 65297 | 311.12 | 861 | 839 | 207.2 |
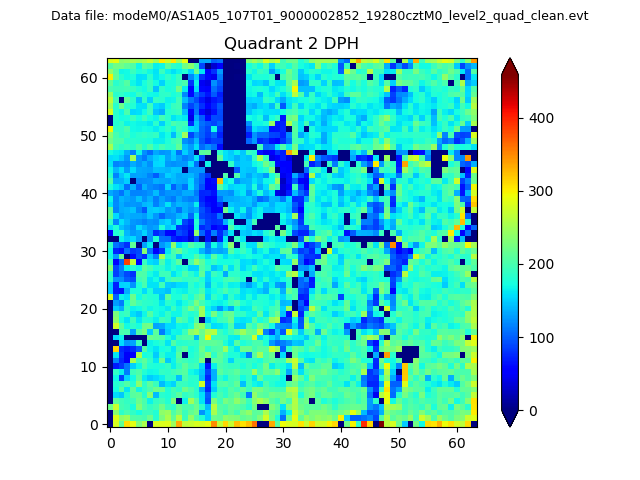
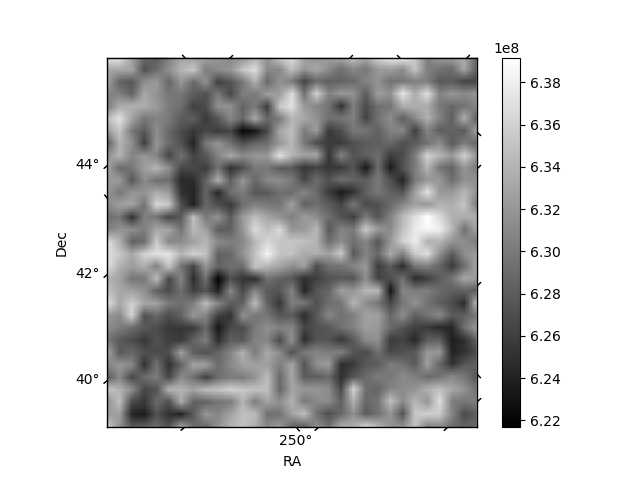
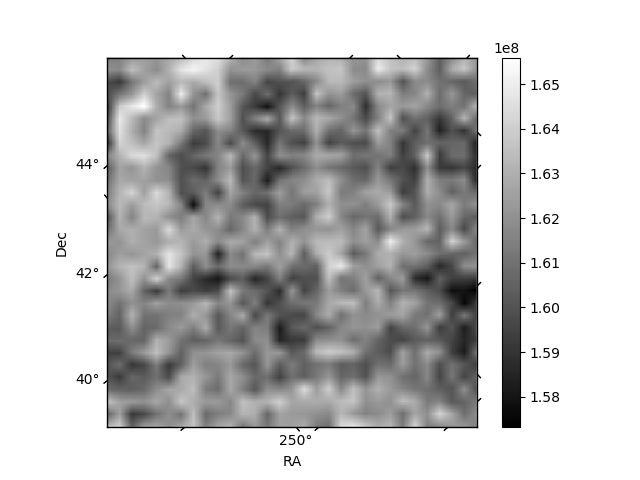
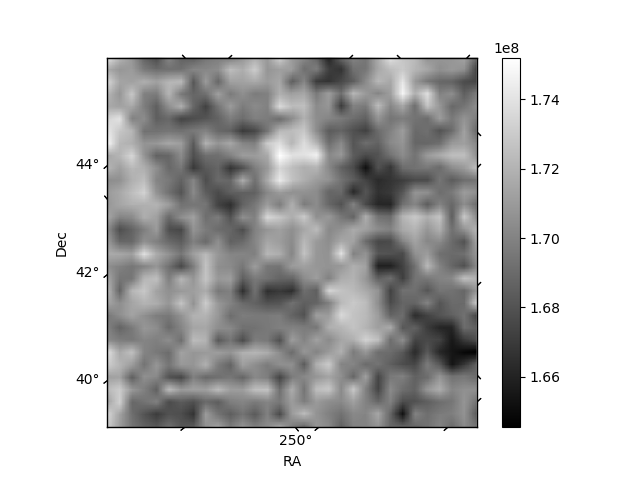
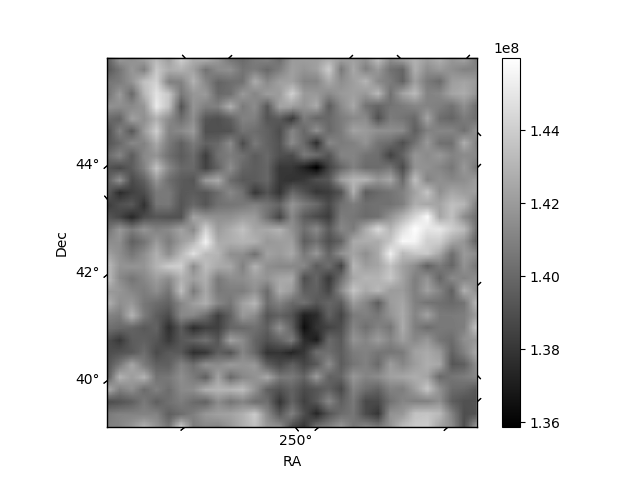
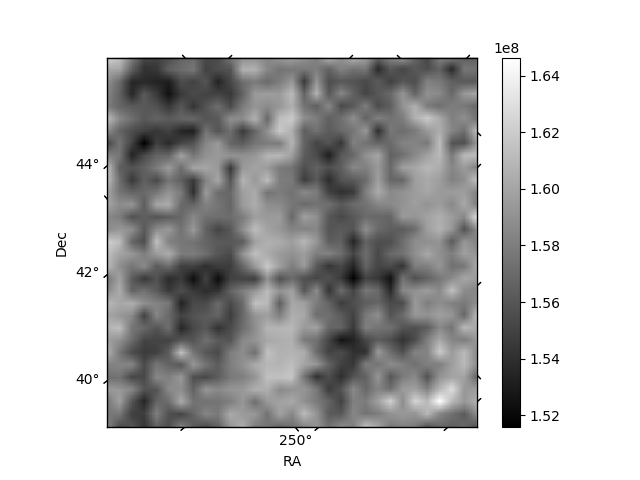
Histogram calculated using DETX and DETY for each event in the final _common_clean file
| Quadrant A | 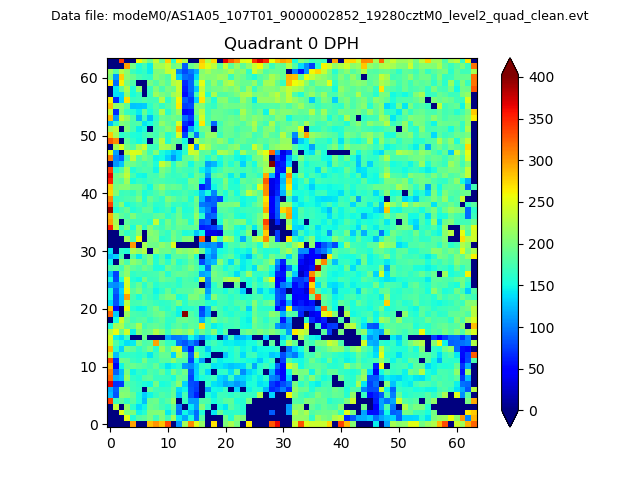 |
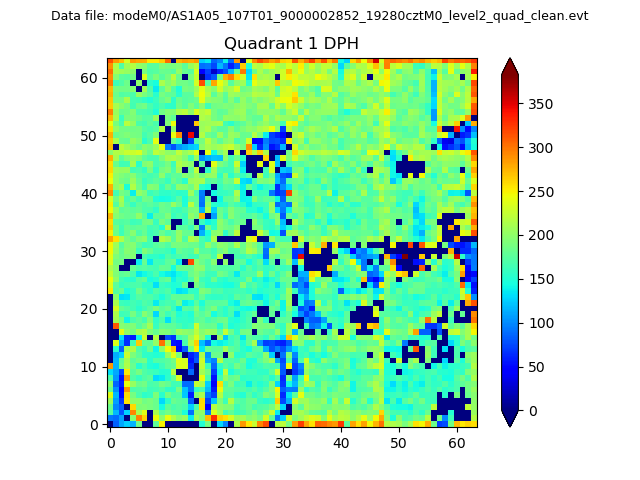 |
Quadrant B |
|---|---|---|---|
| Quadrant D | 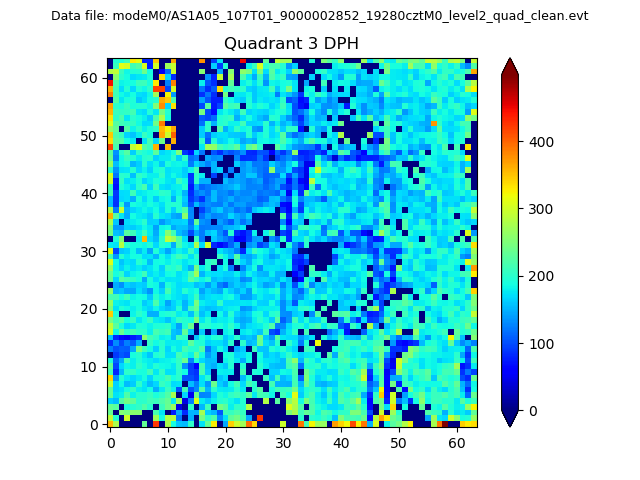 |
 |
Quadrant C |
| Plot type | Count rate plots | Images |
|---|---|---|
| Comparison with Poisson distribution Blue bars denote a histogram of data divided into 1 sec bins. Red curve is a Poisson curve with rate = median count rate of data. |
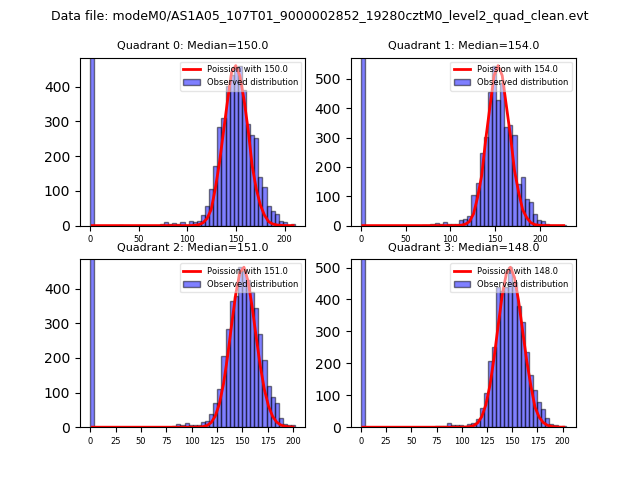 |
 |
| Quadrant-wise count rates Data is divided into 100 sec bins |
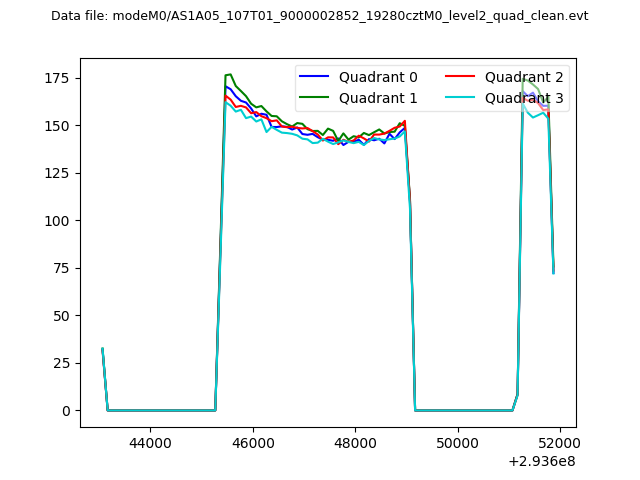 |
|
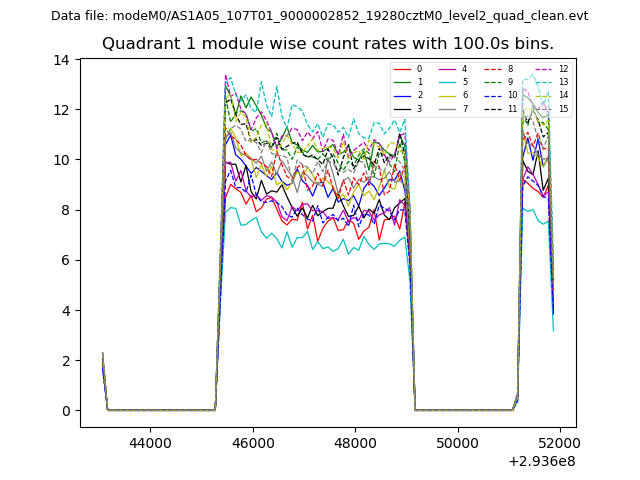
| Module-wise count rates for Quadrant A Data is divided into 100 sec bins |
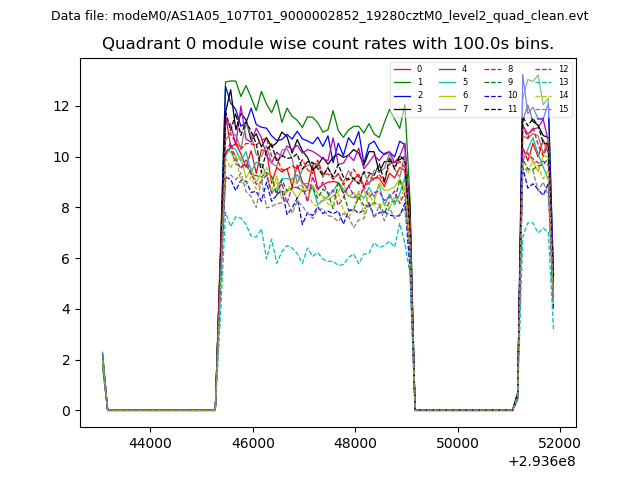 |
 |
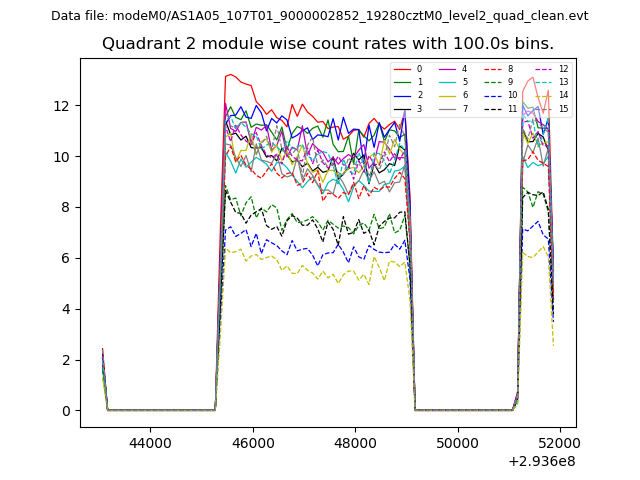
| Module-wise count rates for Quadrant B Data is divided into 100 sec bins |
 |
 |
| Module-wise count rates for Quadrant C Data is divided into 100 sec bins |
 |
 |
| Module-wise count rates for Quadrant D Data is divided into 100 sec bins |
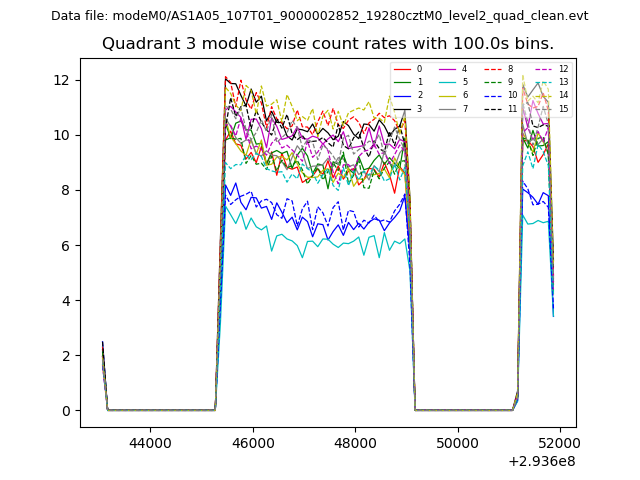 |
 |
| Parameter | Plot |
|---|---|
| CZT HV Monitor | 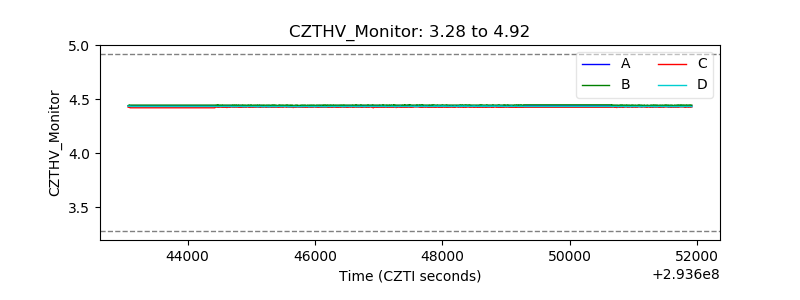 |
| D_VDD | 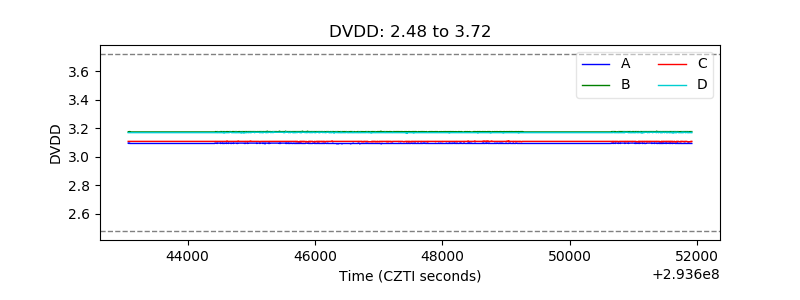 |
| Temperature 1 | 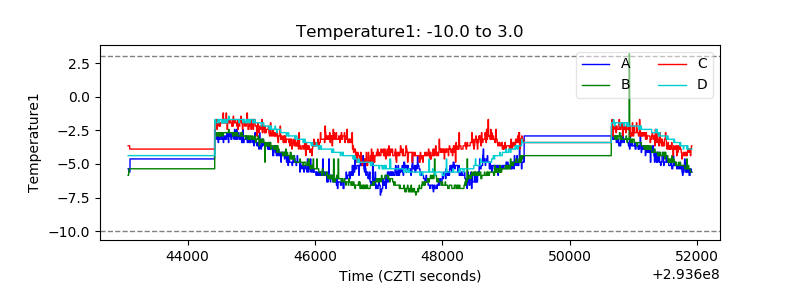 |
| Veto HV Monitor | 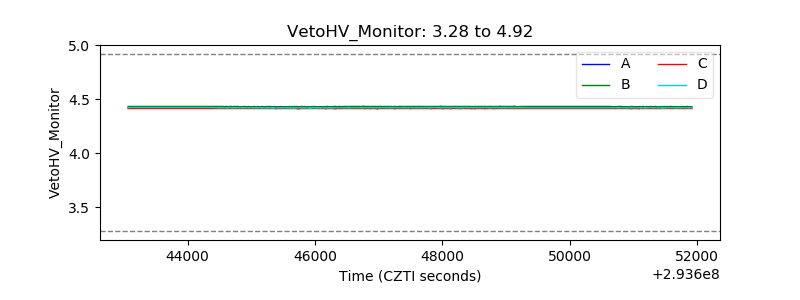 |
| Veto LLD | 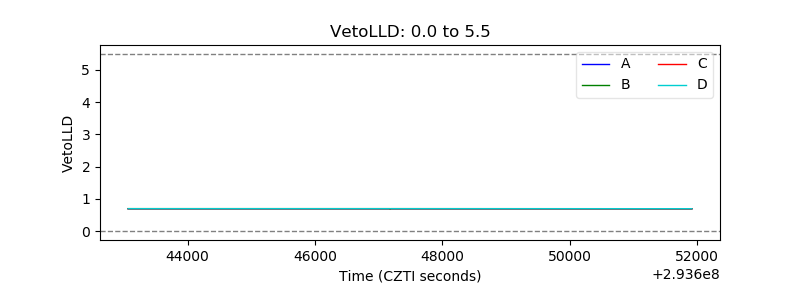 |
| Alpha Counter | 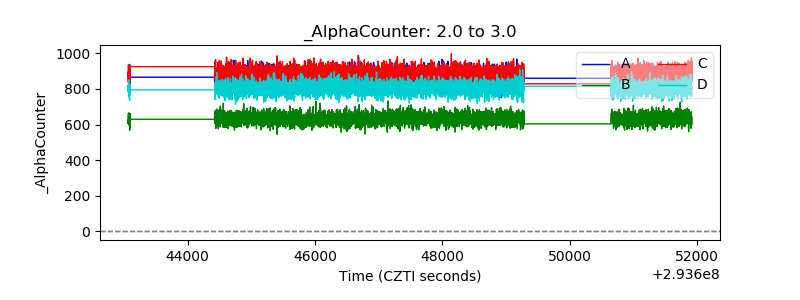 |
| _CPM_Rate | 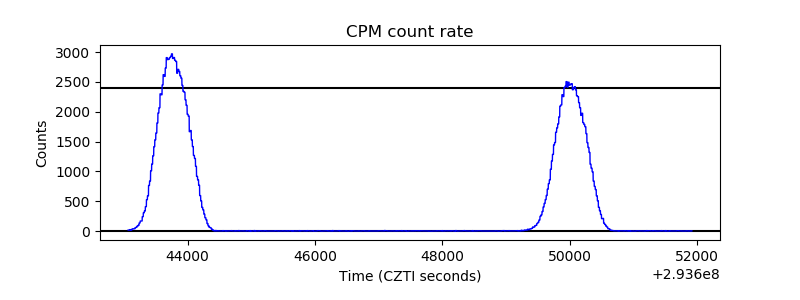 |
| CZT Counter | 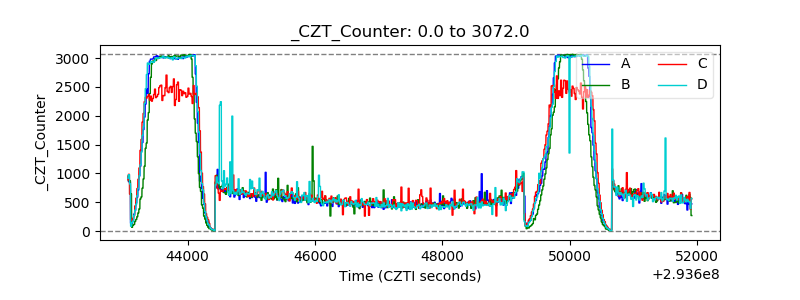 |
| +2.5 Volts monitor |  |
| +5 Volts monitor |  |
| _ROLL_ROT | 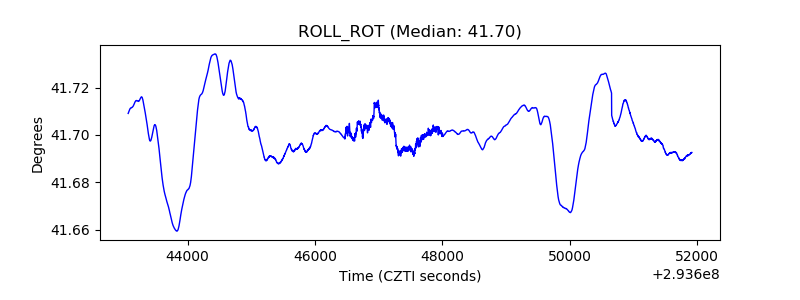 |
| _Roll_DEC | 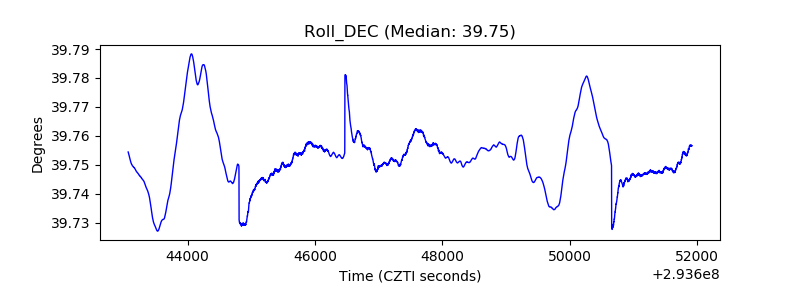 |
| _Roll_RA | 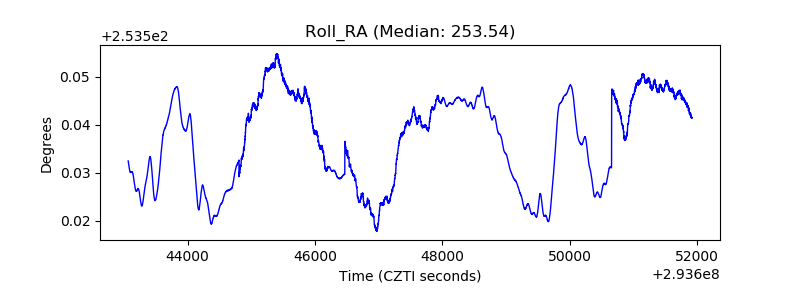 |
| Veto Counter | 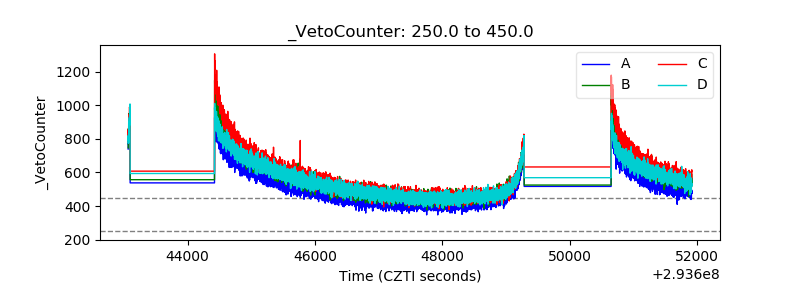 |