| Param | Original file | Final file |
|---|---|---|
| Filename | modeM0/AS1A05_107T01_9000002852_19282cztM0_level2.evt | modeM0/AS1A05_107T01_9000002852_19282cztM0_level2_quad_clean.evt |
| Size (bytes) | 455,952,960 | 105,382,080 |
| Size | 434.8 MB | 100.5 MB |
| Events in quadrant A | 3,203,893 | 679,162 |
| Events in quadrant B | 3,313,495 | 699,773 |
| Events in quadrant C | 3,535,268 | 688,133 |
| Events in quadrant D | 3,312,830 | 669,983 |
| Mode M0 | |||
|---|---|---|---|
| Quadrant | BADHDUFLAG | Total packets | Discarded packets |
| A | 0 | 13742 | 3 |
| B | 0 | 13990 | 2 |
| C | 0 | 14508 | 2 |
| D | 0 | 14066 | 2 |
| Mode SS | |||
|---|---|---|---|
| Quadrant | BADHDUFLAG | Total packets | Discarded packets |
| A | 0 | 134 | 0 |
| B | 0 | 134 | 0 |
| C | 0 | 134 | 0 |
| D | 0 | 134 | 0 |
| Mode M9 | |||
|---|---|---|---|
| Quadrant | BADHDUFLAG | Total packets | Discarded packets |
| A | 0 | 23 | 0 |
| B | 0 | 23 | 0 |
| C | 0 | 23 | 0 |
| D | 0 | 23 | 0 |
| Quadrant | Total seconds | Saturated seconds | Saturation percentage |
|---|---|---|---|
| A | 6518 | 104 | 1.595581% |
| B | 6518 | 132 | 2.025161% |
| C | 6518 | 216 | 3.313900% |
| D | 6519 | 101 | 1.549317% |
Noise dominated data is calculated using 1-second bins in cleaned event files. If a bin has >2000 counts, and if more than 50% of those come from <1% of pixels, then it is considered to be noise-dominated and hence unusable.
| Quadrant | # 1 sec bins | Bins with >0 counts | Bins with >2000 counts | High rate bins dominated by noise | Noise dominated (total time) | Noise dominated (detector-on time) | Marked lightcurve |
|---|---|---|---|---|---|---|---|
| A | 8843 | 6520 | 0 | 0 | 0.00% | 0.00% | 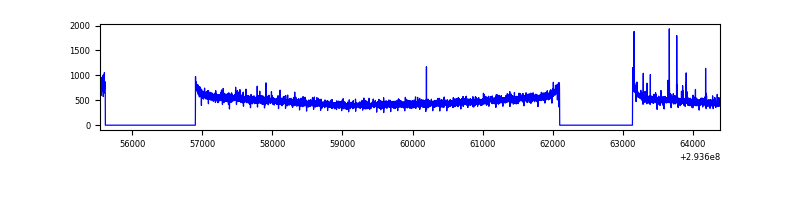 |
| B | 8843 | 6520 | 7 | 7 | 0.08% | 0.11% | 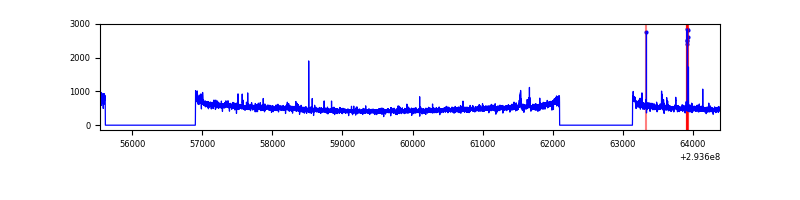 |
| C | 8843 | 6519 | 11 | 11 | 0.12% | 0.17% | 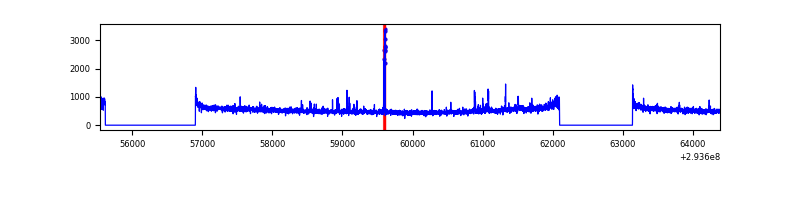 |
| D | 8844 | 6520 | 3 | 3 | 0.03% | 0.05% | 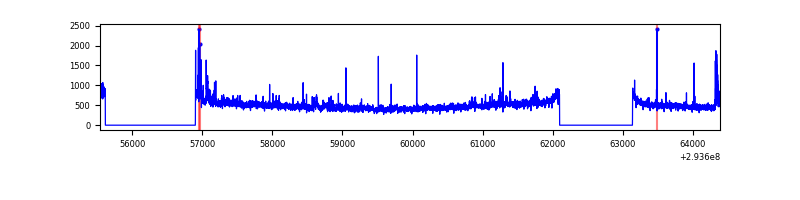 |
Top three noisy pixels from each quadrant. If the there are fewer than three noisy pixels in the level2.evt file, extra rows are filled as -1
| Pixel properties | Quadrant properties | ||||||
|---|---|---|---|---|---|---|---|
| Quadrant | DetID | PixID | Counts | Sigma | Mean | Median | Sigma |
| A | 5 | 16 | 23249 | 135.46 | 824 | 808 | 165.7 |
| A | 13 | 254 | 9111 | 50.12 | 824 | 808 | 165.7 |
| A | 0 | 226 | 6944 | 37.04 | 824 | 808 | 165.7 |
| B | 3 | 64 | 23409 | 143.11 | 829 | 809 | 157.9 |
| B | 12 | 111 | 18647 | 112.96 | 829 | 809 | 157.9 |
| B | 11 | 111 | 16645 | 100.28 | 829 | 809 | 157.9 |
| C | 3 | 233 | 206087 | 1092.58 | 811 | 819 | 187.9 |
| C | 14 | 238 | 124897 | 660.43 | 811 | 819 | 187.9 |
| C | 9 | 54 | 44577 | 232.91 | 811 | 819 | 187.9 |
| D | 7 | 223 | 75753 | 375.81 | 818 | 794 | 199.5 |
| D | 10 | 66 | 68534 | 339.62 | 818 | 794 | 199.5 |
| D | 13 | 138 | 50469 | 249.05 | 818 | 794 | 199.5 |
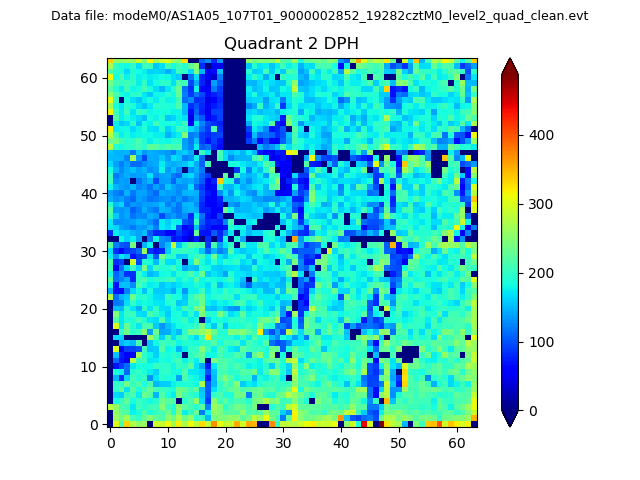
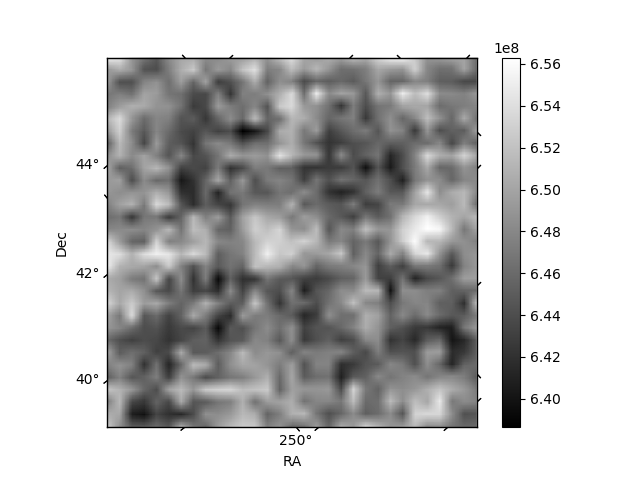
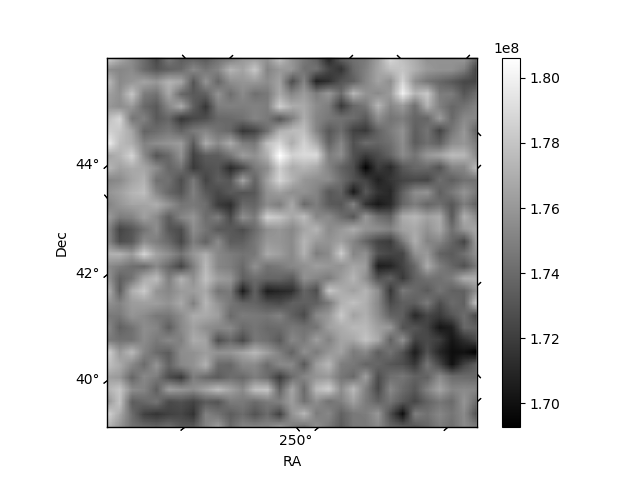
Histogram calculated using DETX and DETY for each event in the final _common_clean file
| Quadrant A | 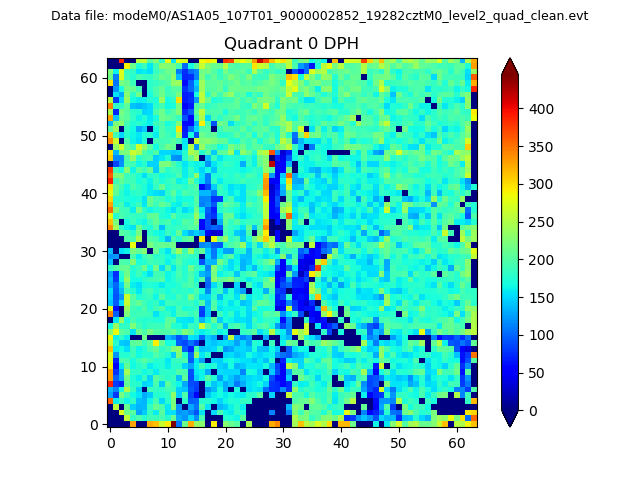 |
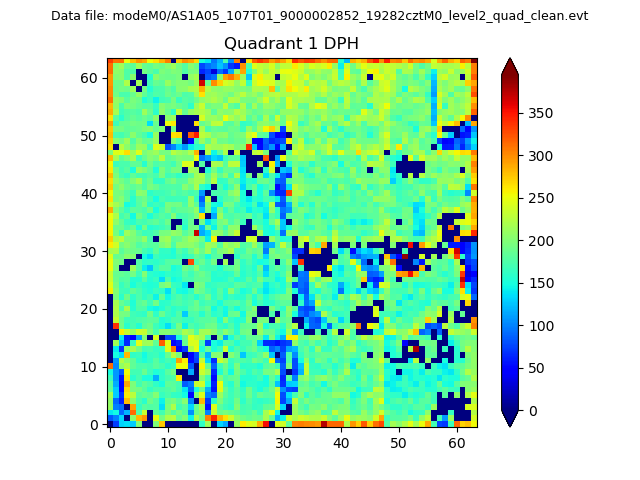 |
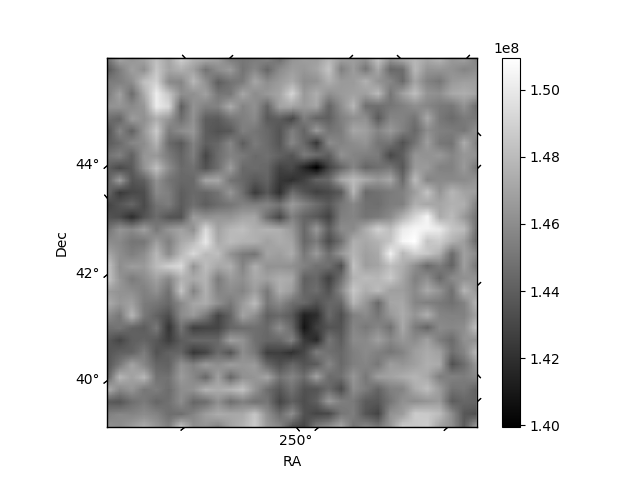
Quadrant B |
|---|---|---|---|
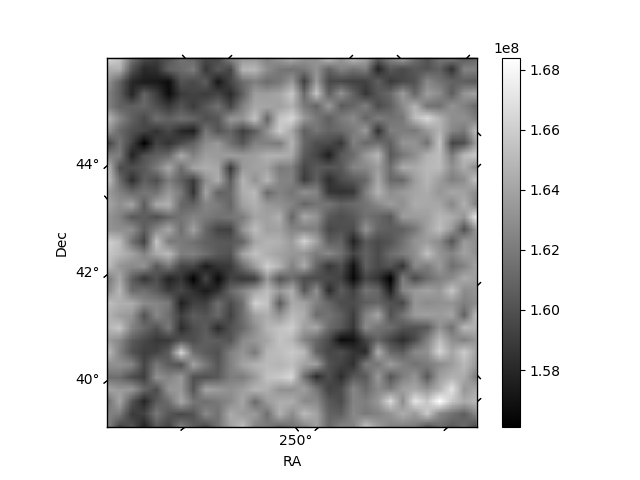
| Quadrant D | 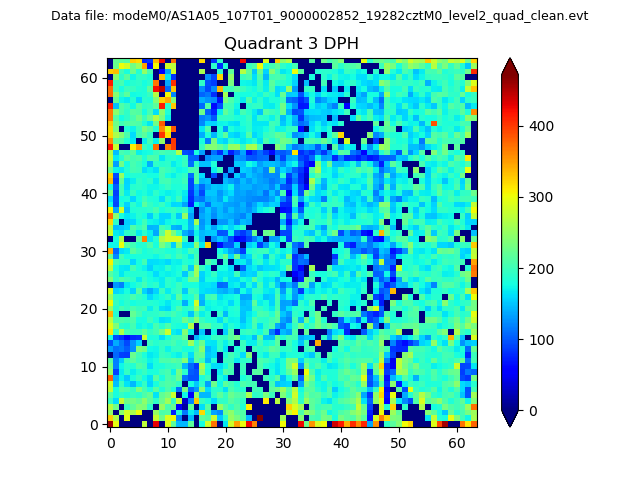 |
 |
Quadrant C |
| Plot type | Count rate plots | Images |
|---|---|---|
| Comparison with Poisson distribution Blue bars denote a histogram of data divided into 1 sec bins. Red curve is a Poisson curve with rate = median count rate of data. |
 |
 |
| Quadrant-wise count rates Data is divided into 100 sec bins |
 |
|
| Module-wise count rates for Quadrant A Data is divided into 100 sec bins |
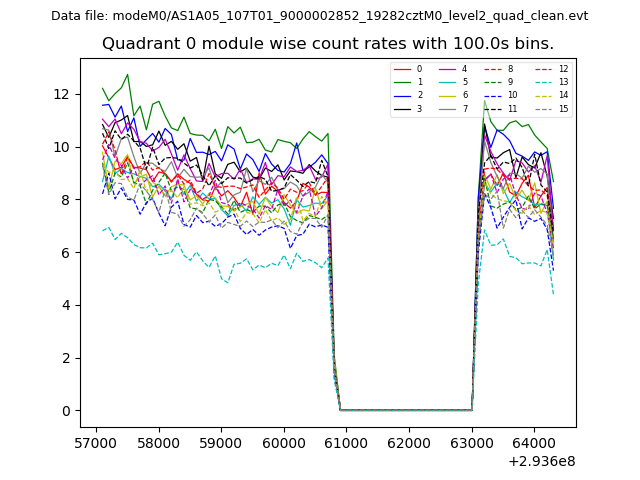 |
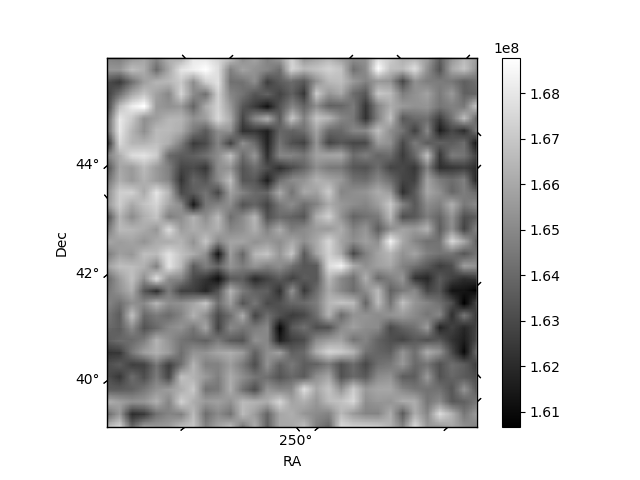 |
| Module-wise count rates for Quadrant B Data is divided into 100 sec bins |
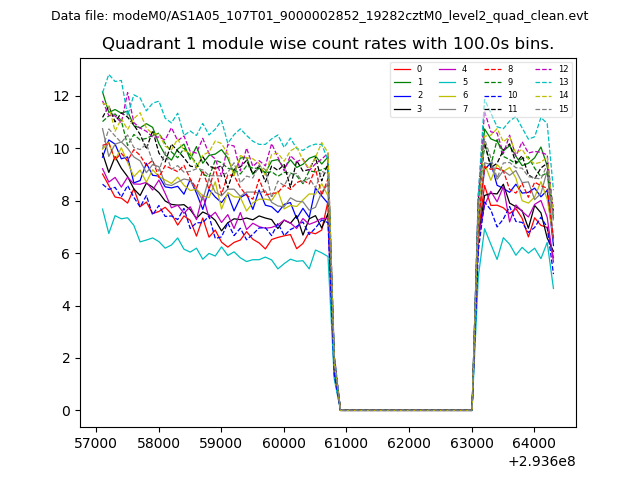 |
 |
| Module-wise count rates for Quadrant C Data is divided into 100 sec bins |
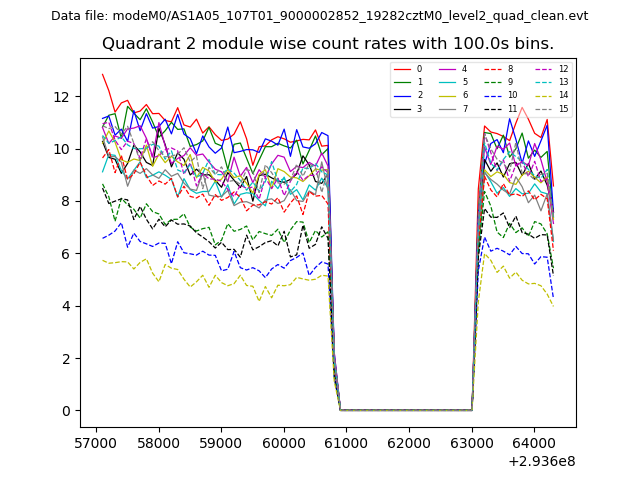 |
 |
| Module-wise count rates for Quadrant D Data is divided into 100 sec bins |
 |
 |
| Parameter | Plot |
|---|---|
| CZT HV Monitor | 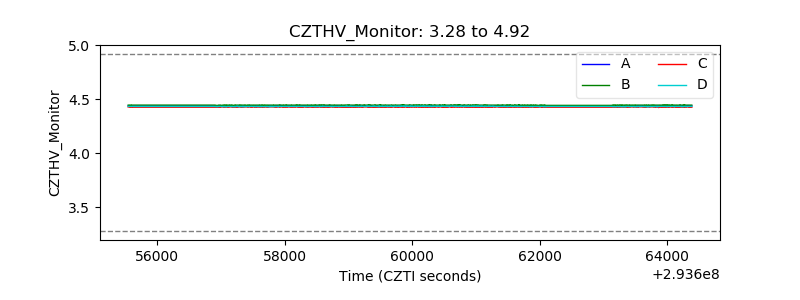 |
| D_VDD | 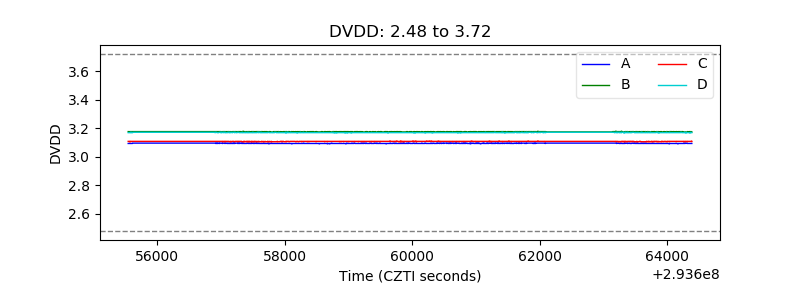 |
| Temperature 1 | 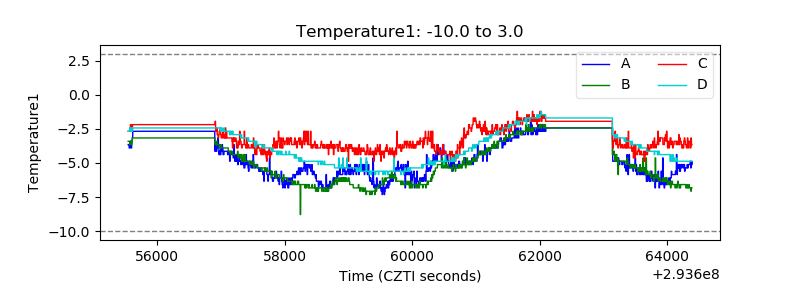 |
| Veto HV Monitor |  |
| Veto LLD | 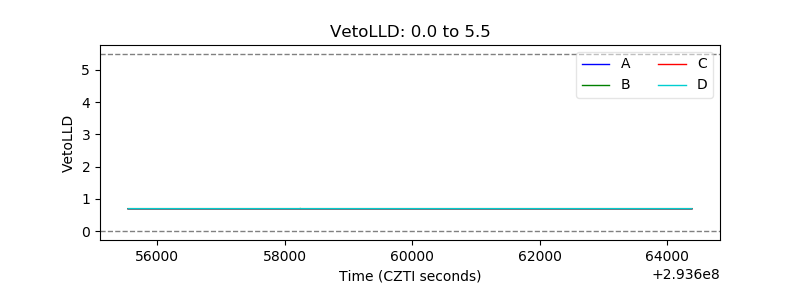 |
| Alpha Counter | 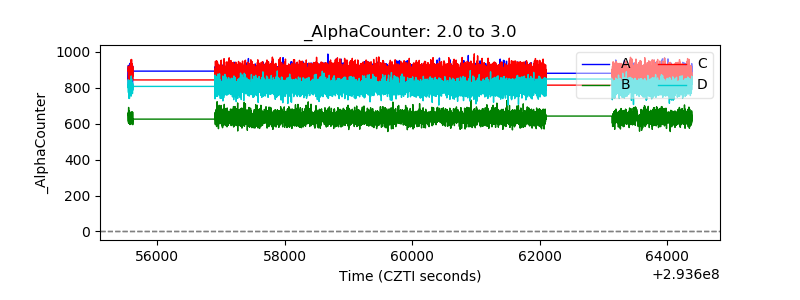 |
| _CPM_Rate | 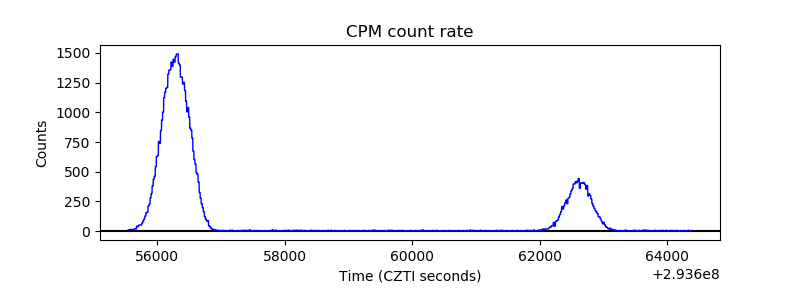 |
| CZT Counter | 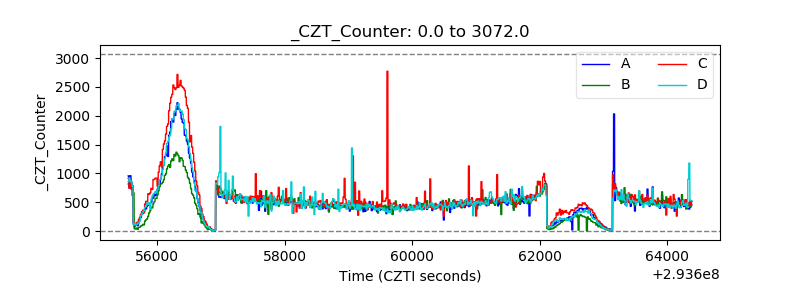 |
| +2.5 Volts monitor | 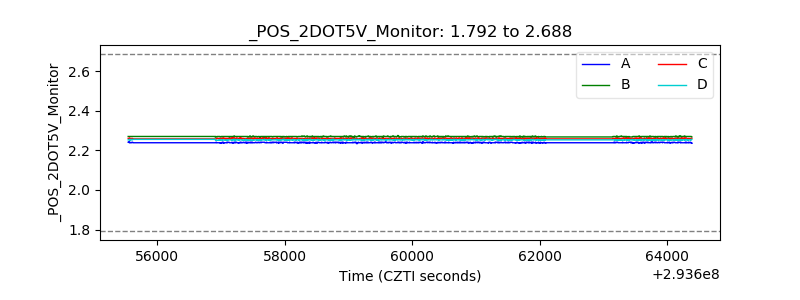 |
| +5 Volts monitor |  |
| _ROLL_ROT | 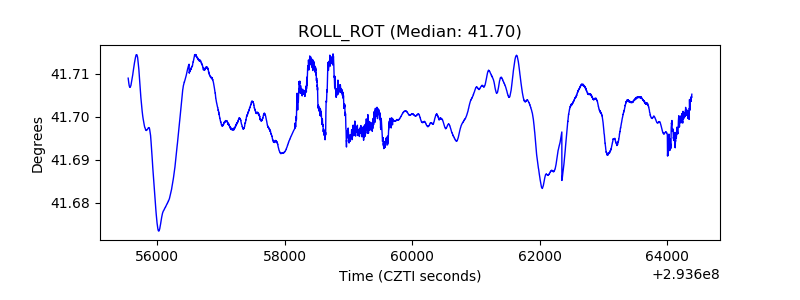 |
| _Roll_DEC | 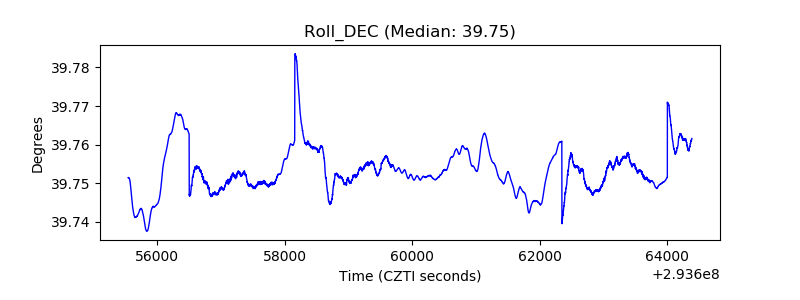 |
| _Roll_RA | 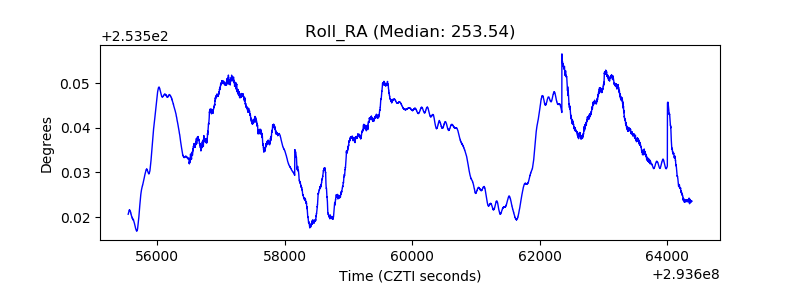 |
| Veto Counter | 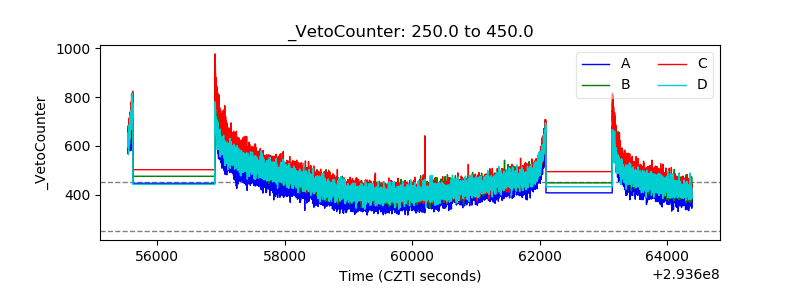 |