| Param | Original file | Final file |
|---|---|---|
| Filename | modeM0/AS1A05_107T01_9000002852_19283cztM0_level2.evt | modeM0/AS1A05_107T01_9000002852_19283cztM0_level2_quad_clean.evt |
| Size (bytes) | 565,986,240 | 100,454,400 |
| Size | 539.8 MB | 95.8 MB |
| Events in quadrant A | 3,800,896 | 625,739 |
| Events in quadrant B | 3,850,974 | 640,627 |
| Events in quadrant C | 3,957,919 | 631,622 |
| Events in quadrant D | 5,005,068 | 604,874 |
| Mode M0 | |||
|---|---|---|---|
| Quadrant | BADHDUFLAG | Total packets | Discarded packets |
| A | 0 | 16397 | 2 |
| B | 0 | 16434 | 2 |
| C | 0 | 16672 | 2 |
| D | 0 | 20018 | 2 |
| Mode SS | |||
|---|---|---|---|
| Quadrant | BADHDUFLAG | Total packets | Discarded packets |
| A | 0 | 160 | 0 |
| B | 0 | 160 | 0 |
| C | 0 | 160 | 0 |
| D | 0 | 160 | 0 |
| Mode M9 | |||
|---|---|---|---|
| Quadrant | BADHDUFLAG | Total packets | Discarded packets |
| A | 0 | 16 | 0 |
| B | 0 | 16 | 0 |
| C | 0 | 16 | 0 |
| D | 0 | 16 | 0 |
| Quadrant | Total seconds | Saturated seconds | Saturation percentage |
|---|---|---|---|
| A | 7751 | 70 | 0.903109% |
| B | 7752 | 107 | 1.380289% |
| C | 7752 | 179 | 2.309082% |
| D | 7751 | 250 | 3.225390% |
Noise dominated data is calculated using 1-second bins in cleaned event files. If a bin has >2000 counts, and if more than 50% of those come from <1% of pixels, then it is considered to be noise-dominated and hence unusable.
| Quadrant | # 1 sec bins | Bins with >0 counts | Bins with >2000 counts | High rate bins dominated by noise | Noise dominated (total time) | Noise dominated (detector-on time) | Marked lightcurve |
|---|---|---|---|---|---|---|---|
| A | 9421 | 7753 | 7 | 7 | 0.07% | 0.09% | 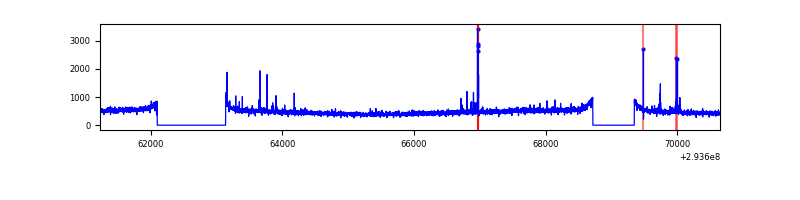 |
| B | 9422 | 7754 | 7 | 7 | 0.07% | 0.09% | 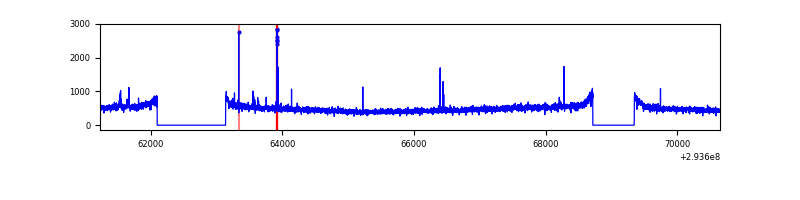 |
| C | 9422 | 7753 | 2 | 2 | 0.02% | 0.03% | 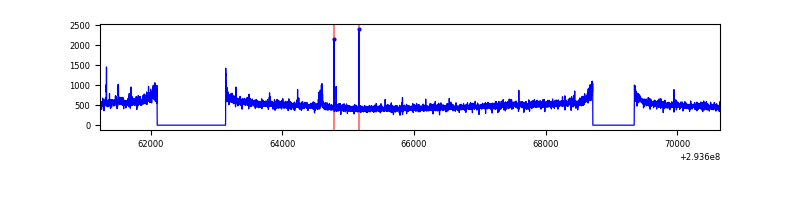 |
| D | 9421 | 7753 | 263 | 263 | 2.79% | 3.39% | 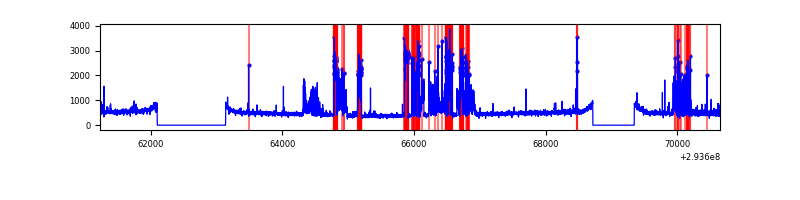 |
Top three noisy pixels from each quadrant. If the there are fewer than three noisy pixels in the level2.evt file, extra rows are filled as -1
| Pixel properties | Quadrant properties | ||||||
|---|---|---|---|---|---|---|---|
| Quadrant | DetID | PixID | Counts | Sigma | Mean | Median | Sigma |
| A | 5 | 16 | 79846 | 405.65 | 964 | 945 | 194.5 |
| A | 13 | 254 | 10175 | 47.45 | 964 | 945 | 194.5 |
| A | 0 | 226 | 8286 | 37.74 | 964 | 945 | 194.5 |
| B | 12 | 111 | 22766 | 117.4 | 968 | 942 | 185.9 |
| B | 3 | 64 | 21680 | 111.56 | 968 | 942 | 185.9 |
| B | 11 | 111 | 19994 | 102.49 | 968 | 942 | 185.9 |
| C | 14 | 238 | 146108 | 664.95 | 940 | 947 | 218.3 |
| C | 3 | 233 | 133115 | 605.43 | 940 | 947 | 218.3 |
| C | 9 | 54 | 11296 | 47.41 | 940 | 947 | 218.3 |
| D | 7 | 223 | 1354427 | 5877.9 | 941 | 913 | 230.3 |
| D | 10 | 66 | 40503 | 171.93 | 941 | 913 | 230.3 |
| D | 2 | 234 | 34790 | 147.12 | 941 | 913 | 230.3 |
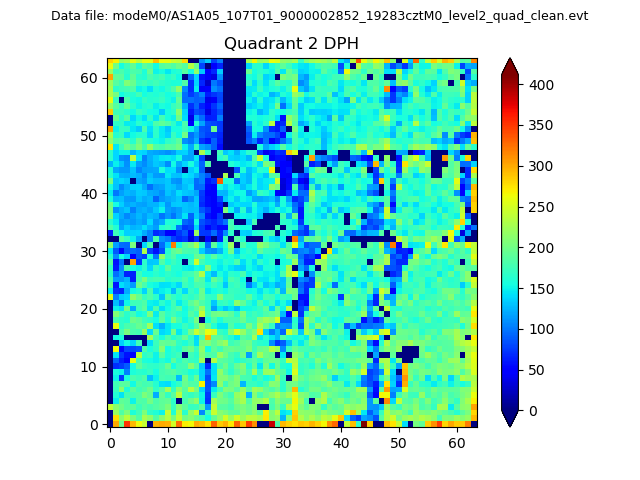
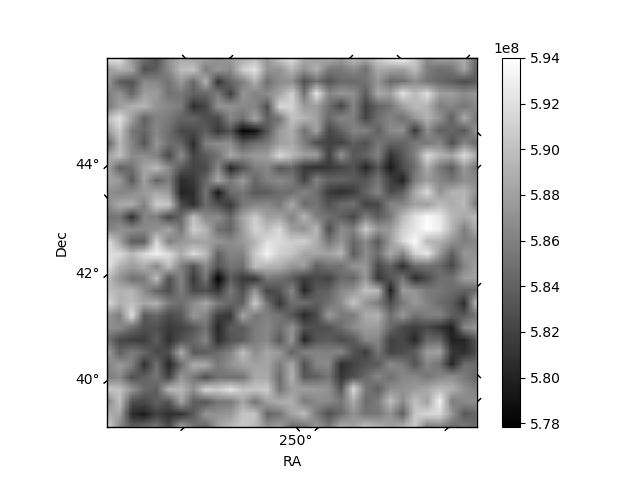
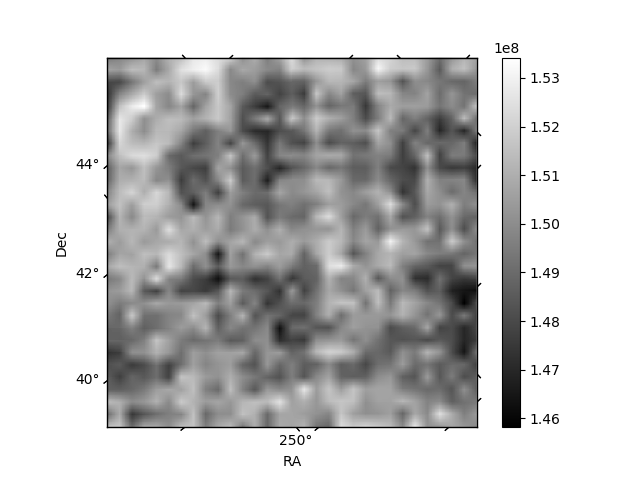
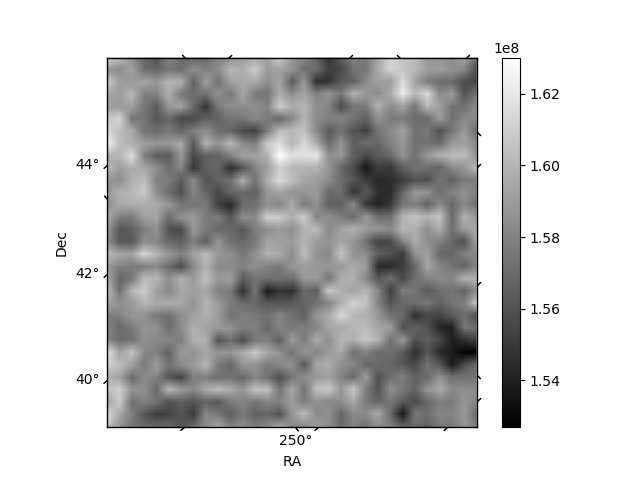
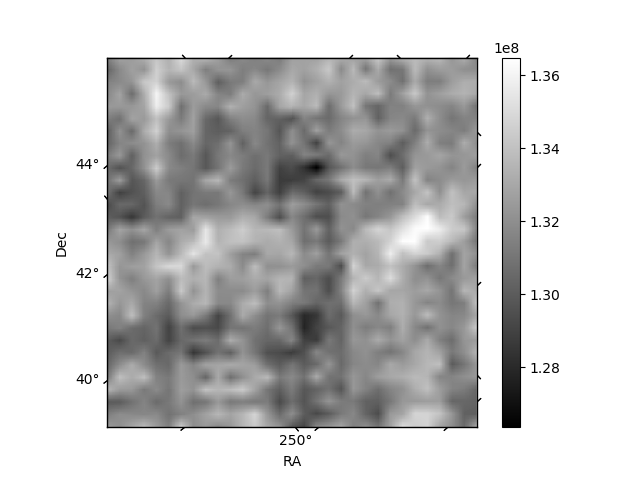
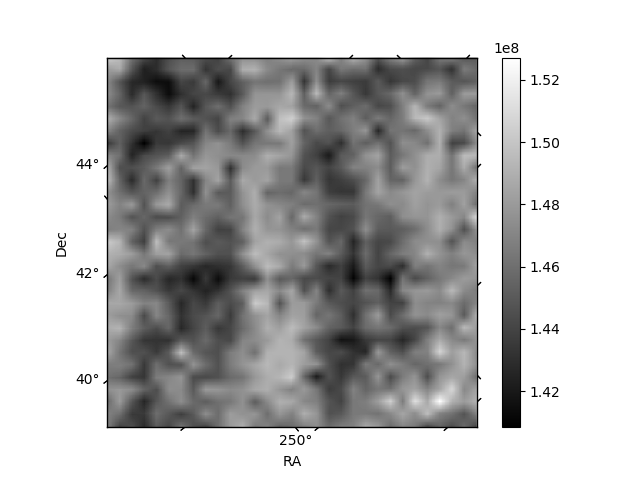
Histogram calculated using DETX and DETY for each event in the final _common_clean file
| Quadrant A | 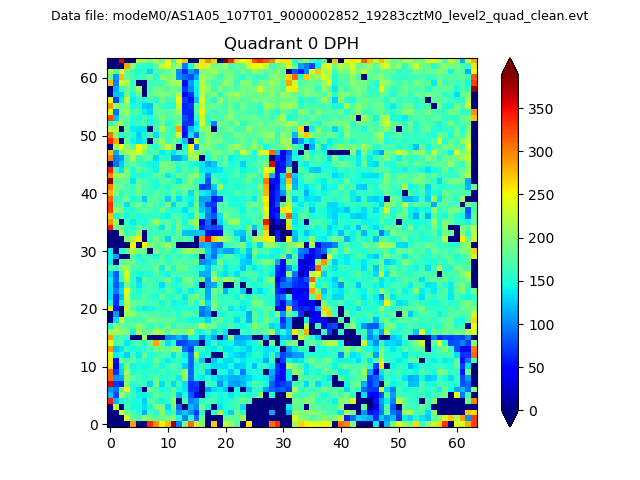 |
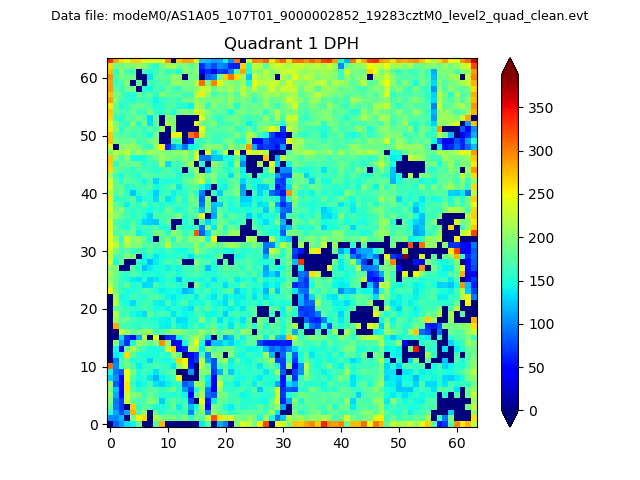 |
Quadrant B |
|---|---|---|---|
| Quadrant D | 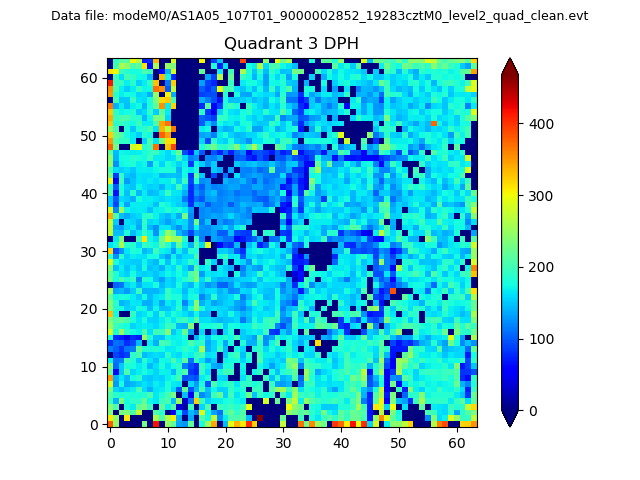 |
 |
Quadrant C |
| Plot type | Count rate plots | Images |
|---|---|---|
| Comparison with Poisson distribution Blue bars denote a histogram of data divided into 1 sec bins. Red curve is a Poisson curve with rate = median count rate of data. |
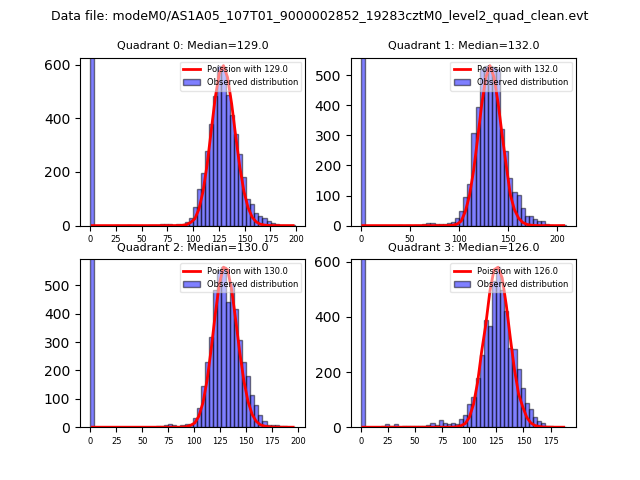 |
 |
| Quadrant-wise count rates Data is divided into 100 sec bins |
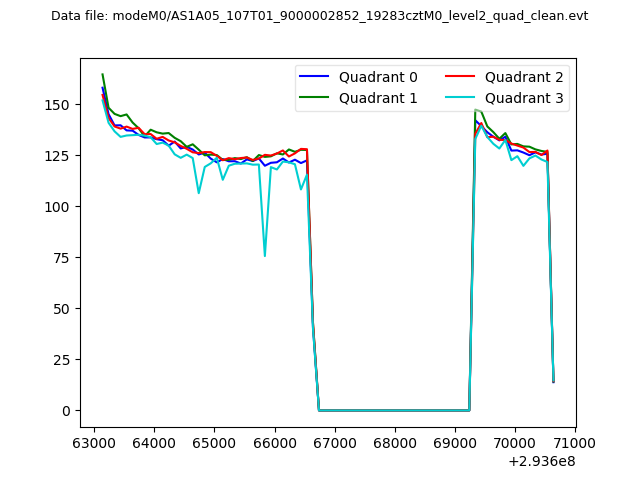 |
|
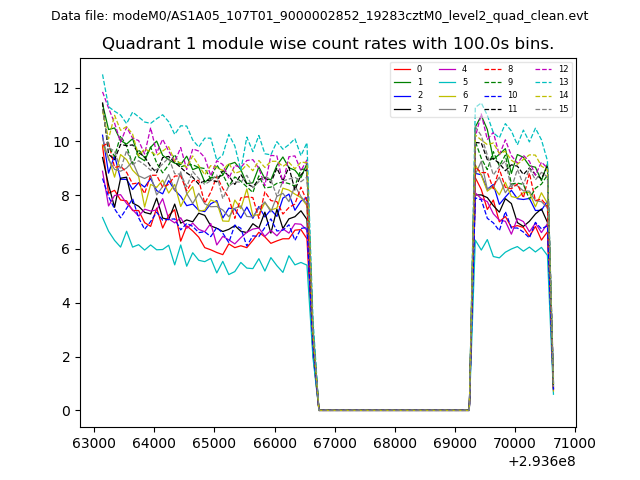
| Module-wise count rates for Quadrant A Data is divided into 100 sec bins |
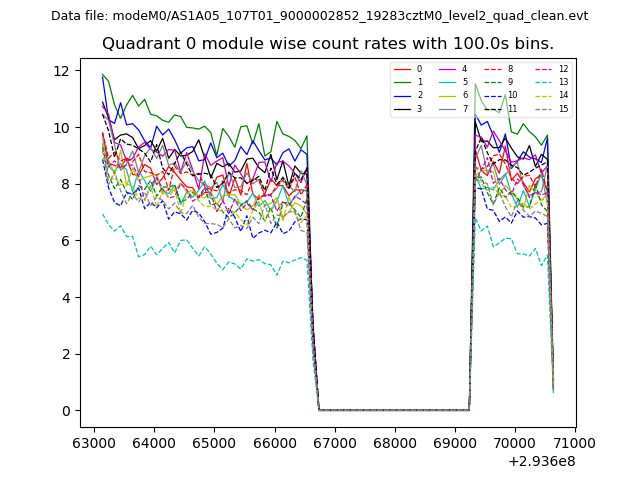 |
 |
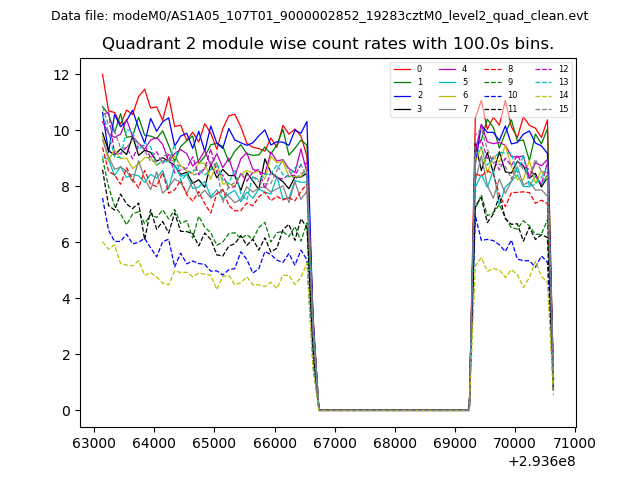
| Module-wise count rates for Quadrant B Data is divided into 100 sec bins |
 |
 |
| Module-wise count rates for Quadrant C Data is divided into 100 sec bins |
 |
 |
| Module-wise count rates for Quadrant D Data is divided into 100 sec bins |
 |
 |
| Parameter | Plot |
|---|---|
| CZT HV Monitor | 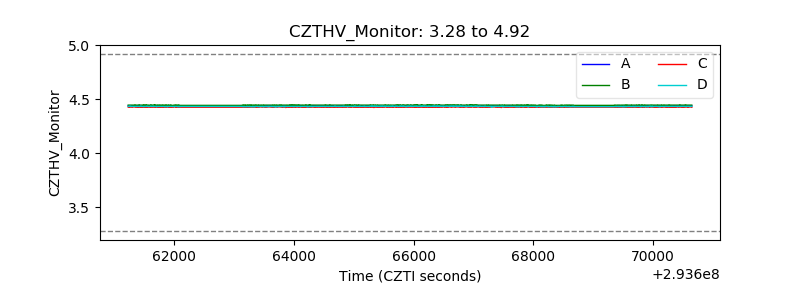 |
| D_VDD | 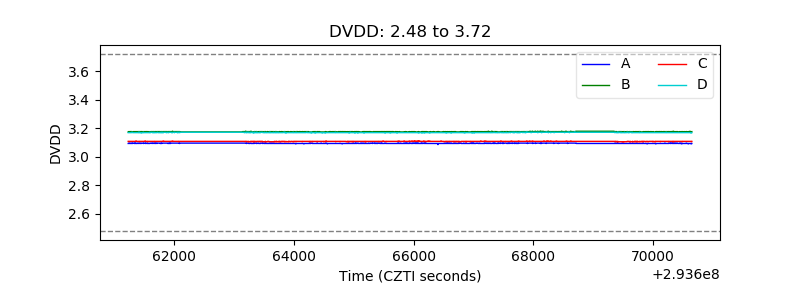 |
| Temperature 1 | 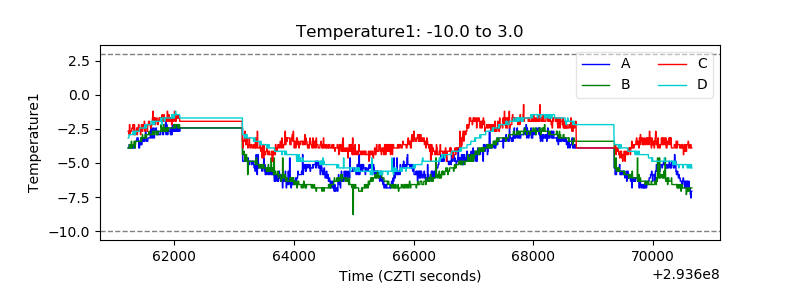 |
| Veto HV Monitor | 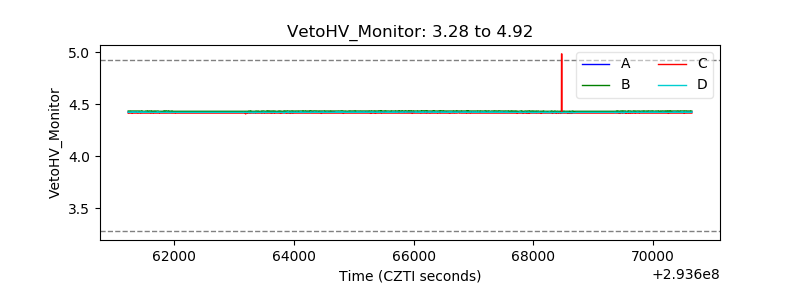 |
| Veto LLD | 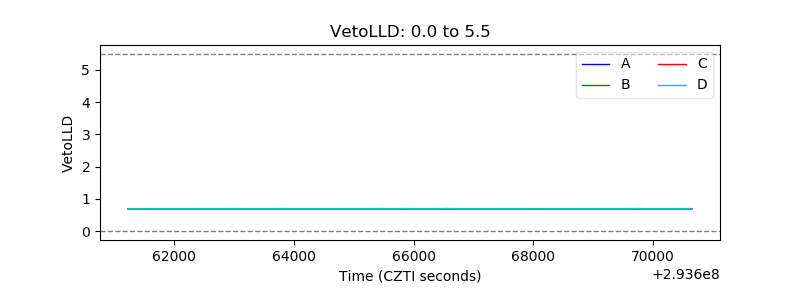 |
| Alpha Counter | 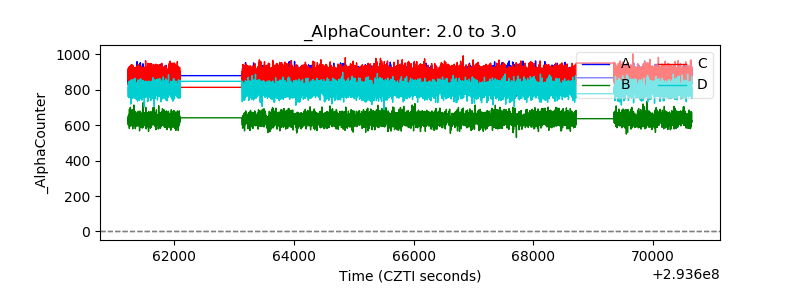 |
| _CPM_Rate | 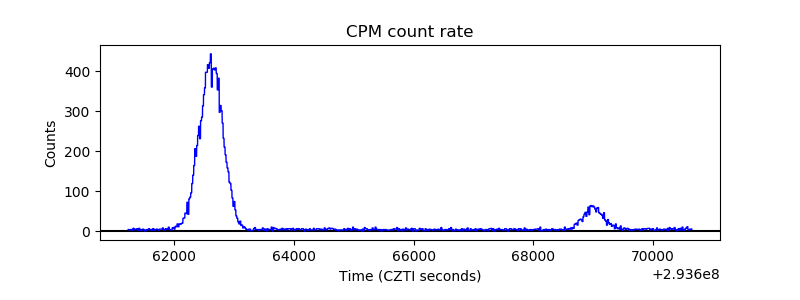 |
| CZT Counter | 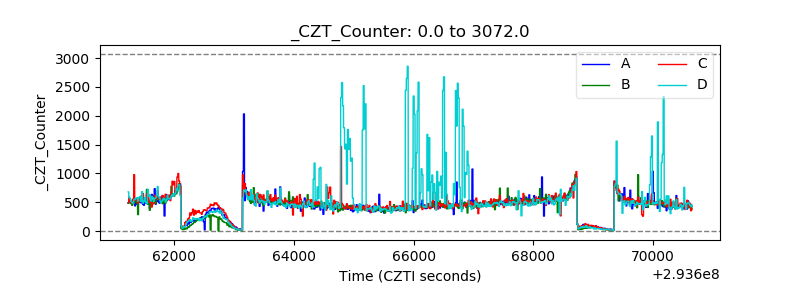 |
| +2.5 Volts monitor |  |
| +5 Volts monitor |  |
| _ROLL_ROT | 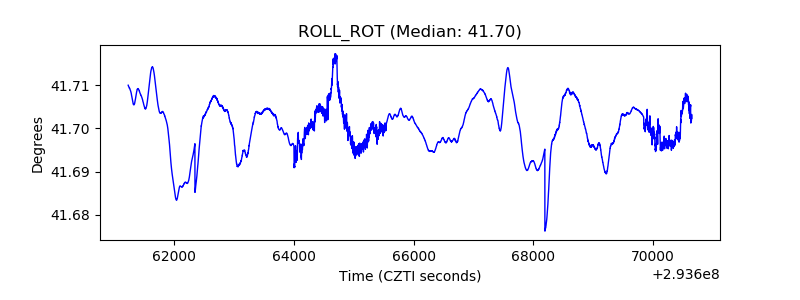 |
| _Roll_DEC | 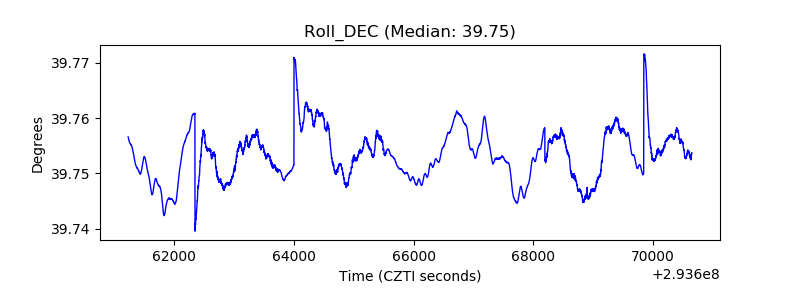 |
| _Roll_RA | 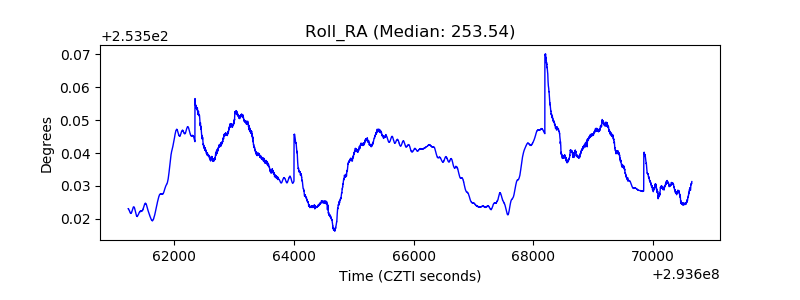 |
| Veto Counter | 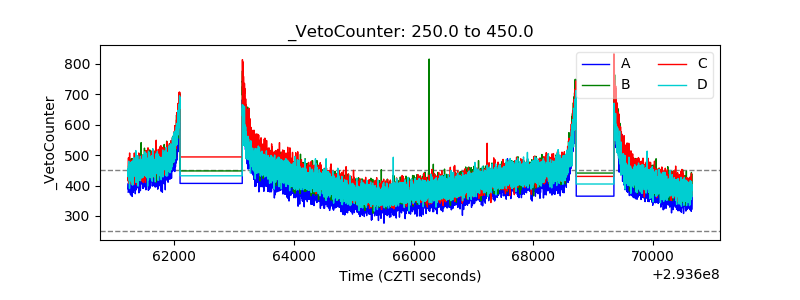 |