| Param | Original file | Final file |
|---|---|---|
| Filename | modeM0/AS1A05_107T01_9000002852_19285cztM0_level2.evt | modeM0/AS1A05_107T01_9000002852_19285cztM0_level2_quad_clean.evt |
| Size (bytes) | 601,390,080 | 121,893,120 |
| Size | 573.5 MB | 116.2 MB |
| Events in quadrant A | 4,038,346 | 784,841 |
| Events in quadrant B | 4,107,912 | 803,255 |
| Events in quadrant C | 4,159,177 | 782,695 |
| Events in quadrant D | 5,346,091 | 745,825 |
| Mode M0 | |||
|---|---|---|---|
| Quadrant | BADHDUFLAG | Total packets | Discarded packets |
| A | 0 | 17735 | 4 |
| B | 0 | 17813 | 3 |
| C | 0 | 17869 | 3 |
| D | 0 | 21677 | 3 |
| Mode SS | |||
|---|---|---|---|
| Quadrant | BADHDUFLAG | Total packets | Discarded packets |
| A | 0 | 168 | 0 |
| B | 0 | 168 | 0 |
| C | 0 | 168 | 0 |
| D | 0 | 168 | 0 |
| Mode M9 | |||
|---|---|---|---|
| Quadrant | BADHDUFLAG | Total packets | Discarded packets |
| A | 0 | 1 | 0 |
| B | 0 | 1 | 0 |
| C | 0 | 1 | 0 |
| D | 0 | 1 | 0 |
| Quadrant | Total seconds | Saturated seconds | Saturation percentage |
|---|---|---|---|
| A | 8268 | 284 | 3.434930% |
| B | 8269 | 383 | 4.631757% |
| C | 8269 | 421 | 5.091305% |
| D | 8269 | 501 | 6.058774% |
Noise dominated data is calculated using 1-second bins in cleaned event files. If a bin has >2000 counts, and if more than 50% of those come from <1% of pixels, then it is considered to be noise-dominated and hence unusable.
| Quadrant | # 1 sec bins | Bins with >0 counts | Bins with >2000 counts | High rate bins dominated by noise | Noise dominated (total time) | Noise dominated (detector-on time) | Marked lightcurve |
|---|---|---|---|---|---|---|---|
| A | 8388 | 8271 | 1 | 1 | 0.01% | 0.01% | 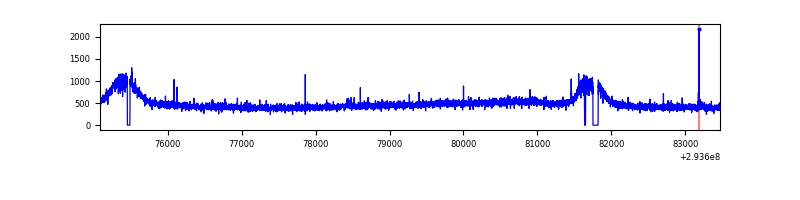 |
| B | 8389 | 8271 | 1 | 1 | 0.01% | 0.01% | 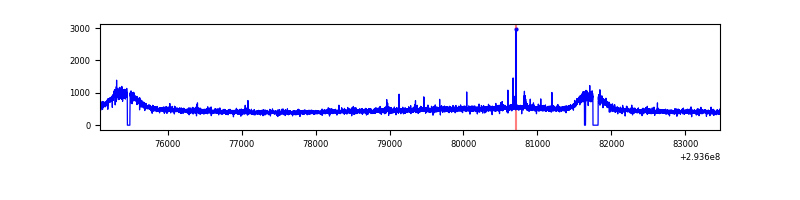 |
| C | 8389 | 8271 | 0 | 0 | 0.00% | 0.00% | 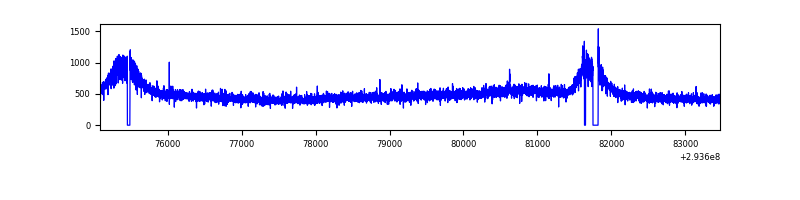 |
| D | 8389 | 8272 | 312 | 312 | 3.72% | 3.77% | 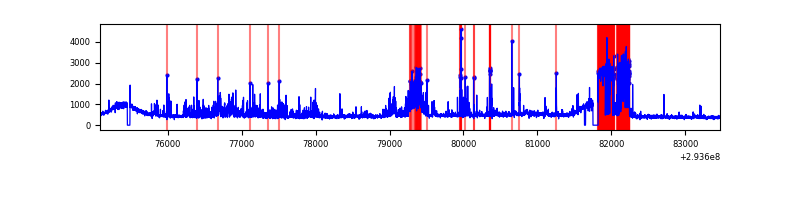 |
Top three noisy pixels from each quadrant. If the there are fewer than three noisy pixels in the level2.evt file, extra rows are filled as -1
| Pixel properties | Quadrant properties | ||||||
|---|---|---|---|---|---|---|---|
| Quadrant | DetID | PixID | Counts | Sigma | Mean | Median | Sigma |
| A | 13 | 254 | 12672 | 54.61 | 1043 | 1020 | 213.4 |
| A | 0 | 226 | 8987 | 37.34 | 1043 | 1020 | 213.4 |
| A | 3 | 137 | 8842 | 36.66 | 1043 | 1020 | 213.4 |
| B | 12 | 111 | 25722 | 121.77 | 1041 | 1010 | 202.9 |
| B | 11 | 111 | 22380 | 105.3 | 1041 | 1010 | 202.9 |
| B | 14 | 111 | 19778 | 92.48 | 1041 | 1010 | 202.9 |
| C | 14 | 238 | 153010 | 633.4 | 1011 | 1018 | 240.0 |
| C | 3 | 233 | 39079 | 158.61 | 1011 | 1018 | 240.0 |
| C | 8 | 128 | 12495 | 47.83 | 1011 | 1018 | 240.0 |
| D | 7 | 223 | 910093 | 3711.22 | 994 | 966 | 245.0 |
| D | 1 | 52 | 626299 | 2552.72 | 994 | 966 | 245.0 |
| D | 2 | 120 | 43090 | 171.96 | 994 | 966 | 245.0 |
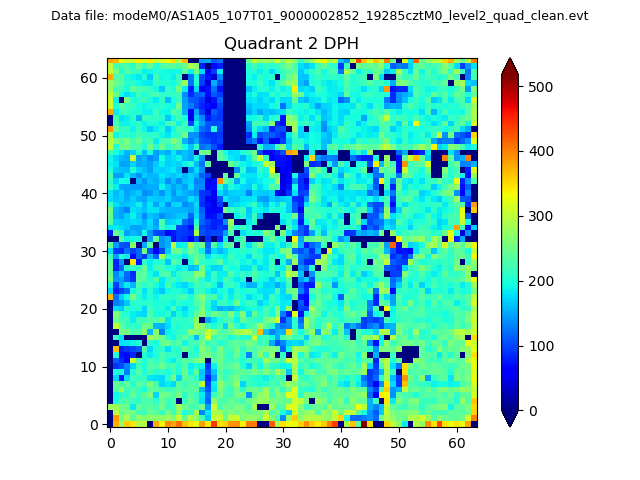
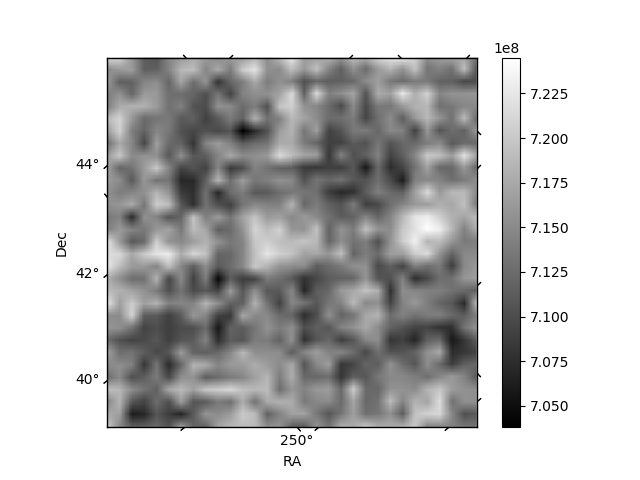
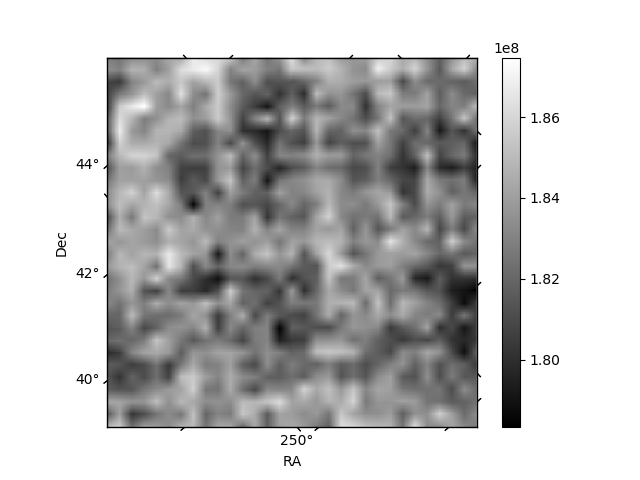
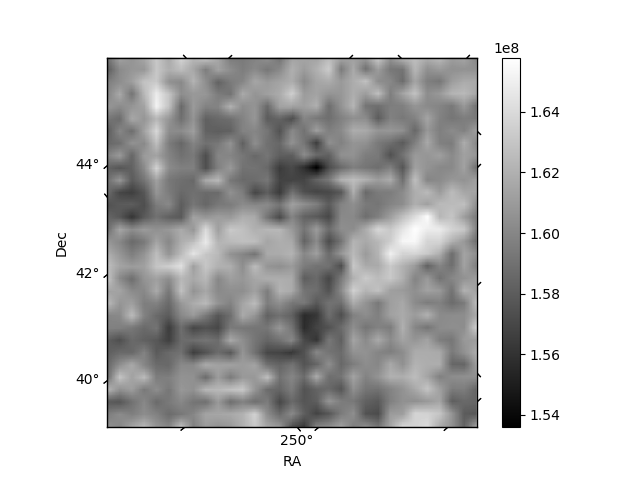
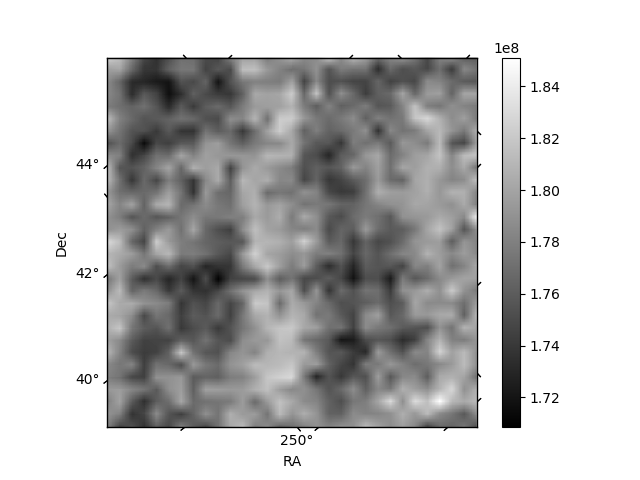
Histogram calculated using DETX and DETY for each event in the final _common_clean file
| Quadrant A | 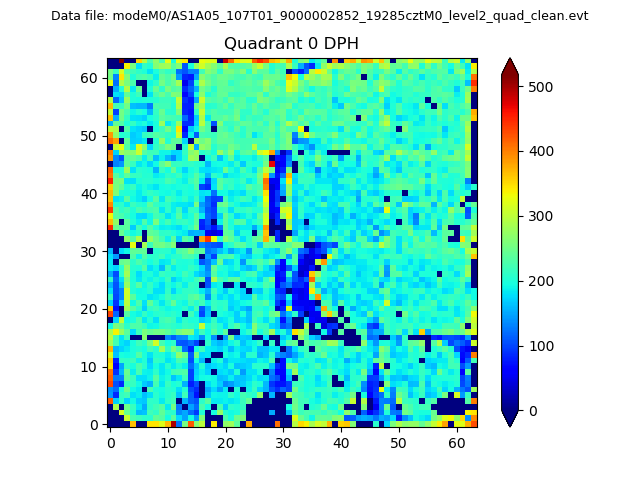 |
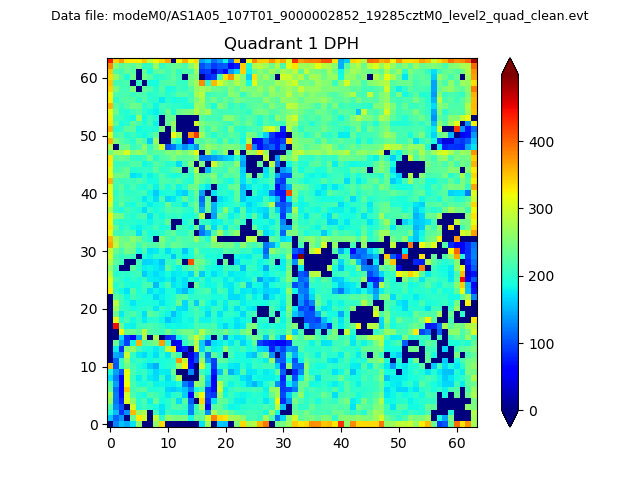 |
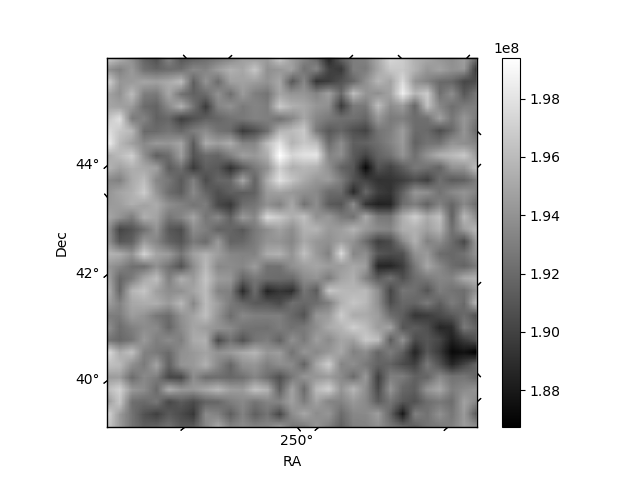
Quadrant B |
|---|---|---|---|
| Quadrant D | 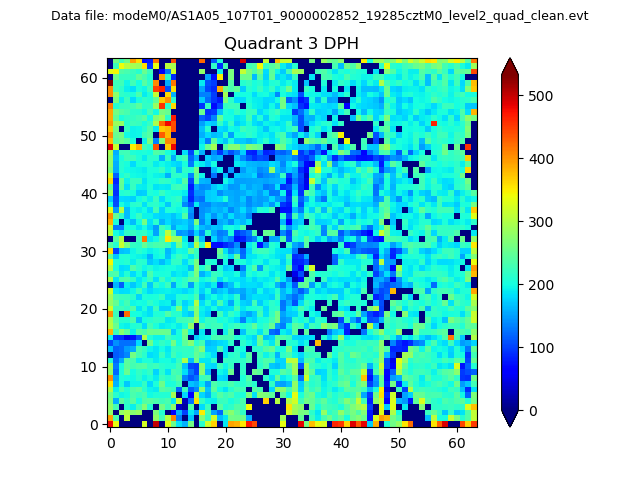 |
 |
Quadrant C |
| Plot type | Count rate plots | Images |
|---|---|---|
| Comparison with Poisson distribution Blue bars denote a histogram of data divided into 1 sec bins. Red curve is a Poisson curve with rate = median count rate of data. |
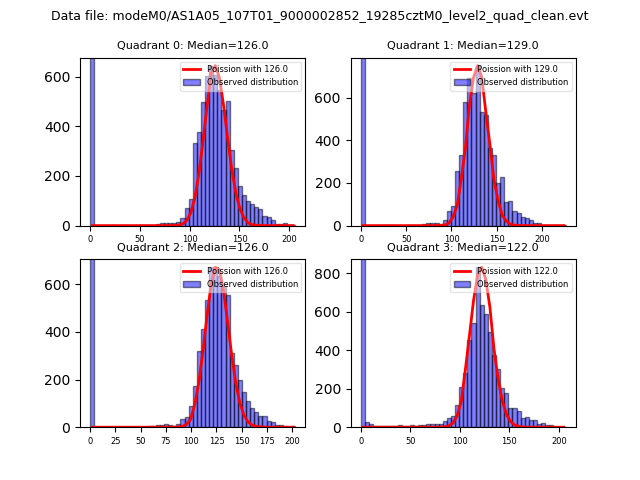 |
 |
| Quadrant-wise count rates Data is divided into 100 sec bins |
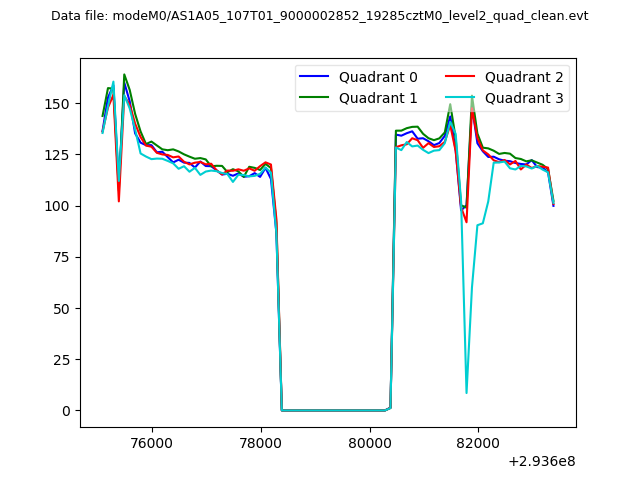 |
|
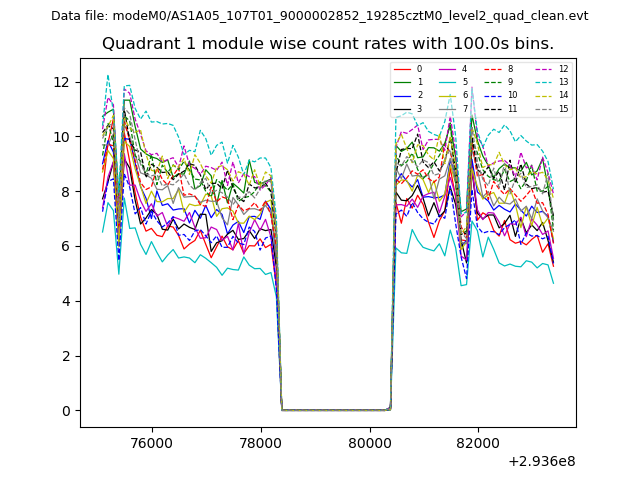
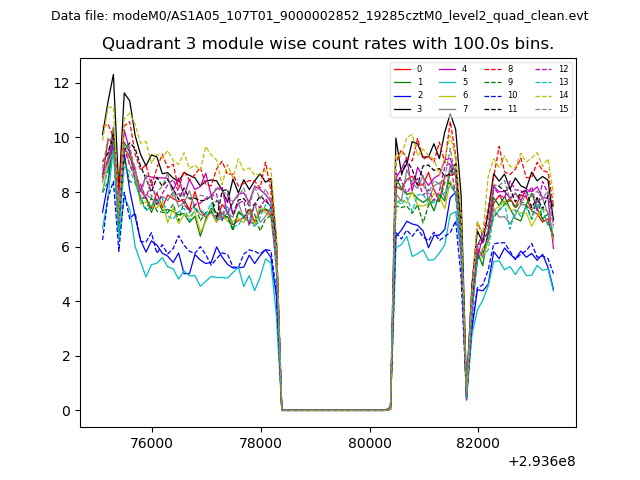
| Module-wise count rates for Quadrant A Data is divided into 100 sec bins |
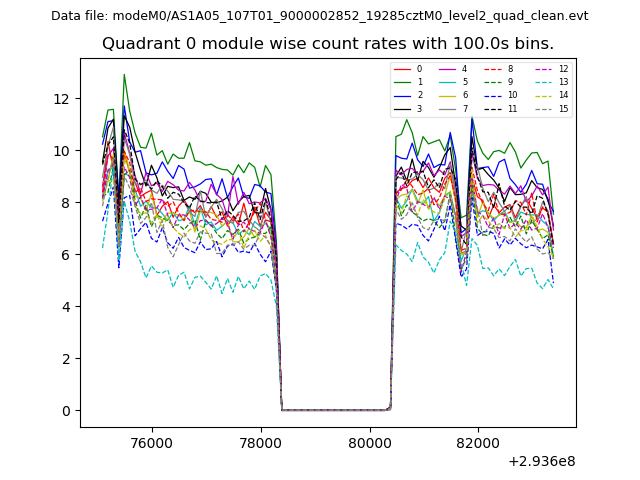 |
 |
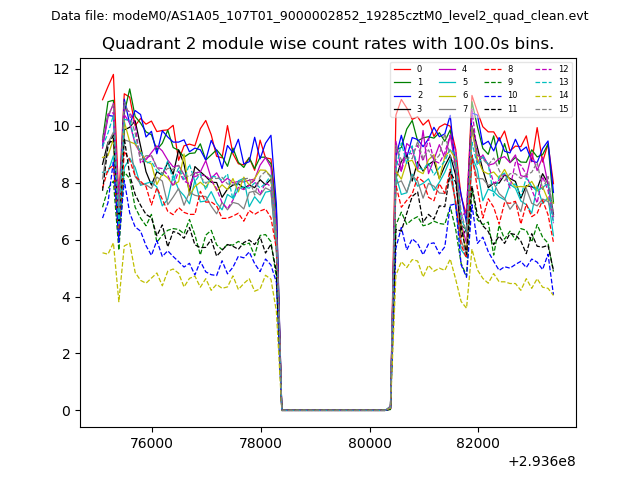
| Module-wise count rates for Quadrant B Data is divided into 100 sec bins |
 |
 |
| Module-wise count rates for Quadrant C Data is divided into 100 sec bins |
 |
 |
| Module-wise count rates for Quadrant D Data is divided into 100 sec bins |
 |
 |
| Parameter | Plot |
|---|---|
| CZT HV Monitor | 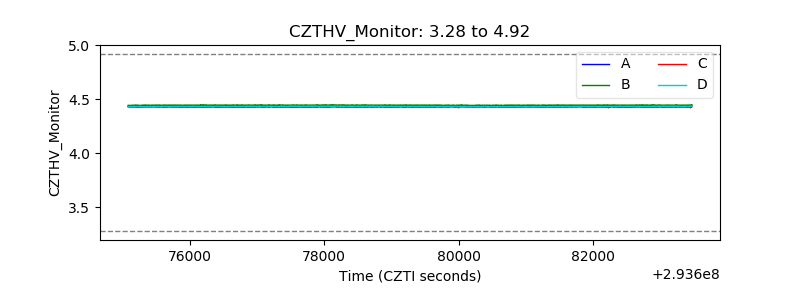 |
| D_VDD | 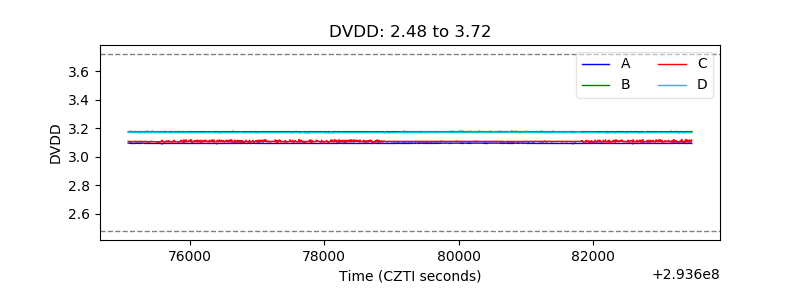 |
| Temperature 1 | 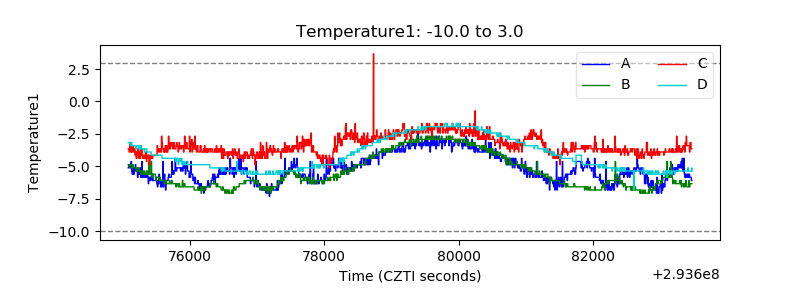 |
| Veto HV Monitor | 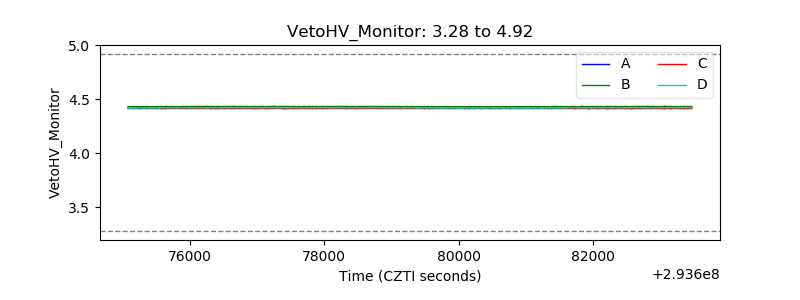 |
| Veto LLD | 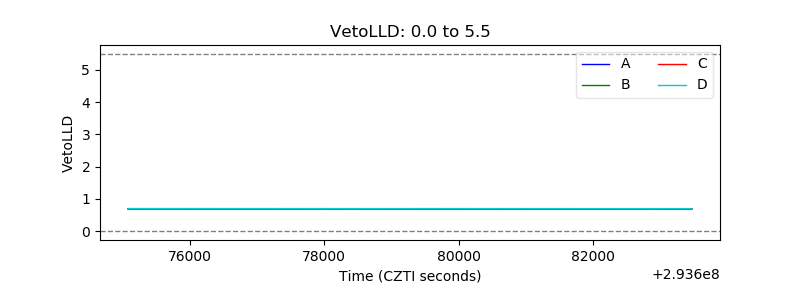 |
| Alpha Counter | 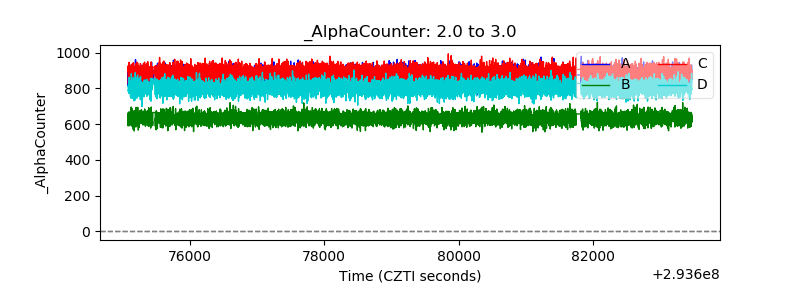 |
| _CPM_Rate | 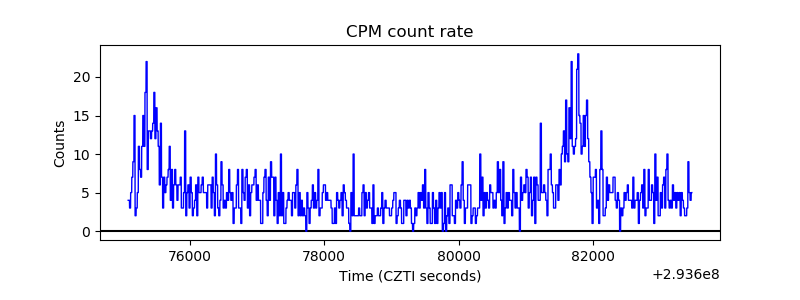 |
| CZT Counter | 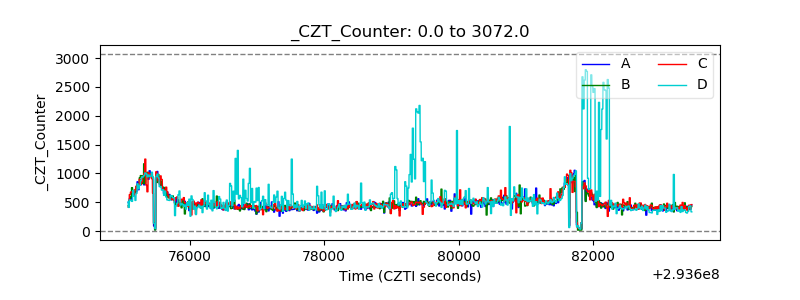 |
| +2.5 Volts monitor |  |
| +5 Volts monitor |  |
| _ROLL_ROT | 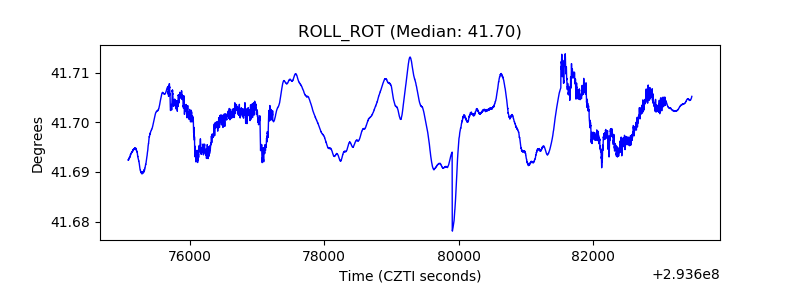 |
| _Roll_DEC | 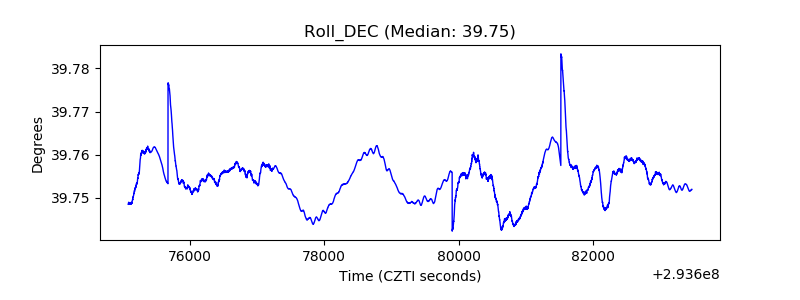 |
| _Roll_RA | 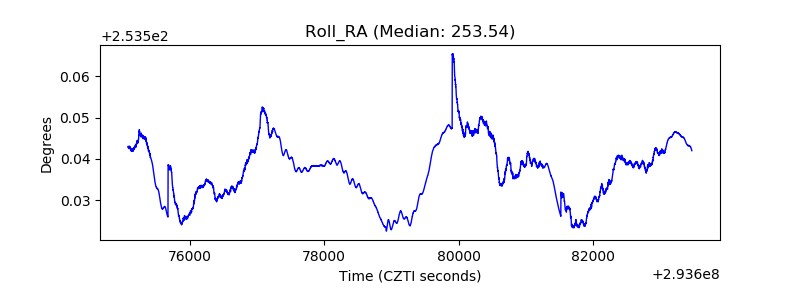 |
| Veto Counter | 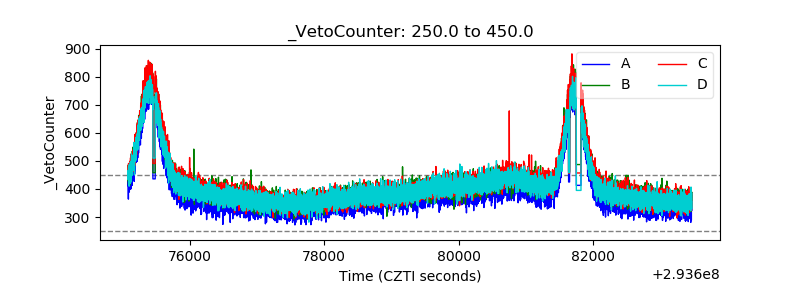 |