| Param | Original file | Final file |
|---|---|---|
| Filename | modeM0/AS1A05_107T01_9000002852_19286cztM0_level2.evt | modeM0/AS1A05_107T01_9000002852_19286cztM0_level2_quad_clean.evt |
| Size (bytes) | 369,492,480 | 65,727,360 |
| Size | 352.4 MB | 62.7 MB |
| Events in quadrant A | 2,526,057 | 408,805 |
| Events in quadrant B | 2,536,639 | 417,894 |
| Events in quadrant C | 2,552,149 | 408,997 |
| Events in quadrant D | 3,207,476 | 376,353 |
| Mode M0 | |||
|---|---|---|---|
| Quadrant | BADHDUFLAG | Total packets | Discarded packets |
| A | 0 | 11187 | 1 |
| B | 0 | 11168 | 1 |
| C | 0 | 11167 | 1 |
| D | 0 | 13534 | 1 |
| Mode SS | |||
|---|---|---|---|
| Quadrant | BADHDUFLAG | Total packets | Discarded packets |
| A | 0 | 108 | 0 |
| B | 0 | 108 | 0 |
| C | 0 | 108 | 0 |
| D | 0 | 108 | 0 |
| Mode M9 | |||
|---|---|---|---|
| Quadrant | BADHDUFLAG | Total packets | Discarded packets |
| A | 0 | 1 | 0 |
| B | 0 | 1 | 0 |
| C | 0 | 1 | 0 |
| D | 0 | 1 | 0 |
| Quadrant | Total seconds | Saturated seconds | Saturation percentage |
|---|---|---|---|
| A | 5403 | 71 | 1.314085% |
| B | 5403 | 98 | 1.813807% |
| C | 5404 | 109 | 2.017024% |
| D | 5404 | 331 | 6.125093% |
Noise dominated data is calculated using 1-second bins in cleaned event files. If a bin has >2000 counts, and if more than 50% of those come from <1% of pixels, then it is considered to be noise-dominated and hence unusable.
| Quadrant | # 1 sec bins | Bins with >0 counts | Bins with >2000 counts | High rate bins dominated by noise | Noise dominated (total time) | Noise dominated (detector-on time) | Marked lightcurve |
|---|---|---|---|---|---|---|---|
| A | 5473 | 5404 | 1 | 1 | 0.02% | 0.02% | 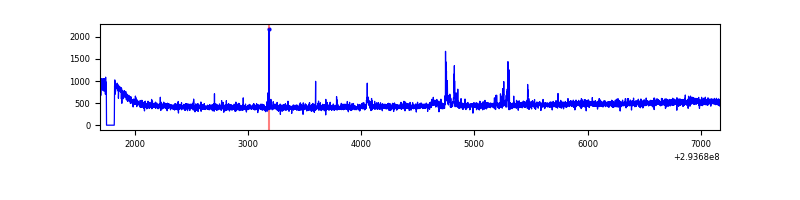 |
| B | 5473 | 5403 | 2 | 2 | 0.04% | 0.04% | 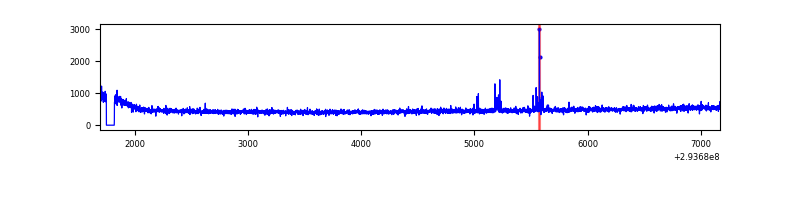 |
| C | 5474 | 5405 | 0 | 0 | 0.00% | 0.00% | 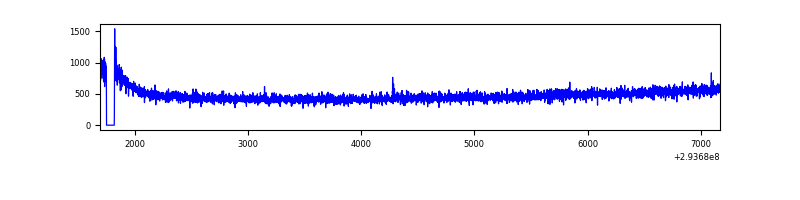 |
| D | 5474 | 5405 | 263 | 263 | 4.80% | 4.87% | 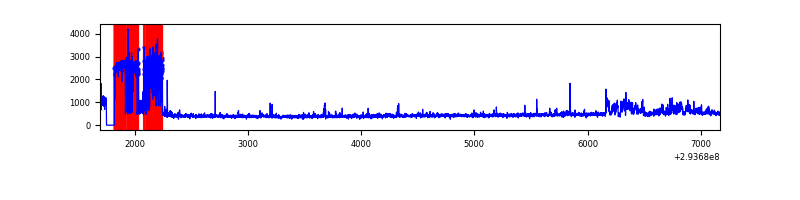 |
Top three noisy pixels from each quadrant. If the there are fewer than three noisy pixels in the level2.evt file, extra rows are filled as -1
| Pixel properties | Quadrant properties | ||||||
|---|---|---|---|---|---|---|---|
| Quadrant | DetID | PixID | Counts | Sigma | Mean | Median | Sigma |
| A | 9 | 143 | 42005 | 316.66 | 641 | 627 | 130.7 |
| A | 13 | 254 | 8060 | 56.88 | 641 | 627 | 130.7 |
| A | 0 | 226 | 5548 | 37.66 | 641 | 627 | 130.7 |
| B | 12 | 111 | 15141 | 116.18 | 640 | 621 | 125.0 |
| B | 0 | 190 | 15080 | 115.69 | 640 | 621 | 125.0 |
| B | 11 | 111 | 13812 | 105.55 | 640 | 621 | 125.0 |
| C | 14 | 238 | 95868 | 648.45 | 620 | 623 | 146.9 |
| C | 3 | 233 | 17654 | 115.95 | 620 | 623 | 146.9 |
| C | 8 | 128 | 12587 | 81.45 | 620 | 623 | 146.9 |
| D | 7 | 223 | 682901 | 4669.32 | 600 | 583 | 146.1 |
| D | 13 | 138 | 161659 | 1102.3 | 600 | 583 | 146.1 |
| D | 1 | 52 | 75400 | 512.0 | 600 | 583 | 146.1 |
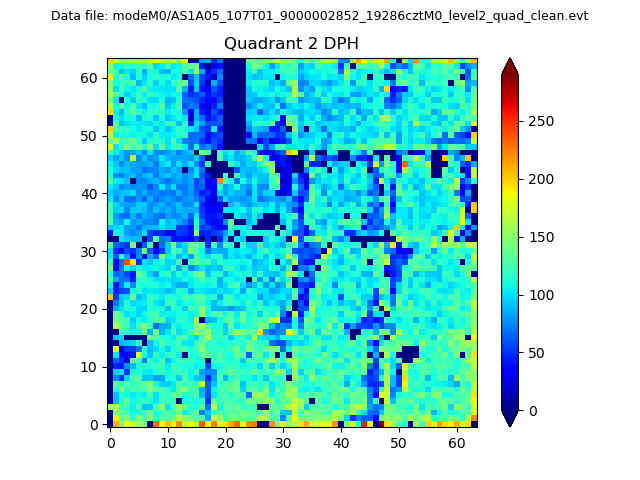
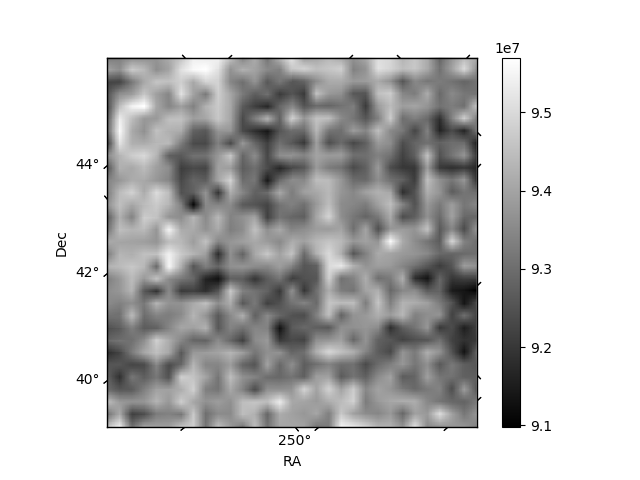
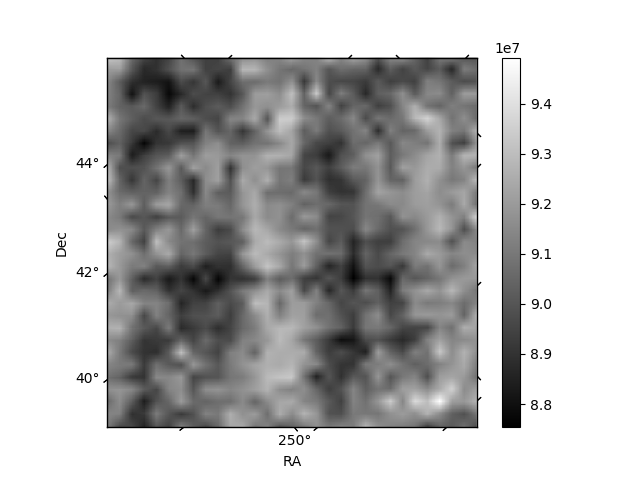
Histogram calculated using DETX and DETY for each event in the final _common_clean file
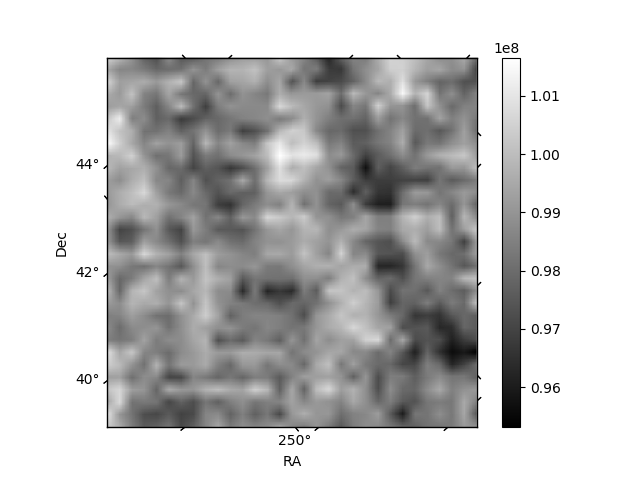
| Quadrant A | 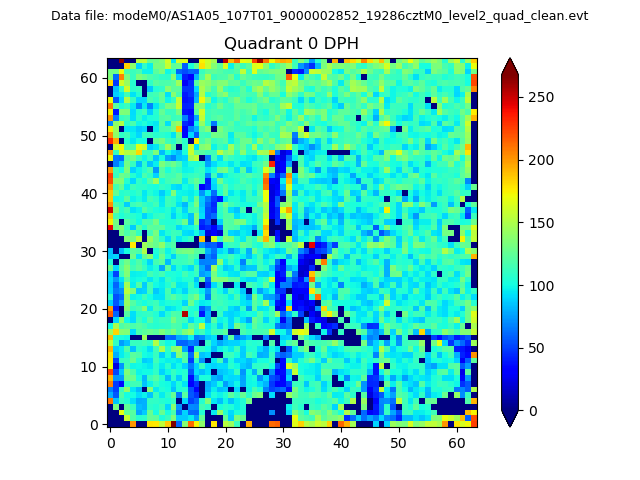 |
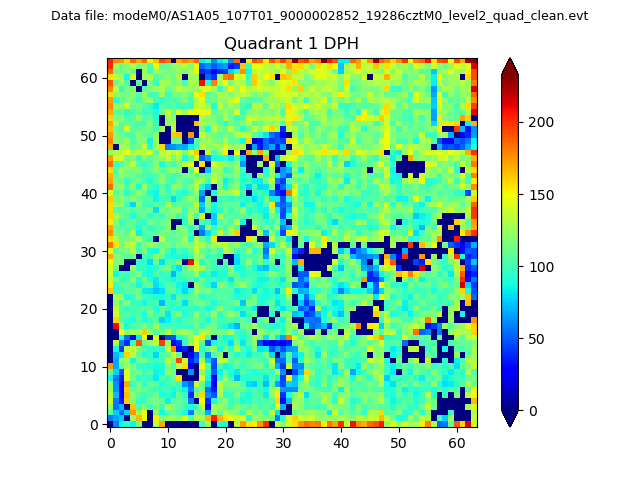 |
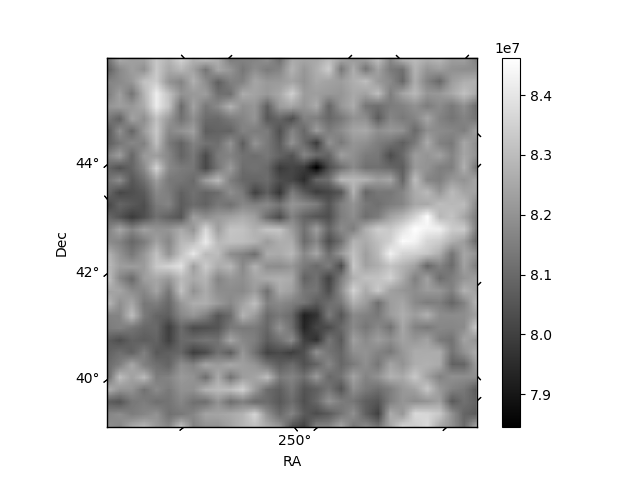
Quadrant B |
|---|---|---|---|
| Quadrant D | 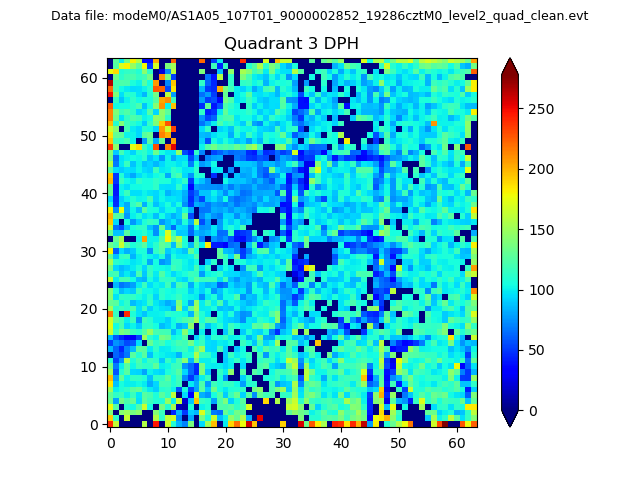 |
 |
Quadrant C |
| Plot type | Count rate plots | Images |
|---|---|---|
| Comparison with Poisson distribution Blue bars denote a histogram of data divided into 1 sec bins. Red curve is a Poisson curve with rate = median count rate of data. |
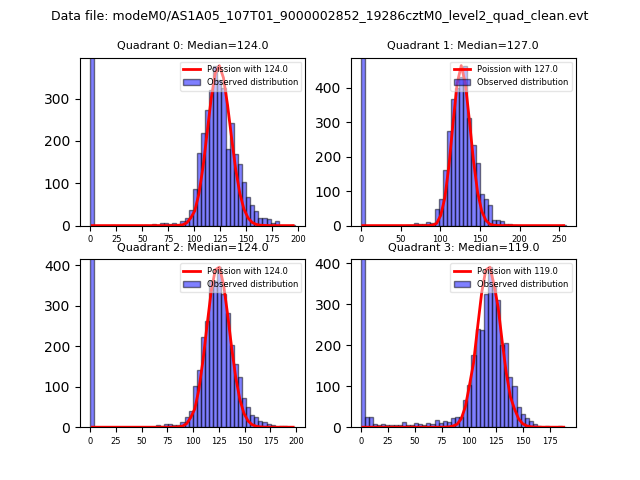 |
 |
| Quadrant-wise count rates Data is divided into 100 sec bins |
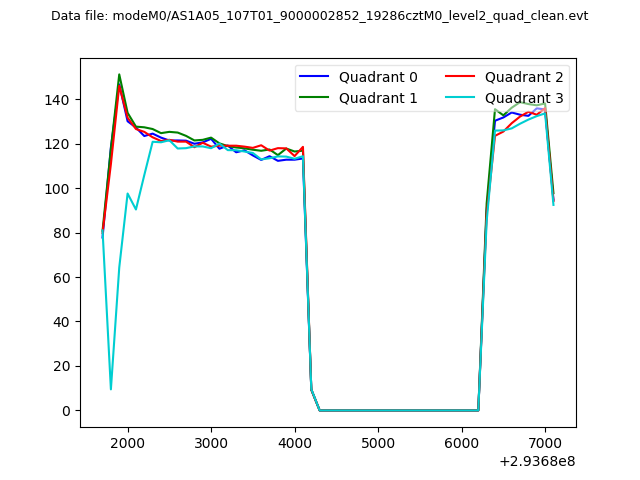 |
|
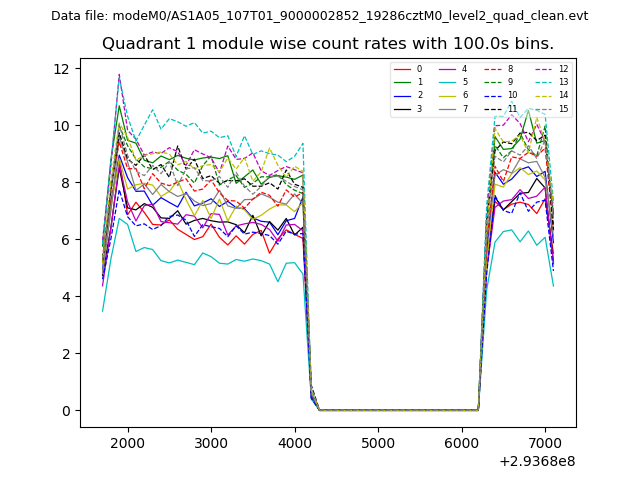
| Module-wise count rates for Quadrant A Data is divided into 100 sec bins |
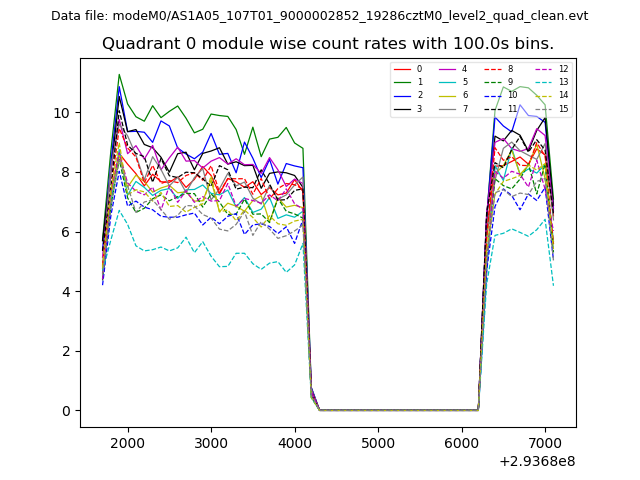 |
 |
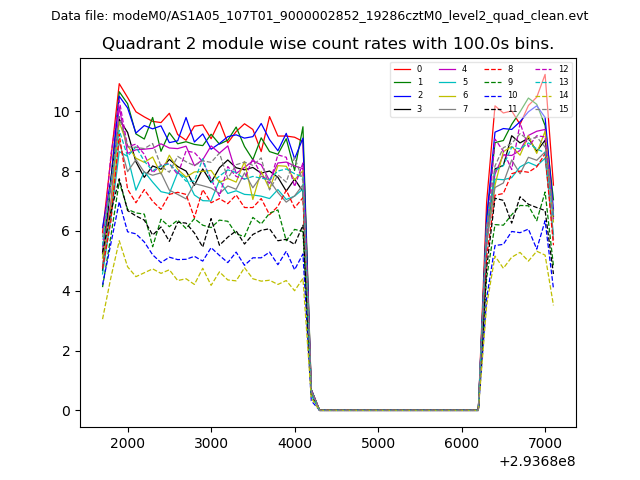
| Module-wise count rates for Quadrant B Data is divided into 100 sec bins |
 |
 |
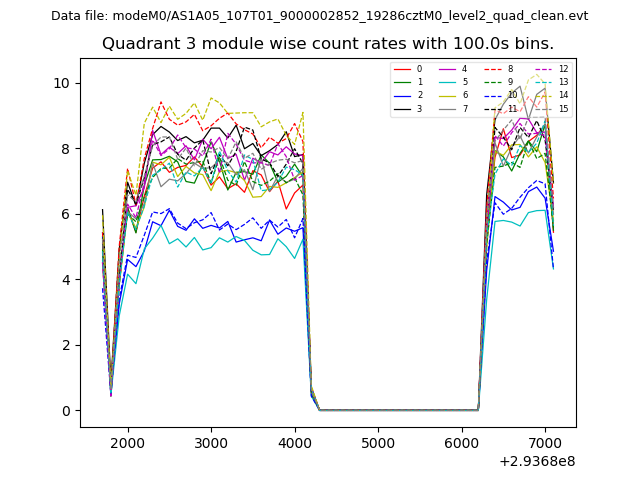
| Module-wise count rates for Quadrant C Data is divided into 100 sec bins |
 |
 |
| Module-wise count rates for Quadrant D Data is divided into 100 sec bins |
 |
 |
| Parameter | Plot |
|---|---|
| CZT HV Monitor | 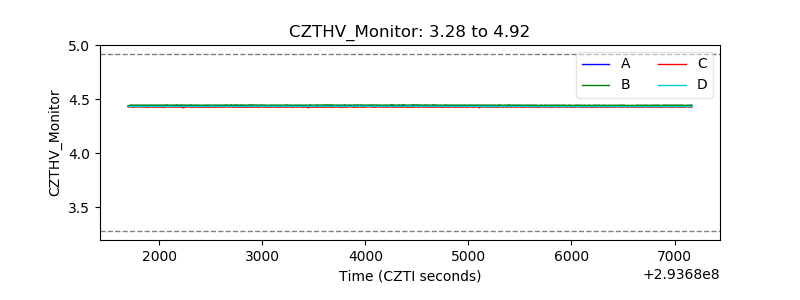 |
| D_VDD | 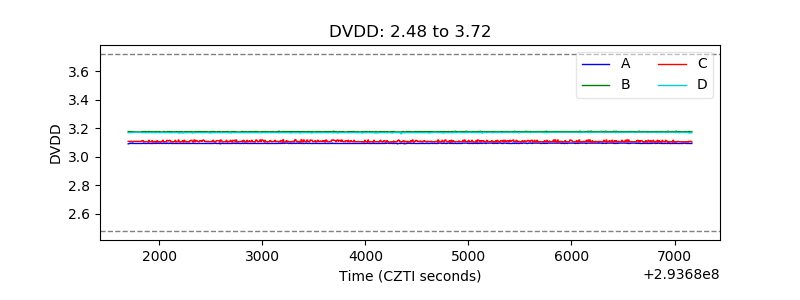 |
| Temperature 1 | 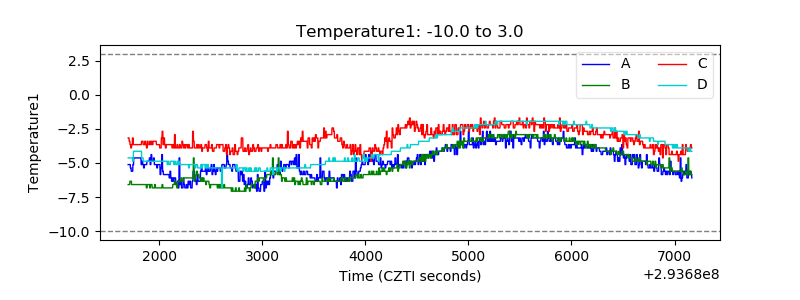 |
| Veto HV Monitor | 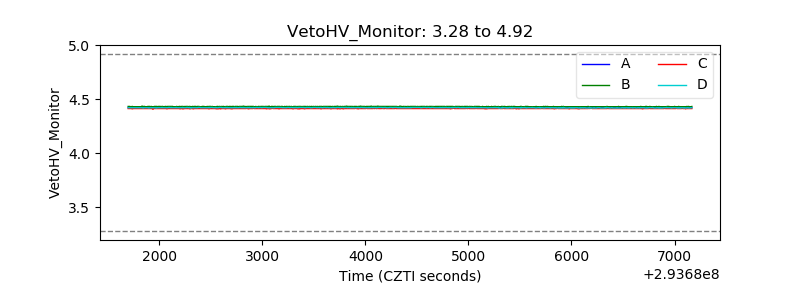 |
| Veto LLD | 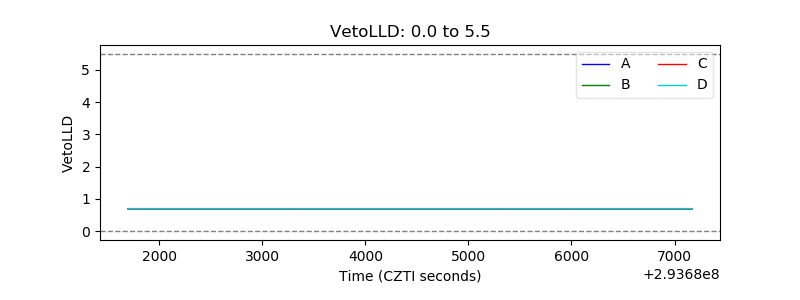 |
| Alpha Counter | 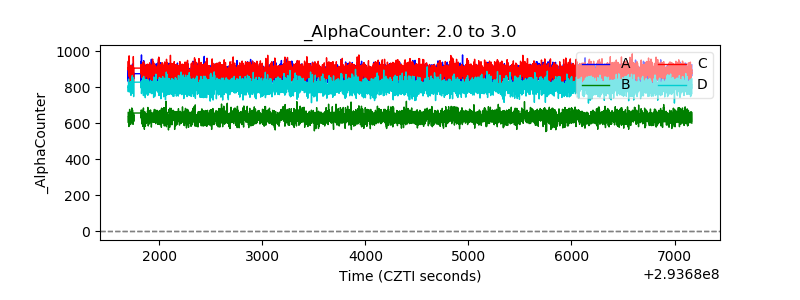 |
| _CPM_Rate | 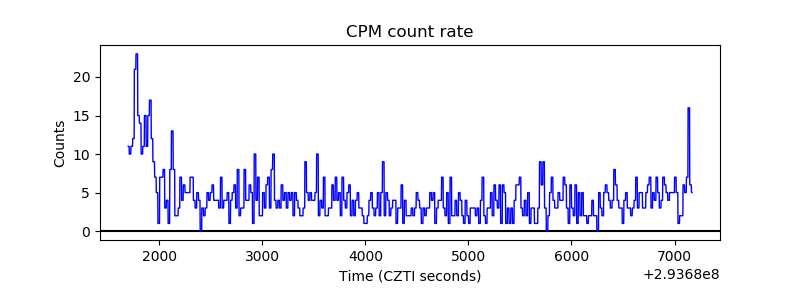 |
| CZT Counter |  |
| +2.5 Volts monitor | 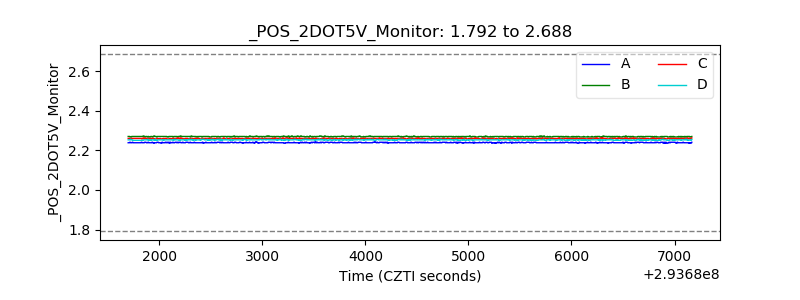 |
| +5 Volts monitor |  |
| _ROLL_ROT | 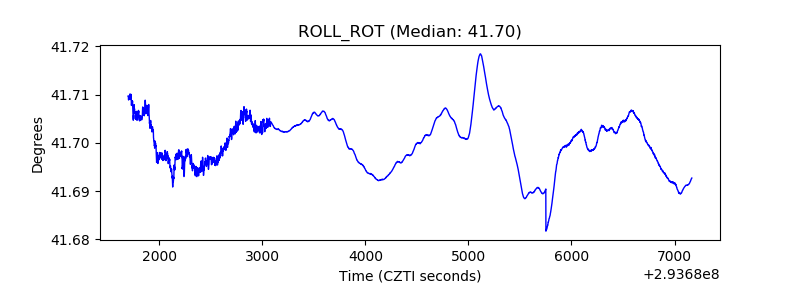 |
| _Roll_DEC | 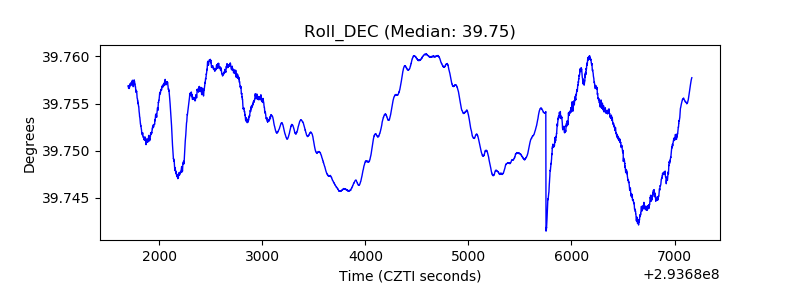 |
| _Roll_RA | 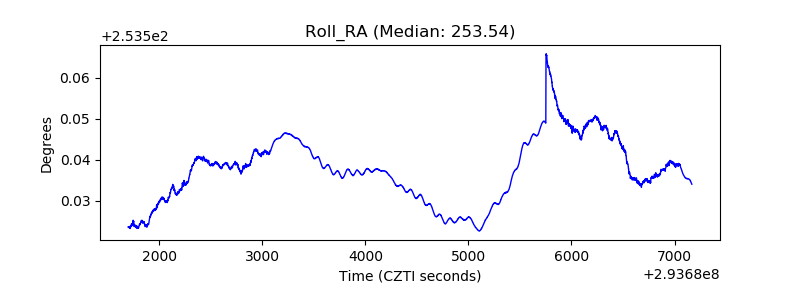 |
| Veto Counter | 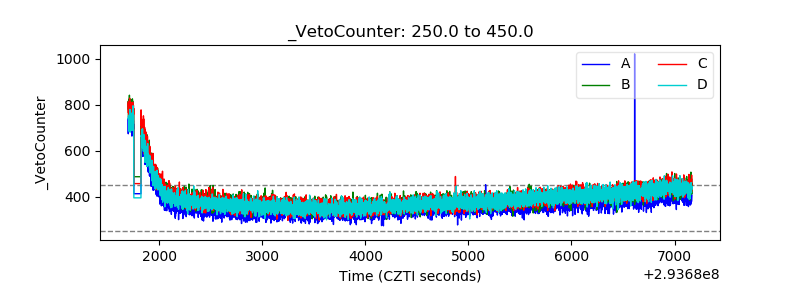 |