| Param | Original file | Final file |
|---|---|---|
| Filename | modeM0/AS1A05_204T01_9000002856cztM0_level2.fits | modeM0/AS1A05_204T01_9000002856cztM0_level2_quad_clean.evt |
| Size (bytes) | 3,230,752,320 | 2,870,193,600 |
| Size | 3.0 GB | 2.7 GB |
| Events in quadrant A | 20,229,642 | 17,413,095 |
| Events in quadrant B | 19,335,694 | 17,351,031 |
| Events in quadrant C | 19,617,224 | 16,406,090 |
| Events in quadrant D | 15,801,940 | 12,915,157 |
| Mode M0 | |||
|---|---|---|---|
| Quadrant | BADHDUFLAG | Total packets | Discarded packets |
| A | 0 | 702780 | 0 |
| B | 0 | 707182 | 0 |
| C | 0 | 705411 | 0 |
| D | 0 | 1228885 | 0 |
| Mode M9 | |||
|---|---|---|---|
| Quadrant | BADHDUFLAG | Total packets | Discarded packets |
| A | 0 | 507 | 0 |
| B | 0 | 507 | 0 |
| C | 0 | 507 | 0 |
| D | 0 | 507 | 0 |
| Mode SS | |||
|---|---|---|---|
| Quadrant | BADHDUFLAG | Total packets | Discarded packets |
| A | 0 | 6786 | 0 |
| B | 0 | 6786 | 0 |
| C | 0 | 6786 | 0 |
| D | 0 | 6786 | 0 |
| Quadrant | Total seconds | Saturated seconds | Saturation percentage |
|---|---|---|---|
| A | 333469 | 3989 | 1.196213% |
| B | 333471 | 4202 | 1.260080% |
| C | 333471 | 5112 | 1.532967% |
| D | 333470 | 56277 | 16.876181% |
Noise dominated data is calculated using 1-second bins in cleaned event files. If a bin has >2000 counts, and if more than 50% of those come from <1% of pixels, then it is considered to be noise-dominated and hence unusable.
| Quadrant | # 1 sec bins | Bins with >0 counts | Bins with >2000 counts | High rate bins dominated by noise | Noise dominated (total time) | Noise dominated (detector-on time) | Marked lightcurve |
|---|---|---|---|---|---|---|---|
| A | 383792 | 333408 | 0 | 0 | 0.00% | 0.00% |  |
| B | 383792 | 333431 | 0 | 0 | 0.00% | 0.00% |  |
| C | 383792 | 333434 | 0 | 0 | 0.00% | 0.00% |  |
| D | 383792 | 331657 | 0 | 0 | 0.00% | 0.00% |  |
Top three noisy pixels from each quadrant. If the there are fewer than three noisy pixels in the level2.evt file, extra rows are filled as -1
| Pixel properties | Quadrant properties | ||||||
|---|---|---|---|---|---|---|---|
| Quadrant | DetID | PixID | Counts | Sigma | Mean | Median | Sigma |
| A | 0 | 29 | 19262 | 11.43 | 5263 | 4944 | 1252.8 |
| A | 7 | 110 | 16481 | 9.21 | 5263 | 4944 | 1252.8 |
| A | 9 | 19 | 15309 | 8.27 | 5263 | 4944 | 1252.8 |
| B | 2 | 9 | 15553 | 10.87 | 5106 | 4868 | 982.9 |
| B | 2 | 8 | 12965 | 8.24 | 5106 | 4868 | 982.9 |
| B | 3 | 17 | 12682 | 7.95 | 5106 | 4868 | 982.9 |
| C | 1 | 81 | 14863 | 7.62 | 5181 | 4838 | 1314.8 |
| C | 1 | 80 | 14755 | 7.54 | 5181 | 4838 | 1314.8 |
| C | 12 | 241 | 13836 | 6.84 | 5181 | 4838 | 1314.8 |
| D | 10 | 190 | 11879 | 6.54 | 4519 | 4133 | 1183.7 |
| D | 3 | 14 | 11085 | 5.87 | 4519 | 4133 | 1183.7 |
| D | 10 | 189 | 11047 | 5.84 | 4519 | 4133 | 1183.7 |
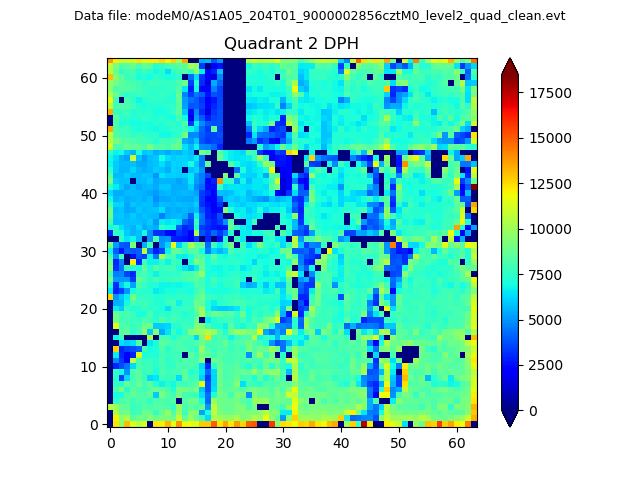
Histogram calculated using DETX and DETY for each event in the final _common_clean file
| Quadrant A | 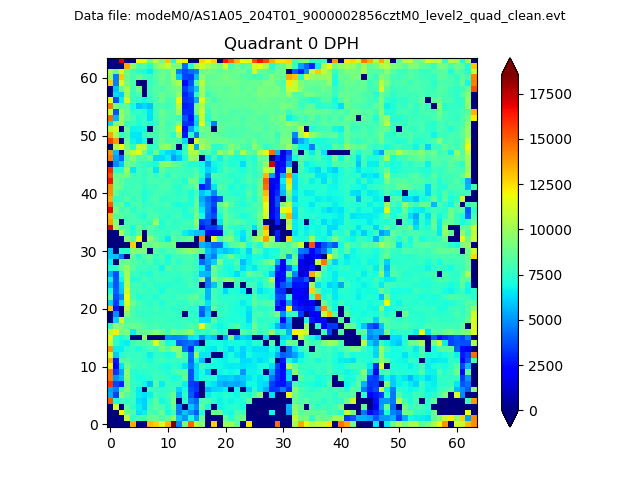 |
 |
Quadrant B |
|---|---|---|---|
| Quadrant D |  |
 |
Quadrant C |
| Plot type | Count rate plots | Images |
|---|---|---|
| Comparison with Poisson distribution Blue bars denote a histogram of data divided into 1 sec bins. Red curve is a Poisson curve with rate = median count rate of data. |
 |
 |
| Quadrant-wise count rates Data is divided into 100 sec bins |
 |
|
| Module-wise count rates for Quadrant A Data is divided into 100 sec bins |
 |
 |
| Module-wise count rates for Quadrant B Data is divided into 100 sec bins |
 |
 |
| Module-wise count rates for Quadrant C Data is divided into 100 sec bins |
 |
 |
| Module-wise count rates for Quadrant D Data is divided into 100 sec bins |
 |
 |
| Parameter | Plot |
|---|---|
| CZT HV Monitor |  |
| D_VDD |  |
| Temperature 1 |  |
| Veto HV Monitor |  |
| Veto LLD |  |
| Alpha Counter |  |
| _CPM_Rate |  |
| CZT Counter |  |
| +2.5 Volts monitor |  |
| +5 Volts monitor |  |
| _ROLL_ROT |  |
| _Roll_DEC |  |
| _Roll_RA |  |
| Veto Counter |  |