| Param | Original file | Final file |
|---|---|---|
| Filename | modeM0/AS1A05_204T01_9000002856_19297cztM0_level2.evt | modeM0/AS1A05_204T01_9000002856_19297cztM0_level2_quad_clean.evt |
| Size (bytes) | 349,464,960 | 46,679,040 |
| Size | 333.3 MB | 44.5 MB |
| Events in quadrant A | 2,173,914 | 290,747 |
| Events in quadrant B | 2,137,645 | 294,160 |
| Events in quadrant C | 2,071,775 | 278,717 |
| Events in quadrant D | 3,904,821 | 244,066 |
| Mode M0 | |||
|---|---|---|---|
| Quadrant | BADHDUFLAG | Total packets | Discarded packets |
| A | 0 | 9356 | 1 |
| B | 0 | 9083 | 2 |
| C | 0 | 8947 | 1 |
| D | 0 | 14701 | 1 |
| Mode M9 | |||
|---|---|---|---|
| Quadrant | BADHDUFLAG | Total packets | Discarded packets |
| A | 0 | 9 | 0 |
| B | 0 | 9 | 0 |
| C | 0 | 9 | 0 |
| D | 0 | 9 | 0 |
| Mode SS | |||
|---|---|---|---|
| Quadrant | BADHDUFLAG | Total packets | Discarded packets |
| A | 0 | 88 | 0 |
| B | 0 | 88 | 0 |
| C | 0 | 88 | 0 |
| D | 0 | 88 | 0 |
| Quadrant | Total seconds | Saturated seconds | Saturation percentage |
|---|---|---|---|
| A | 4338 | 26 | 0.599355% |
| B | 4337 | 32 | 0.737837% |
| C | 4337 | 37 | 0.853124% |
| D | 4337 | 634 | 14.618400% |
Noise dominated data is calculated using 1-second bins in cleaned event files. If a bin has >2000 counts, and if more than 50% of those come from <1% of pixels, then it is considered to be noise-dominated and hence unusable.
| Quadrant | # 1 sec bins | Bins with >0 counts | Bins with >2000 counts | High rate bins dominated by noise | Noise dominated (total time) | Noise dominated (detector-on time) | Marked lightcurve |
|---|---|---|---|---|---|---|---|
| A | 5213 | 4339 | 2 | 2 | 0.04% | 0.05% | 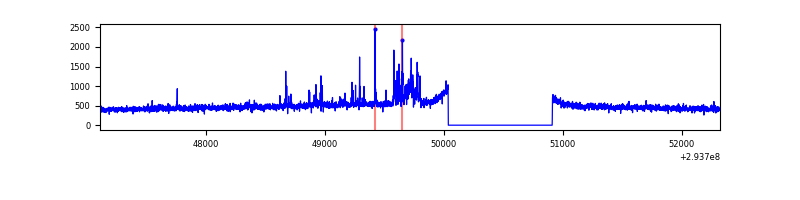 |
| B | 5212 | 4338 | 0 | 0 | 0.00% | 0.00% | 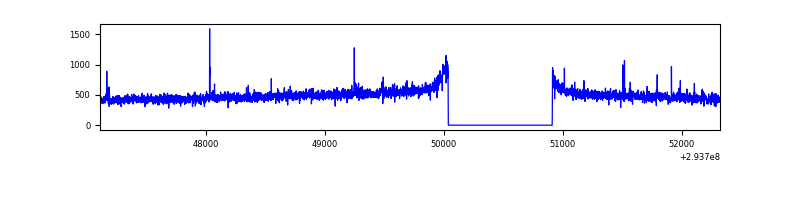 |
| C | 5212 | 4338 | 0 | 0 | 0.00% | 0.00% | 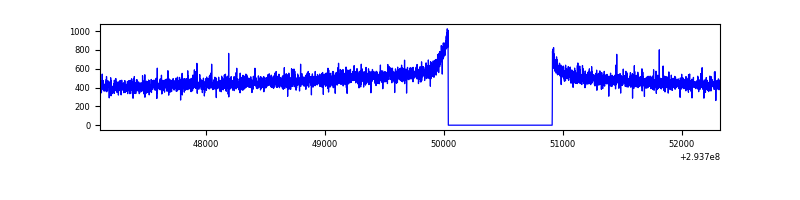 |
| D | 5212 | 4337 | 381 | 381 | 7.31% | 8.78% | 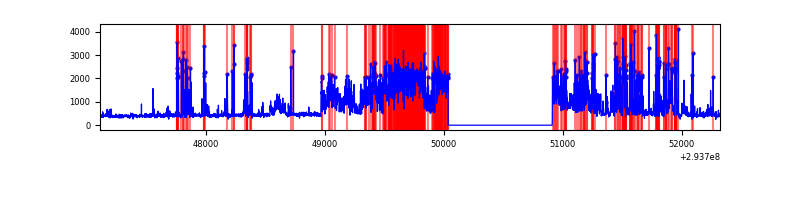 |
Top three noisy pixels from each quadrant. If the there are fewer than three noisy pixels in the level2.evt file, extra rows are filled as -1
| Pixel properties | Quadrant properties | ||||||
|---|---|---|---|---|---|---|---|
| Quadrant | DetID | PixID | Counts | Sigma | Mean | Median | Sigma |
| A | 4 | 2 | 113885 | 1029.3 | 534 | 523 | 110.1 |
| A | 13 | 254 | 6628 | 55.43 | 534 | 523 | 110.1 |
| A | 0 | 226 | 4665 | 37.61 | 534 | 523 | 110.1 |
| B | 0 | 229 | 27133 | 258.87 | 532 | 519 | 102.8 |
| B | 12 | 111 | 12568 | 117.2 | 532 | 519 | 102.8 |
| B | 11 | 111 | 11111 | 103.02 | 532 | 519 | 102.8 |
| C | 14 | 238 | 80078 | 662.38 | 509 | 513 | 120.1 |
| C | 13 | 61 | 3594 | 25.65 | 509 | 513 | 120.1 |
| C | 9 | 54 | 3101 | 21.55 | 509 | 513 | 120.1 |
| D | 1 | 52 | 1802835 | 15042.7 | 488 | 473 | 119.8 |
| D | 13 | 138 | 84444 | 700.83 | 488 | 473 | 119.8 |
| D | 11 | 176 | 77634 | 643.99 | 488 | 473 | 119.8 |
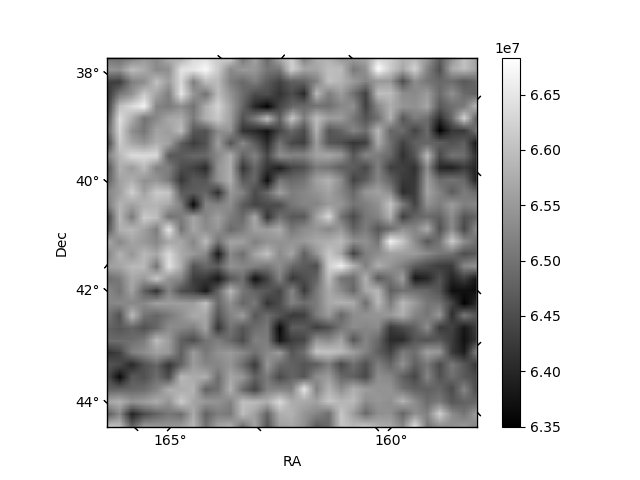
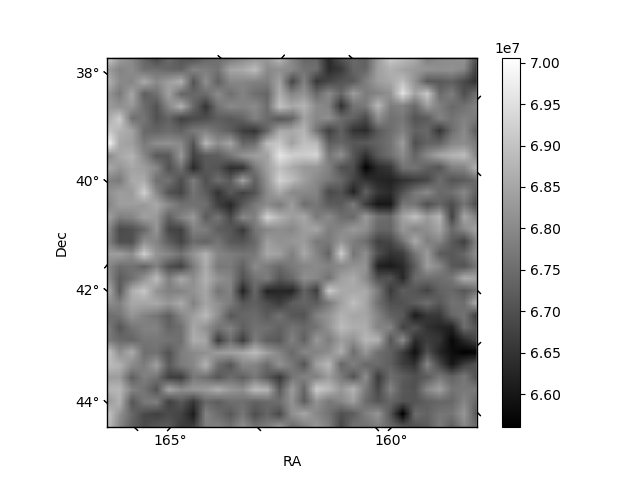
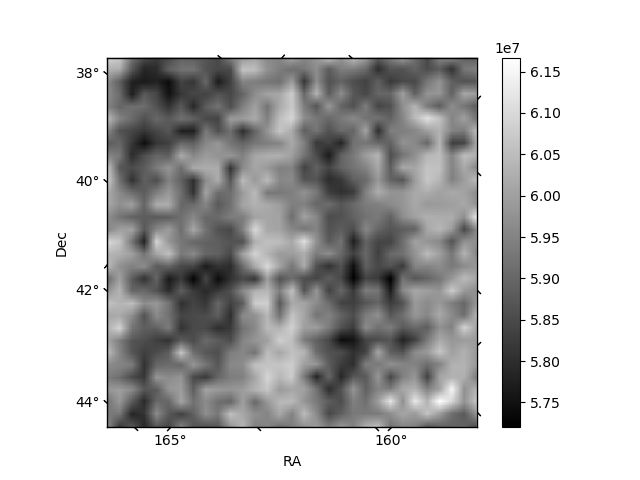
Histogram calculated using DETX and DETY for each event in the final _common_clean file
| Quadrant A | 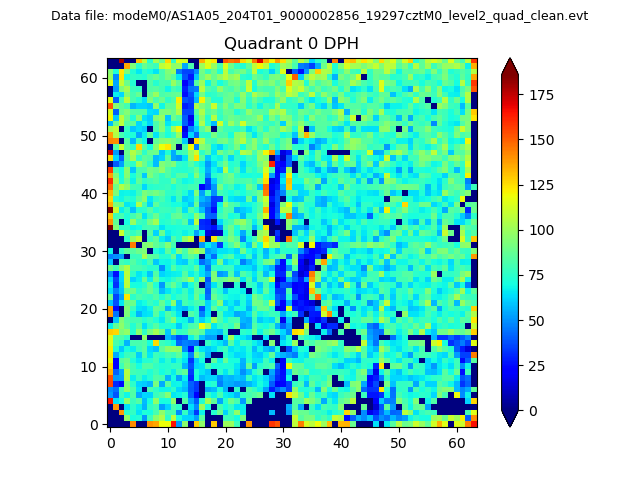 |
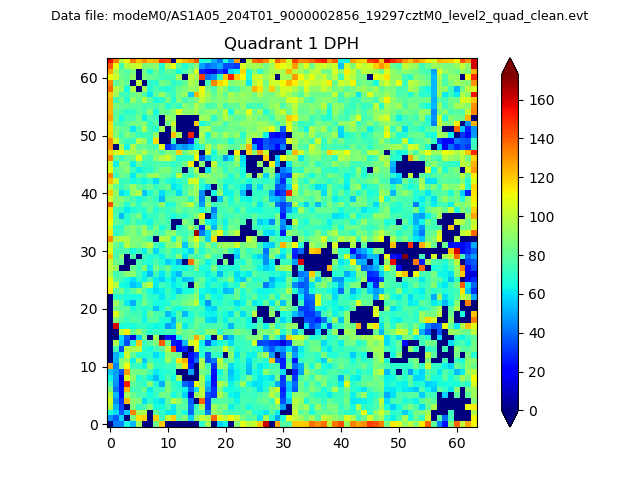 |
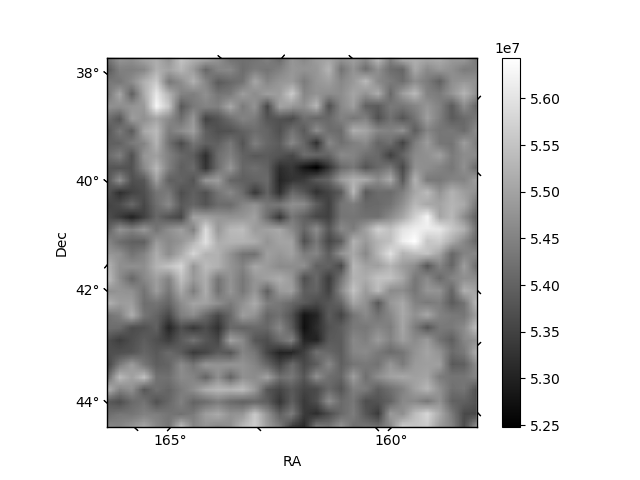
Quadrant B |
|---|---|---|---|
| Quadrant D | 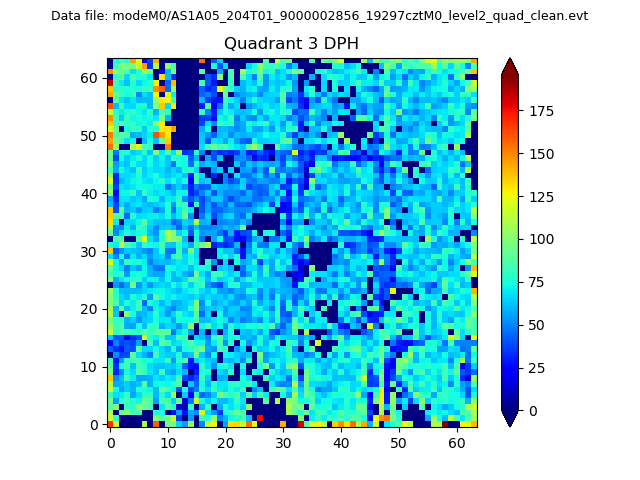 |
 |
Quadrant C |
| Plot type | Count rate plots | Images |
|---|---|---|
| Comparison with Poisson distribution Blue bars denote a histogram of data divided into 1 sec bins. Red curve is a Poisson curve with rate = median count rate of data. |
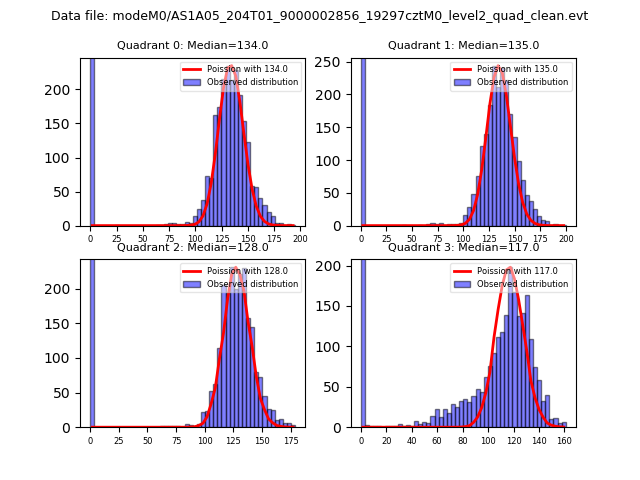 |
 |
| Quadrant-wise count rates Data is divided into 100 sec bins |
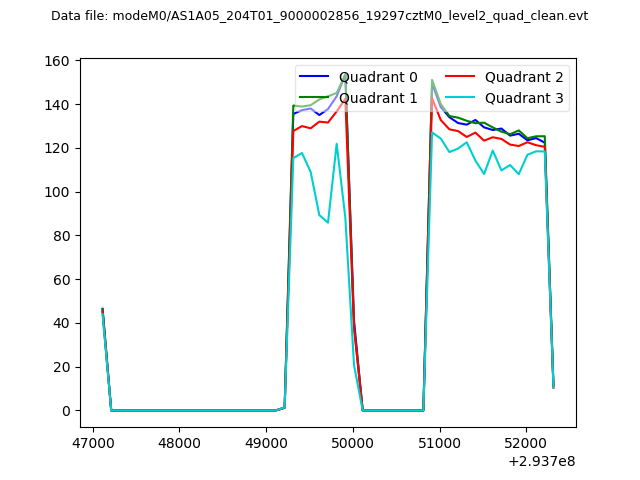 |
|
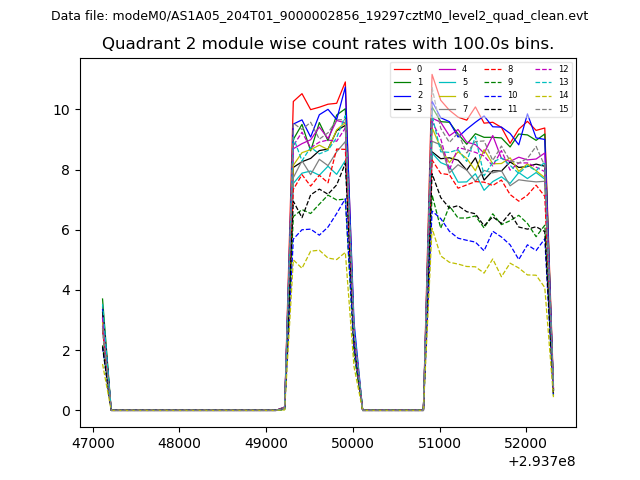
| Module-wise count rates for Quadrant A Data is divided into 100 sec bins |
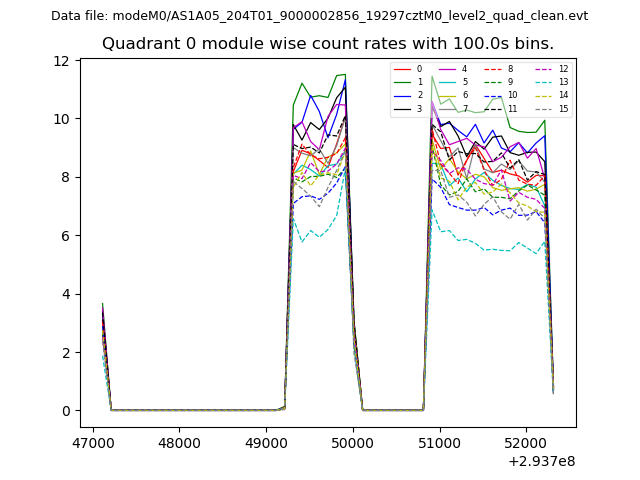 |
 |
| Module-wise count rates for Quadrant B Data is divided into 100 sec bins |
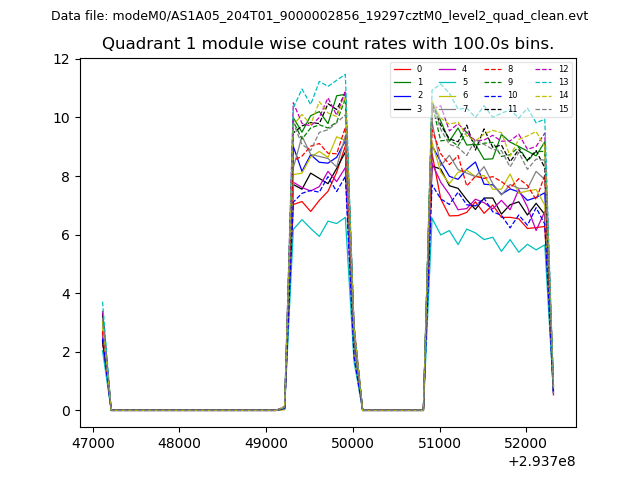 |
 |
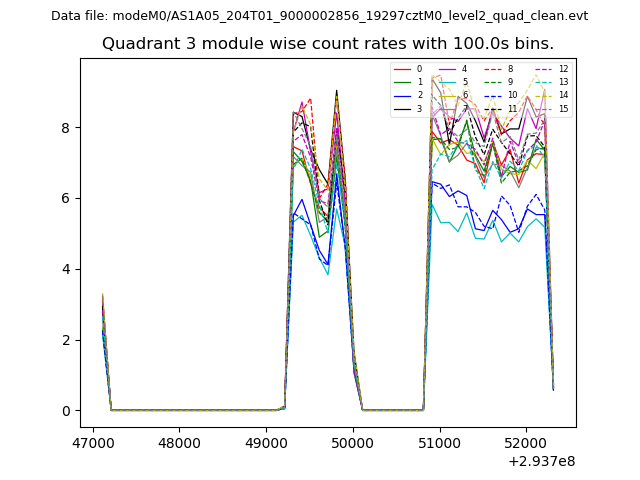
| Module-wise count rates for Quadrant C Data is divided into 100 sec bins |
 |
 |
| Module-wise count rates for Quadrant D Data is divided into 100 sec bins |
 |
 |
| Parameter | Plot |
|---|---|
| CZT HV Monitor | 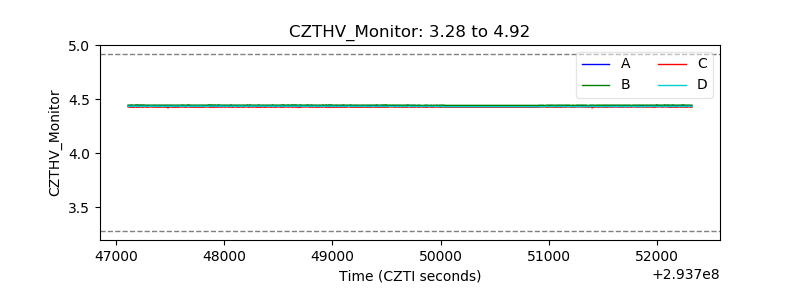 |
| D_VDD | 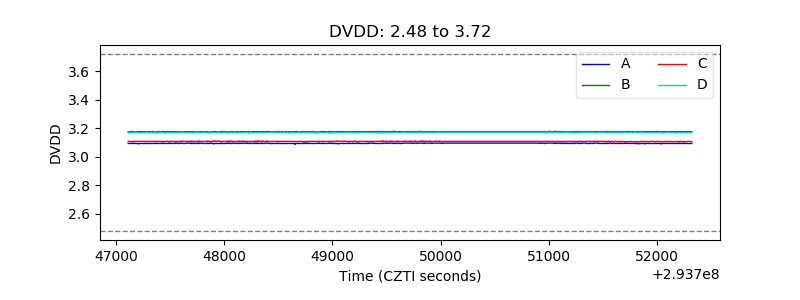 |
| Temperature 1 |  |
| Veto HV Monitor | 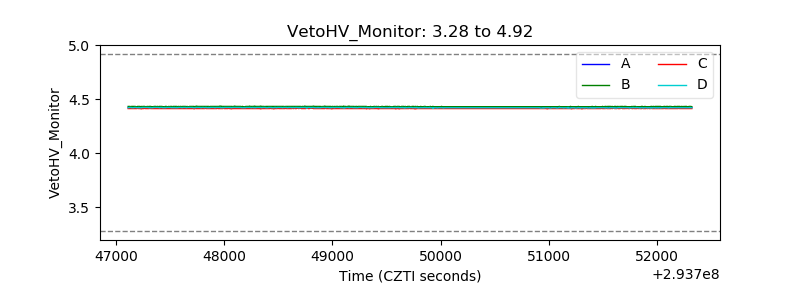 |
| Veto LLD | 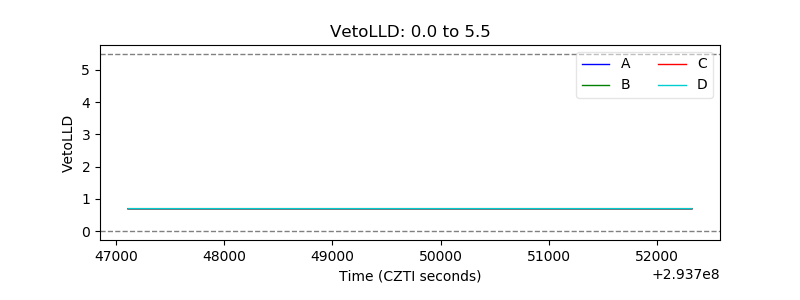 |
| Alpha Counter | 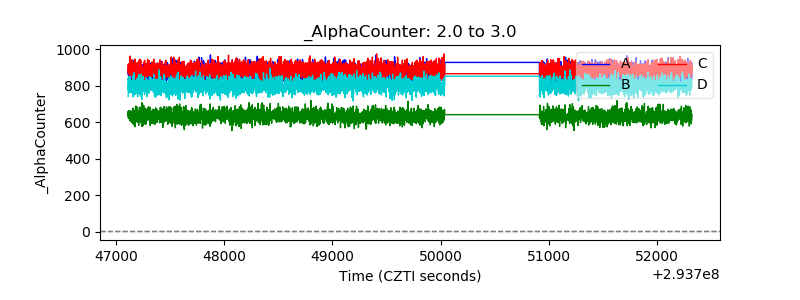 |
| _CPM_Rate | 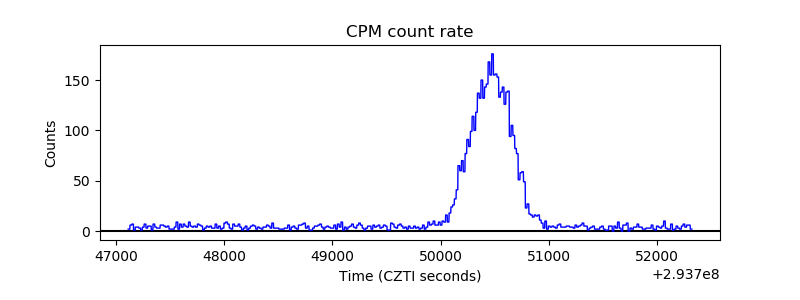 |
| CZT Counter |  |
| +2.5 Volts monitor |  |
| +5 Volts monitor |  |
| _ROLL_ROT | 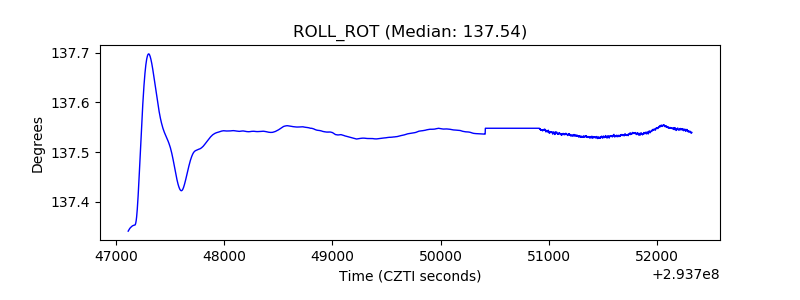 |
| _Roll_DEC | 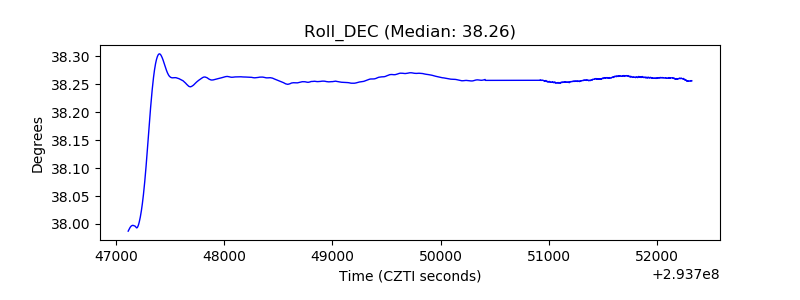 |
| _Roll_RA |  |
| Veto Counter | 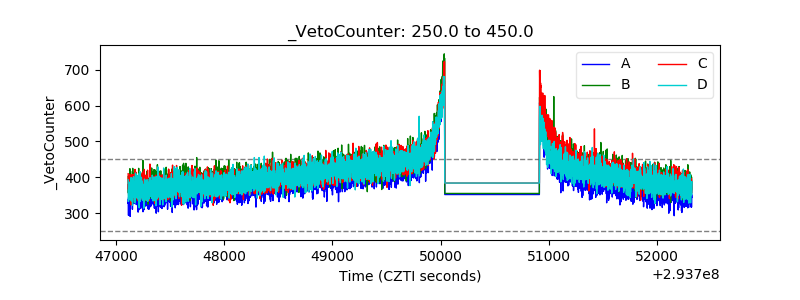 |