| Param | Original file | Final file |
|---|---|---|
| Filename | modeM0/AS1A05_204T01_9000002856_19298cztM0_level2.evt | modeM0/AS1A05_204T01_9000002856_19298cztM0_level2_quad_clean.evt |
| Size (bytes) | 541,177,920 | 103,913,280 |
| Size | 516.1 MB | 99.1 MB |
| Events in quadrant A | 3,433,133 | 676,851 |
| Events in quadrant B | 3,596,292 | 682,209 |
| Events in quadrant C | 3,590,576 | 652,475 |
| Events in quadrant D | 5,268,677 | 621,656 |
| Mode M0 | |||
|---|---|---|---|
| Quadrant | BADHDUFLAG | Total packets | Discarded packets |
| A | 0 | 15226 | 2 |
| B | 0 | 15551 | 2 |
| C | 0 | 15543 | 2 |
| D | 0 | 20758 | 2 |
| Mode M9 | |||
|---|---|---|---|
| Quadrant | BADHDUFLAG | Total packets | Discarded packets |
| A | 0 | 13 | 0 |
| B | 0 | 13 | 0 |
| C | 0 | 13 | 0 |
| D | 0 | 13 | 0 |
| Mode SS | |||
|---|---|---|---|
| Quadrant | BADHDUFLAG | Total packets | Discarded packets |
| A | 0 | 152 | 0 |
| B | 0 | 152 | 0 |
| C | 0 | 152 | 0 |
| D | 0 | 152 | 0 |
| Quadrant | Total seconds | Saturated seconds | Saturation percentage |
|---|---|---|---|
| A | 7378 | 40 | 0.542152% |
| B | 7379 | 74 | 1.002846% |
| C | 7379 | 118 | 1.599133% |
| D | 7379 | 411 | 5.569860% |
Noise dominated data is calculated using 1-second bins in cleaned event files. If a bin has >2000 counts, and if more than 50% of those come from <1% of pixels, then it is considered to be noise-dominated and hence unusable.
| Quadrant | # 1 sec bins | Bins with >0 counts | Bins with >2000 counts | High rate bins dominated by noise | Noise dominated (total time) | Noise dominated (detector-on time) | Marked lightcurve |
|---|---|---|---|---|---|---|---|
| A | 8643 | 7380 | 0 | 0 | 0.00% | 0.00% | 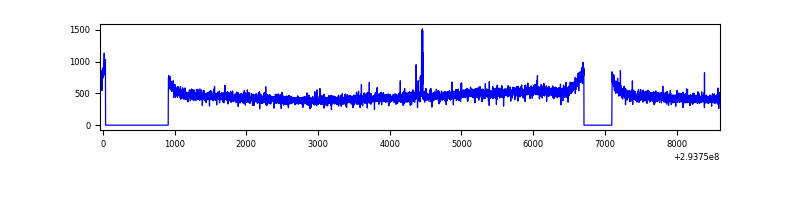 |
| B | 8644 | 7381 | 1 | 1 | 0.01% | 0.01% | 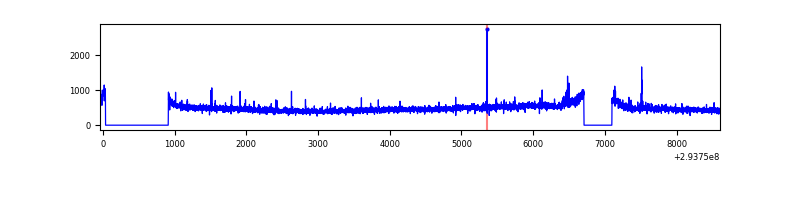 |
| C | 8644 | 7381 | 13 | 13 | 0.15% | 0.18% | 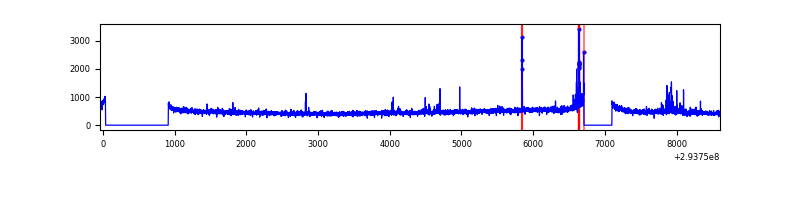 |
| D | 8644 | 7380 | 269 | 269 | 3.11% | 3.64% | 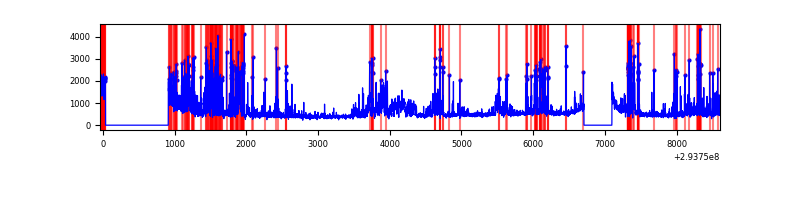 |
Top three noisy pixels from each quadrant. If the there are fewer than three noisy pixels in the level2.evt file, extra rows are filled as -1
| Pixel properties | Quadrant properties | ||||||
|---|---|---|---|---|---|---|---|
| Quadrant | DetID | PixID | Counts | Sigma | Mean | Median | Sigma |
| A | 4 | 2 | 13879 | 71.99 | 887 | 868 | 180.7 |
| A | 13 | 254 | 11067 | 56.43 | 887 | 868 | 180.7 |
| A | 0 | 226 | 7650 | 37.52 | 887 | 868 | 180.7 |
| B | 0 | 229 | 74337 | 434.46 | 886 | 864 | 169.1 |
| B | 12 | 111 | 20650 | 117.0 | 886 | 864 | 169.1 |
| B | 11 | 111 | 18268 | 102.91 | 886 | 864 | 169.1 |
| C | 14 | 238 | 131454 | 648.76 | 855 | 861 | 201.3 |
| C | 9 | 54 | 122782 | 605.67 | 855 | 861 | 201.3 |
| C | 13 | 61 | 5941 | 25.24 | 855 | 861 | 201.3 |
| D | 1 | 52 | 1687194 | 8178.45 | 845 | 821 | 206.2 |
| D | 13 | 138 | 142058 | 684.96 | 845 | 821 | 206.2 |
| D | 13 | 104 | 83597 | 401.44 | 845 | 821 | 206.2 |
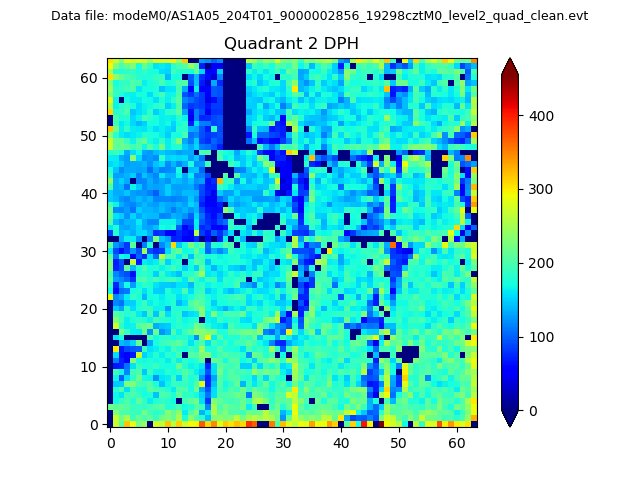
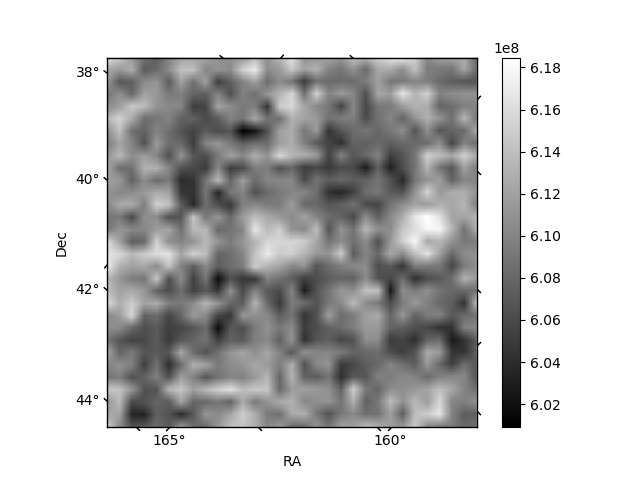
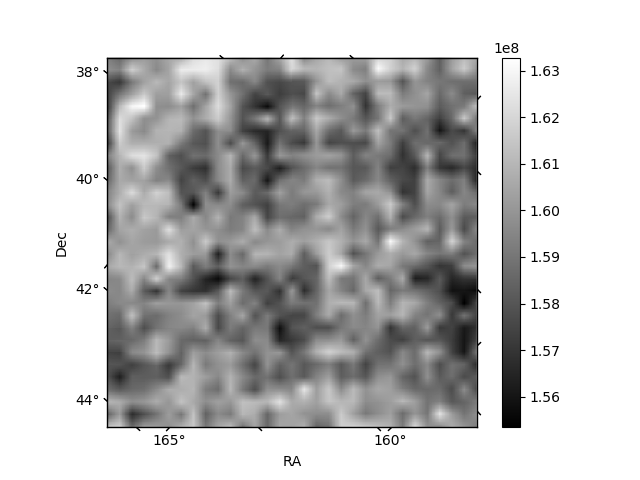
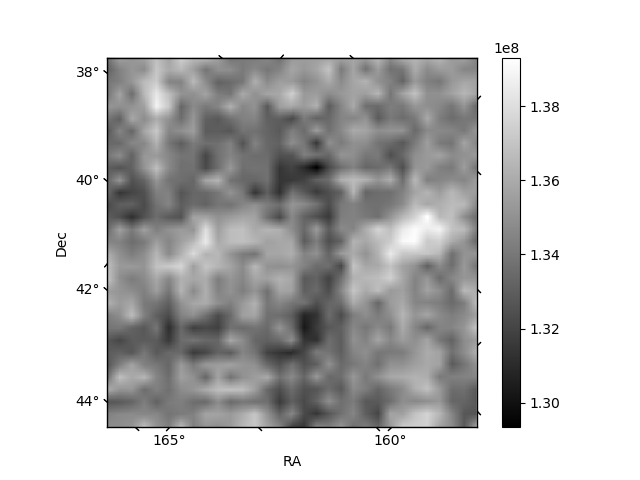
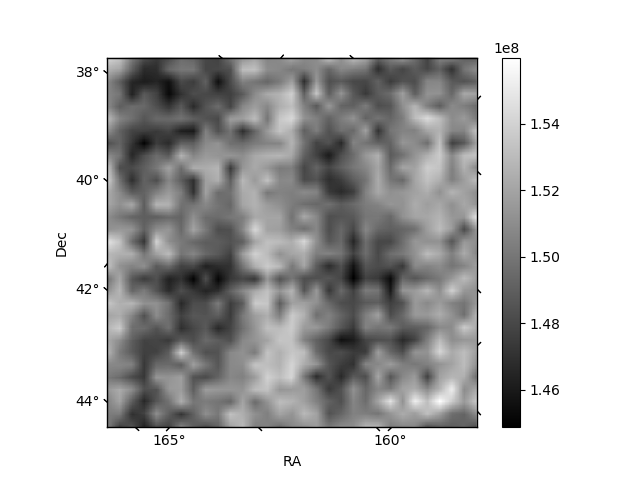
Histogram calculated using DETX and DETY for each event in the final _common_clean file
| Quadrant A | 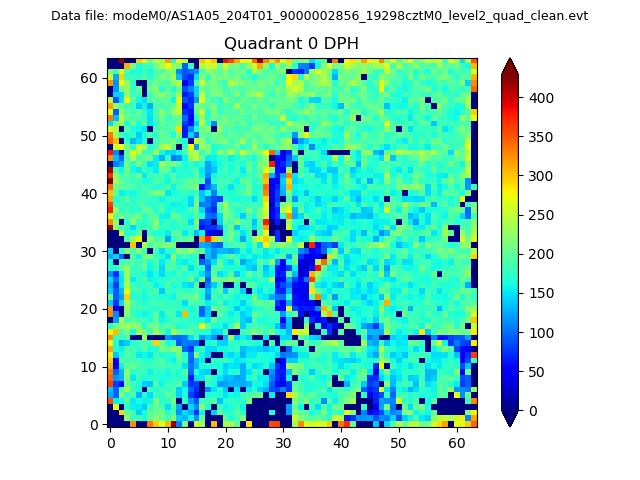 |
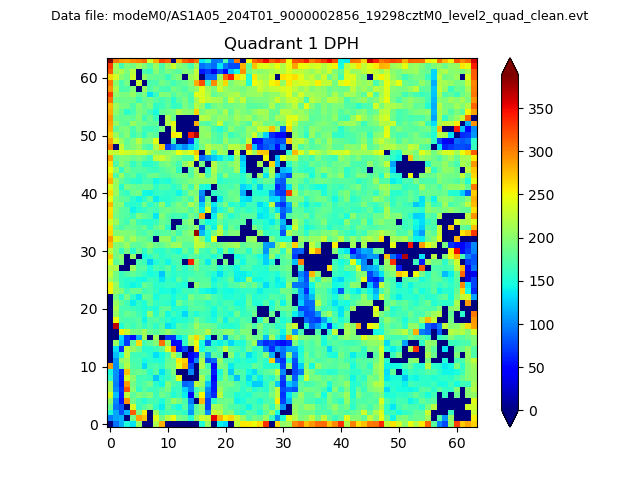 |
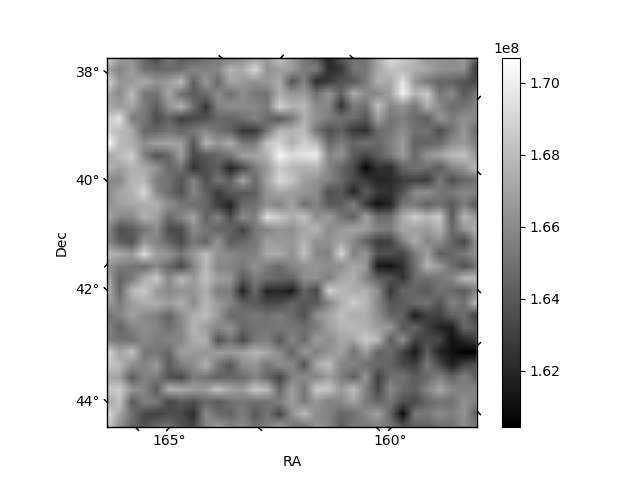
Quadrant B |
|---|---|---|---|
| Quadrant D | 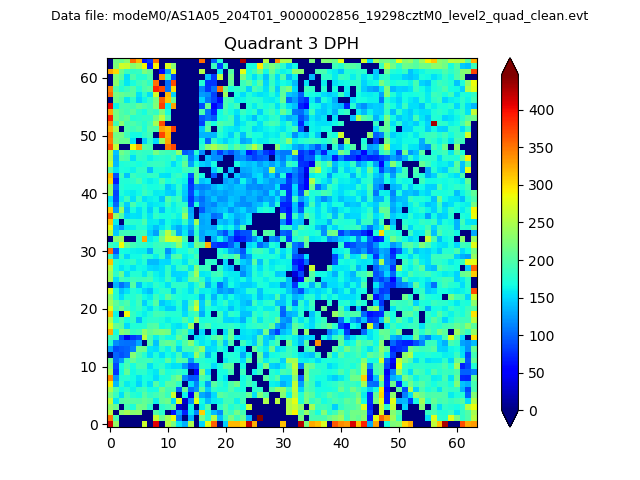 |
 |
Quadrant C |
| Plot type | Count rate plots | Images |
|---|---|---|
| Comparison with Poisson distribution Blue bars denote a histogram of data divided into 1 sec bins. Red curve is a Poisson curve with rate = median count rate of data. |
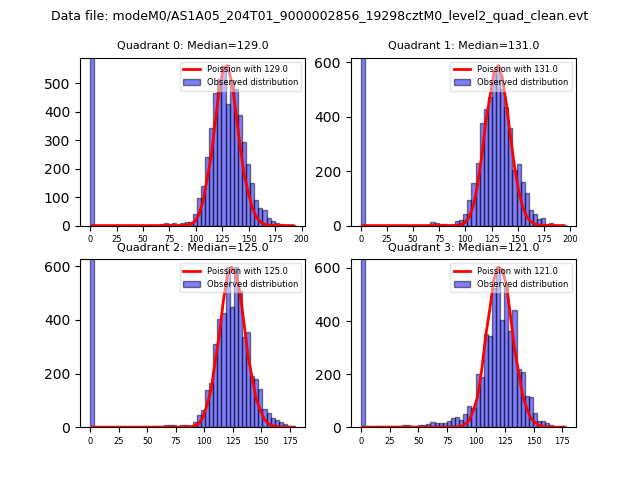 |
 |
| Quadrant-wise count rates Data is divided into 100 sec bins |
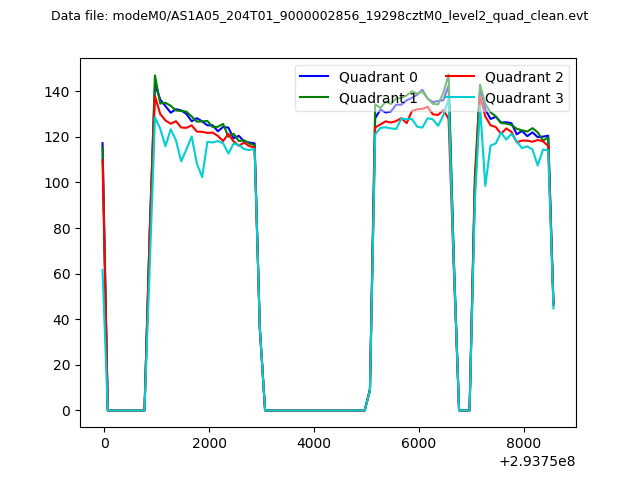 |
|
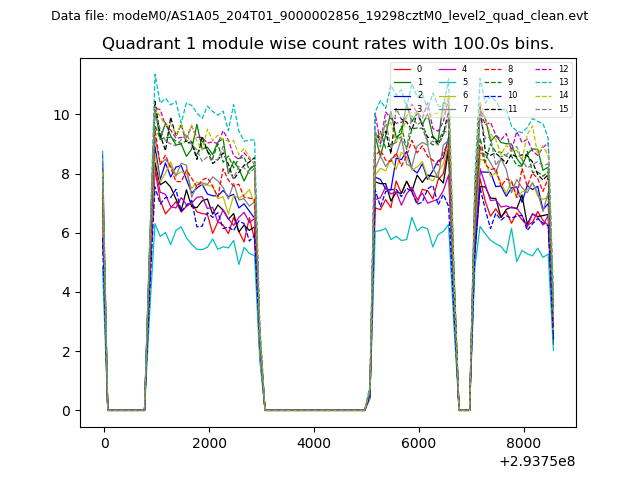
| Module-wise count rates for Quadrant A Data is divided into 100 sec bins |
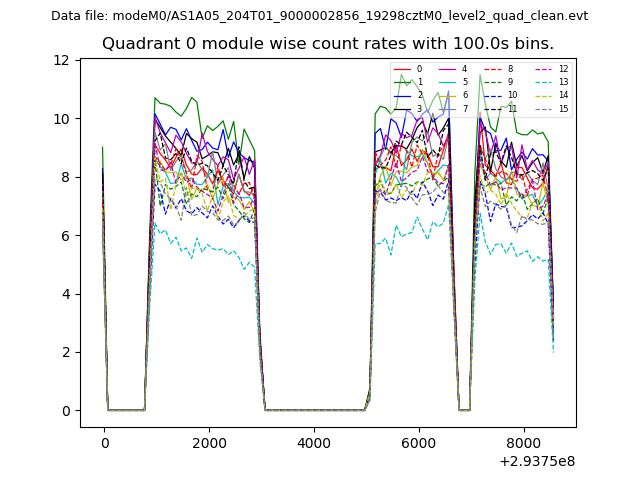 |
 |
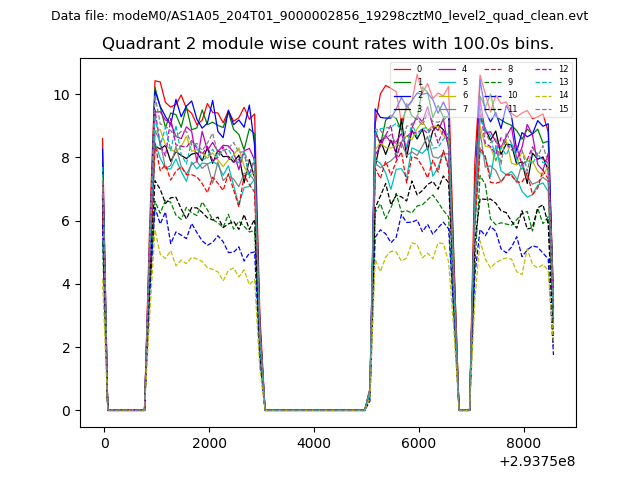
| Module-wise count rates for Quadrant B Data is divided into 100 sec bins |
 |
 |
| Module-wise count rates for Quadrant C Data is divided into 100 sec bins |
 |
 |
| Module-wise count rates for Quadrant D Data is divided into 100 sec bins |
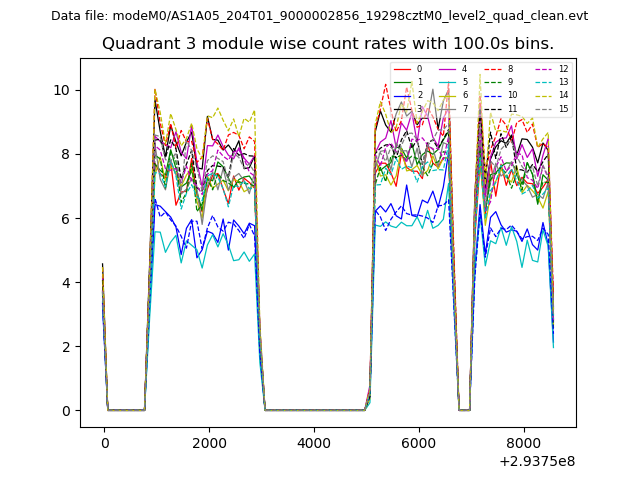 |
 |
| Parameter | Plot |
|---|---|
| CZT HV Monitor | 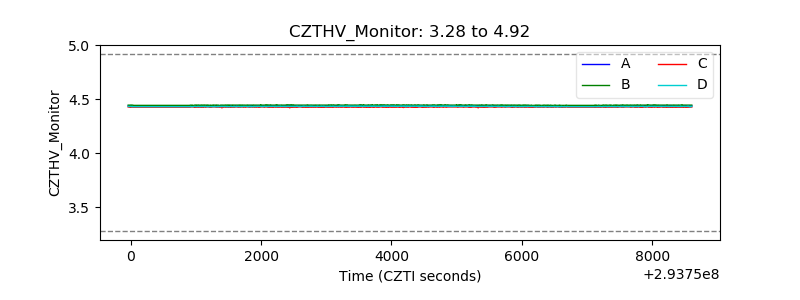 |
| D_VDD |  |
| Temperature 1 | 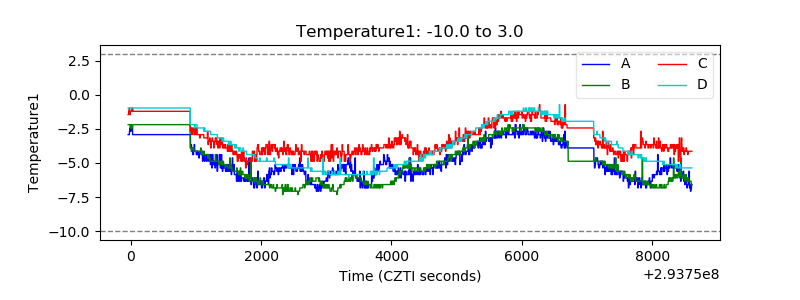 |
| Veto HV Monitor | 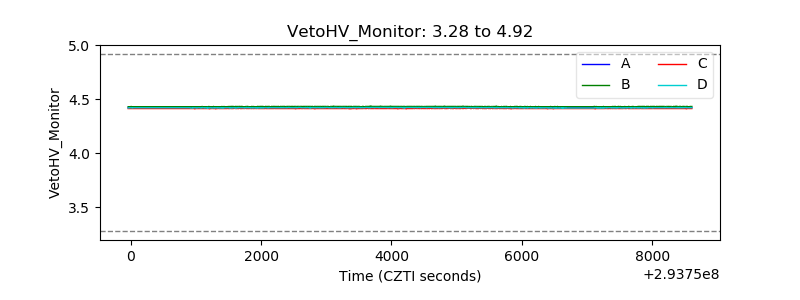 |
| Veto LLD | 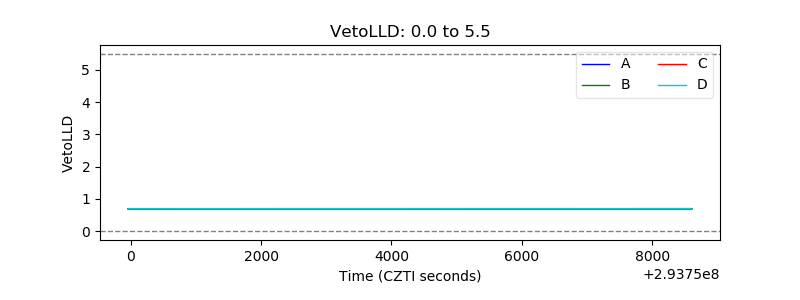 |
| Alpha Counter | 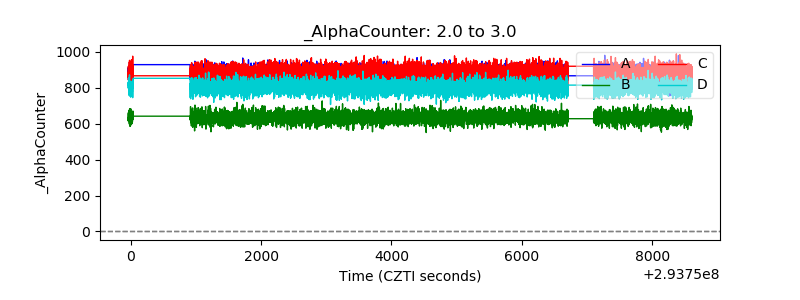 |
| _CPM_Rate | 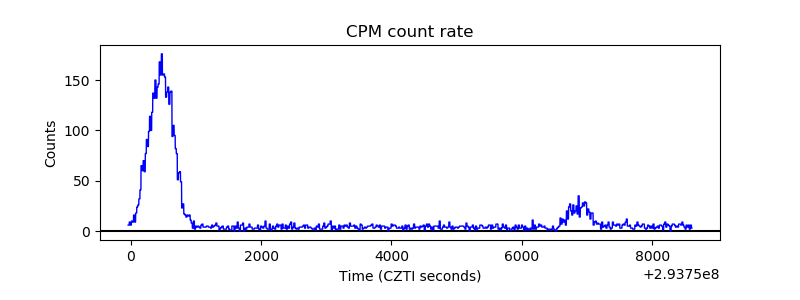 |
| CZT Counter | 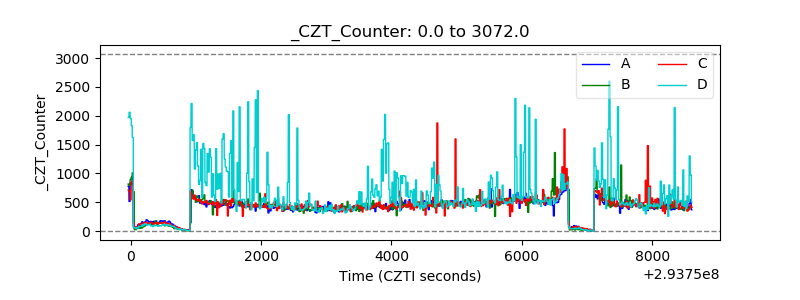 |
| +2.5 Volts monitor | 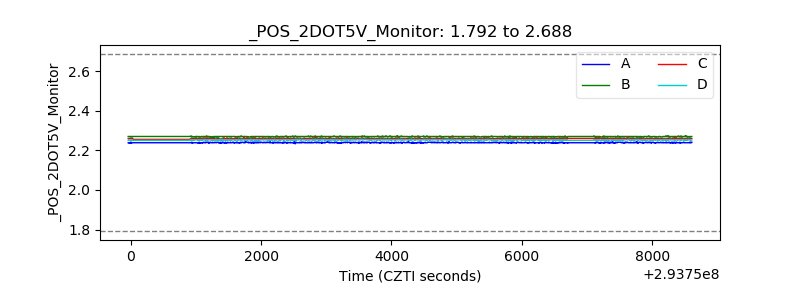 |
| +5 Volts monitor |  |
| _ROLL_ROT | 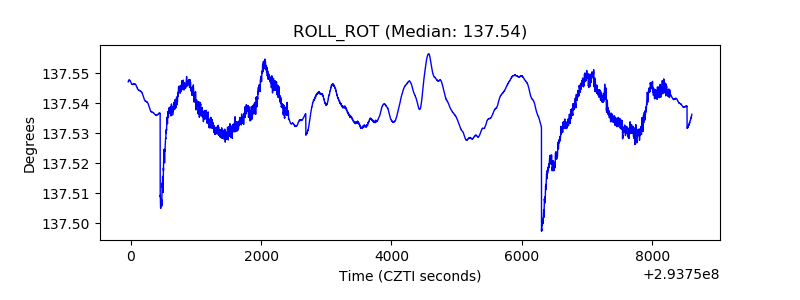 |
| _Roll_DEC | 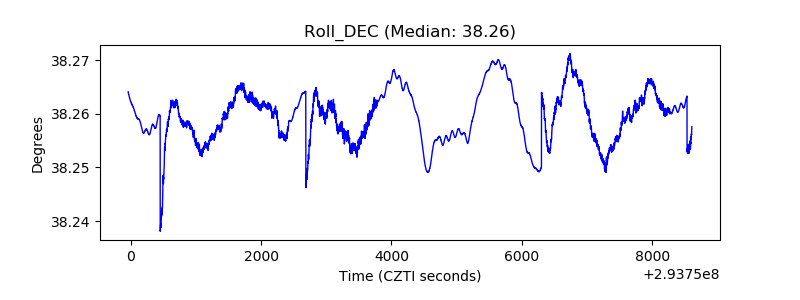 |
| _Roll_RA | 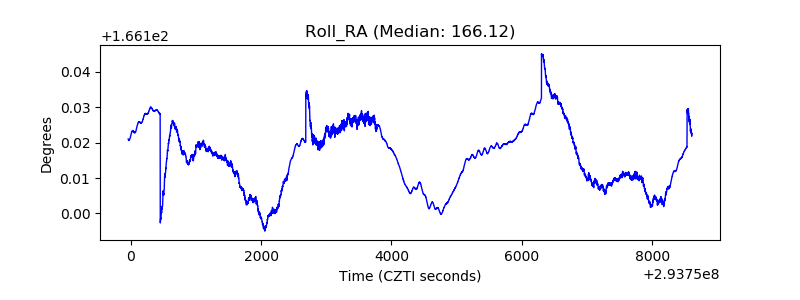 |
| Veto Counter | 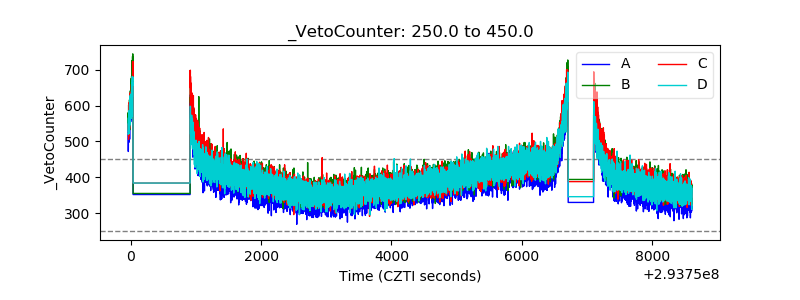 |