| Param | Original file | Final file |
|---|---|---|
| Filename | modeM0/AS1A05_204T01_9000002856_19299cztM0_level2.evt | modeM0/AS1A05_204T01_9000002856_19299cztM0_level2_quad_clean.evt |
| Size (bytes) | 624,216,960 | 114,125,760 |
| Size | 595.3 MB | 108.8 MB |
| Events in quadrant A | 3,833,048 | 744,834 |
| Events in quadrant B | 4,080,882 | 752,578 |
| Events in quadrant C | 3,965,510 | 721,926 |
| Events in quadrant D | 6,470,183 | 668,247 |
| Mode M0 | |||
|---|---|---|---|
| Quadrant | BADHDUFLAG | Total packets | Discarded packets |
| A | 0 | 16939 | 2 |
| B | 0 | 17570 | 2 |
| C | 0 | 17201 | 2 |
| D | 0 | 24834 | 2 |
| Mode M9 | |||
|---|---|---|---|
| Quadrant | BADHDUFLAG | Total packets | Discarded packets |
| A | 0 | 6 | 0 |
| B | 0 | 6 | 0 |
| C | 0 | 6 | 0 |
| D | 0 | 6 | 0 |
| Mode SS | |||
|---|---|---|---|
| Quadrant | BADHDUFLAG | Total packets | Discarded packets |
| A | 0 | 168 | 0 |
| B | 0 | 168 | 0 |
| C | 0 | 168 | 0 |
| D | 0 | 168 | 0 |
| Quadrant | Total seconds | Saturated seconds | Saturation percentage |
|---|---|---|---|
| A | 8178 | 45 | 0.550257% |
| B | 8178 | 92 | 1.124969% |
| C | 8179 | 153 | 1.870644% |
| D | 8179 | 894 | 10.930432% |
Noise dominated data is calculated using 1-second bins in cleaned event files. If a bin has >2000 counts, and if more than 50% of those come from <1% of pixels, then it is considered to be noise-dominated and hence unusable.
| Quadrant | # 1 sec bins | Bins with >0 counts | Bins with >2000 counts | High rate bins dominated by noise | Noise dominated (total time) | Noise dominated (detector-on time) | Marked lightcurve |
|---|---|---|---|---|---|---|---|
| A | 8758 | 8180 | 3 | 3 | 0.03% | 0.04% | 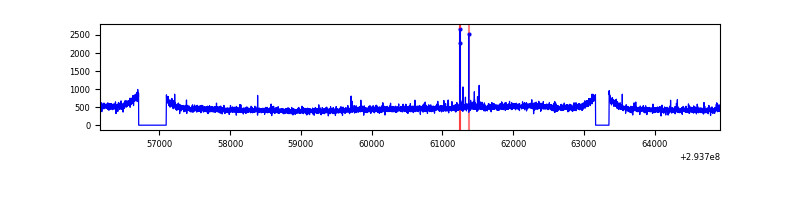 |
| B | 8758 | 8180 | 3 | 3 | 0.03% | 0.04% | 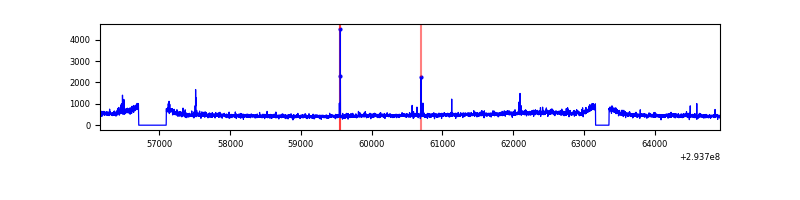 |
| C | 8759 | 8181 | 10 | 10 | 0.11% | 0.12% | 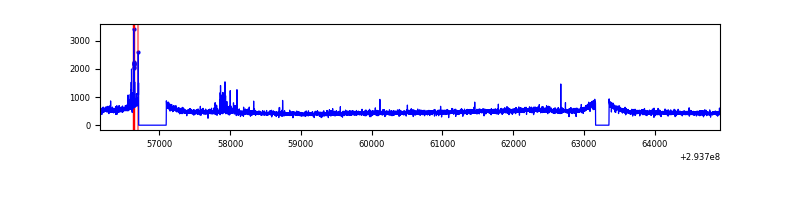 |
| D | 8759 | 8181 | 663 | 663 | 7.57% | 8.10% | 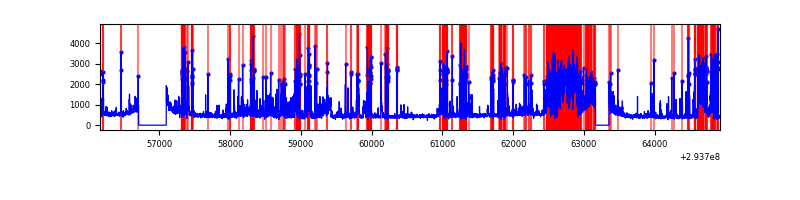 |
Top three noisy pixels from each quadrant. If the there are fewer than three noisy pixels in the level2.evt file, extra rows are filled as -1
| Pixel properties | Quadrant properties | ||||||
|---|---|---|---|---|---|---|---|
| Quadrant | DetID | PixID | Counts | Sigma | Mean | Median | Sigma |
| A | 5 | 16 | 18423 | 87.19 | 986 | 964 | 200.2 |
| A | 9 | 143 | 11452 | 52.38 | 986 | 964 | 200.2 |
| A | 13 | 254 | 11222 | 51.23 | 986 | 964 | 200.2 |
| B | 0 | 229 | 166267 | 871.91 | 985 | 959 | 189.6 |
| B | 0 | 190 | 24193 | 122.54 | 985 | 959 | 189.6 |
| B | 12 | 111 | 23476 | 118.76 | 985 | 959 | 189.6 |
| C | 14 | 238 | 147067 | 647.41 | 953 | 958 | 225.7 |
| C | 9 | 54 | 90650 | 397.43 | 953 | 958 | 225.7 |
| C | 13 | 61 | 6777 | 25.78 | 953 | 958 | 225.7 |
| D | 1 | 52 | 1973221 | 8873.94 | 918 | 891 | 222.3 |
| D | 13 | 138 | 611709 | 2748.2 | 918 | 891 | 222.3 |
| D | 11 | 176 | 159586 | 714.0 | 918 | 891 | 222.3 |
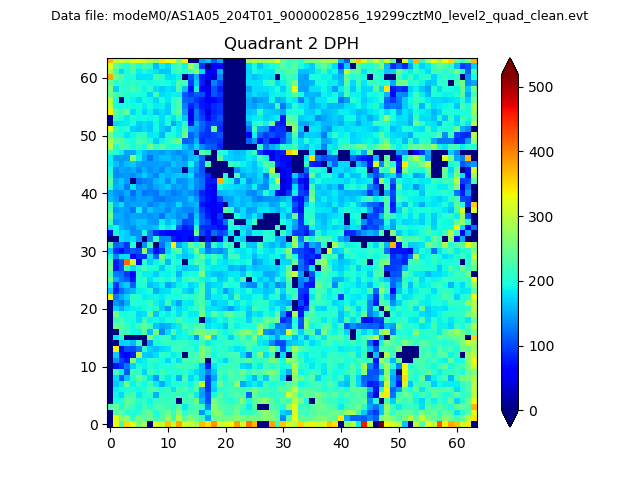
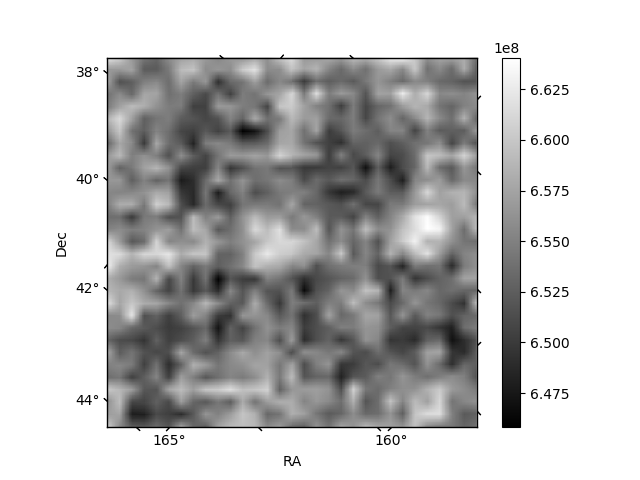
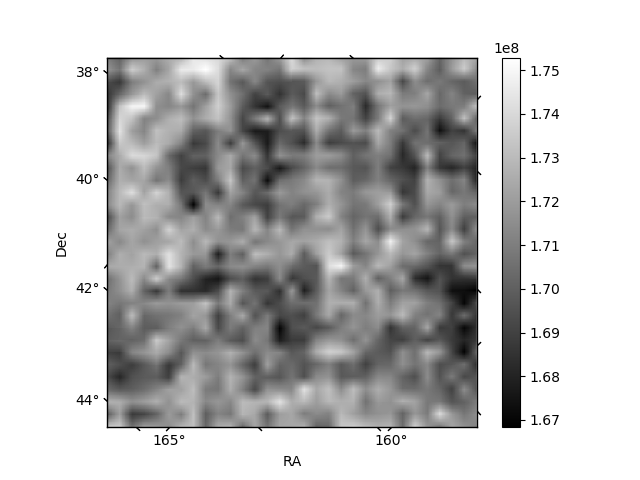
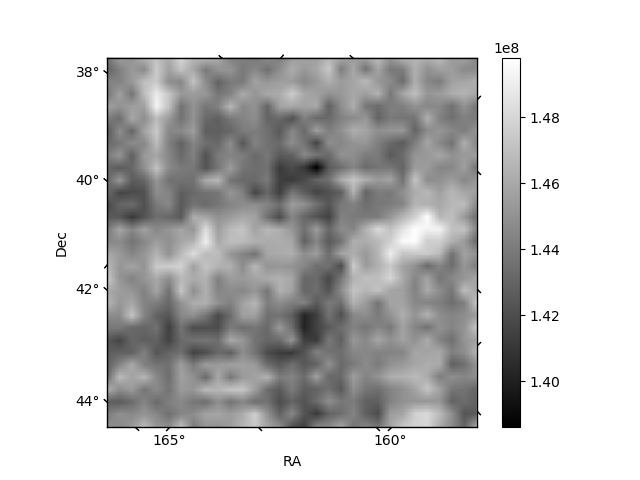
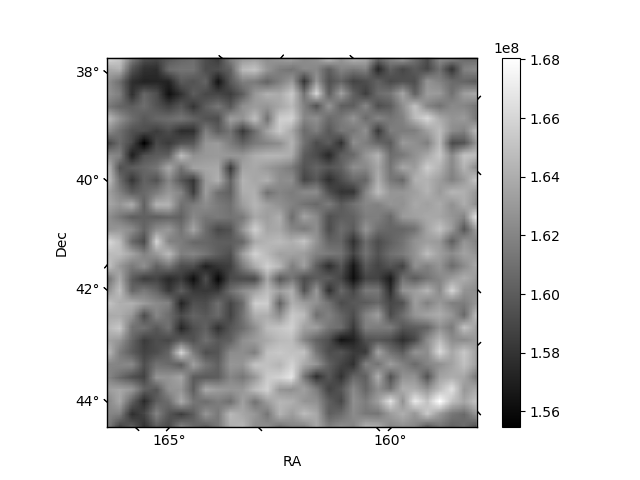
Histogram calculated using DETX and DETY for each event in the final _common_clean file
| Quadrant A | 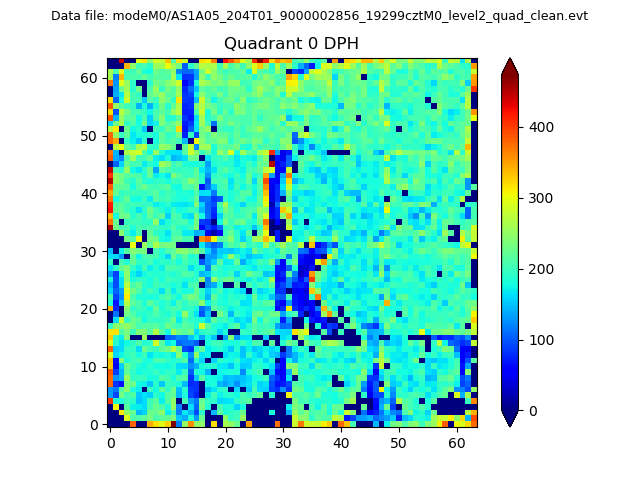 |
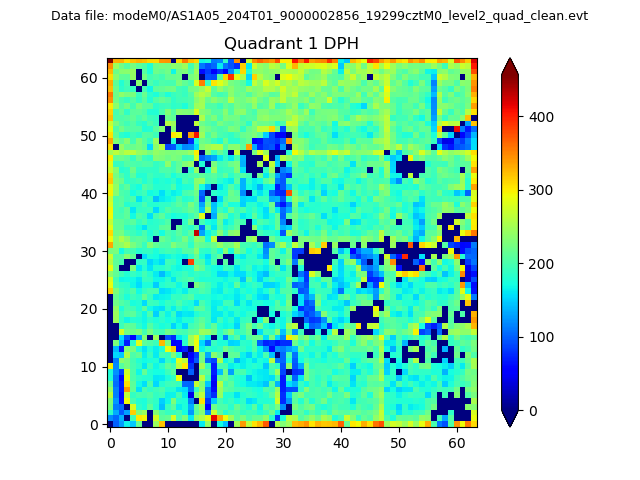 |
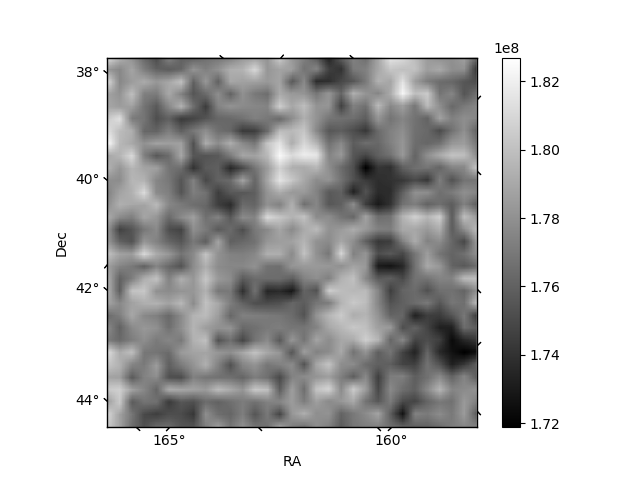
Quadrant B |
|---|---|---|---|
| Quadrant D | 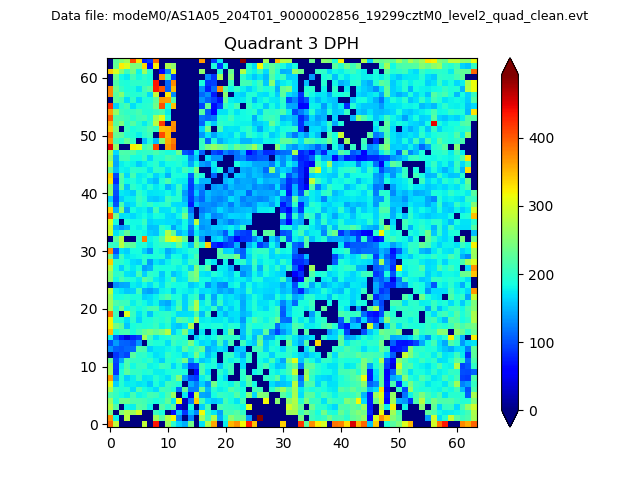 |
 |
Quadrant C |
| Plot type | Count rate plots | Images |
|---|---|---|
| Comparison with Poisson distribution Blue bars denote a histogram of data divided into 1 sec bins. Red curve is a Poisson curve with rate = median count rate of data. |
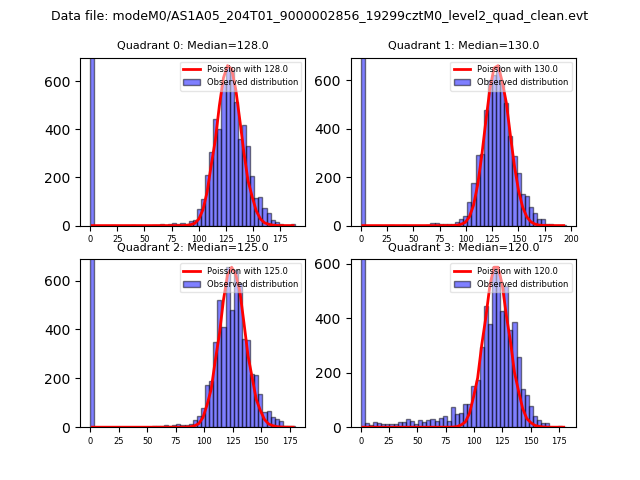 |
 |
| Quadrant-wise count rates Data is divided into 100 sec bins |
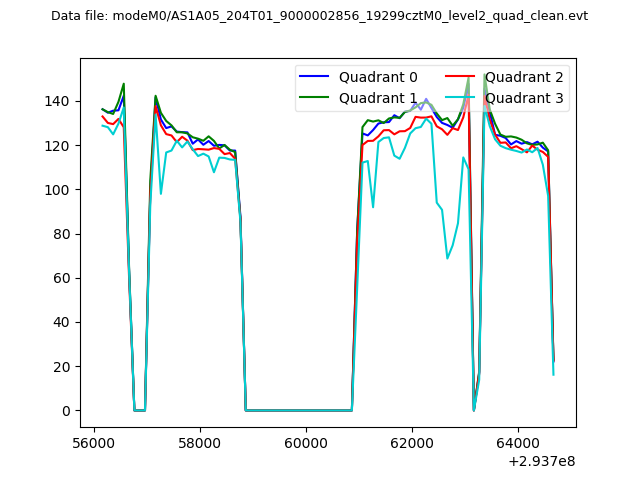 |
|
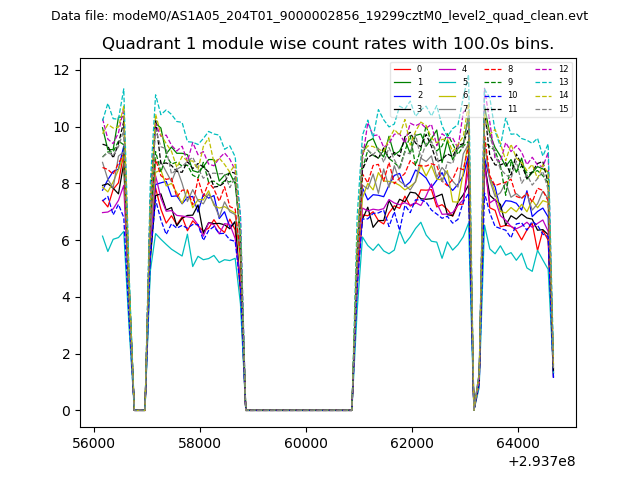
| Module-wise count rates for Quadrant A Data is divided into 100 sec bins |
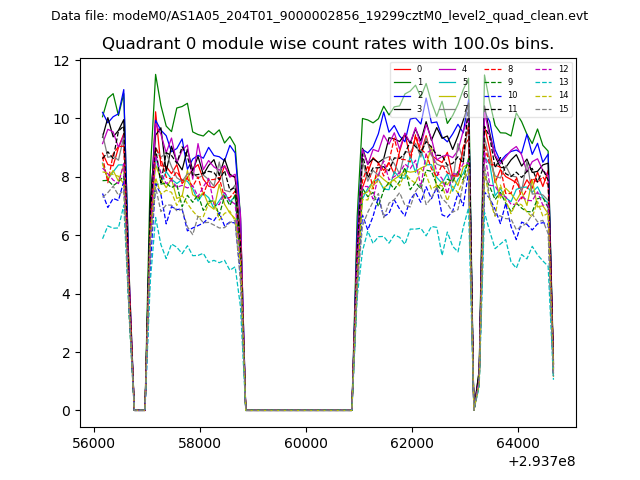 |
 |
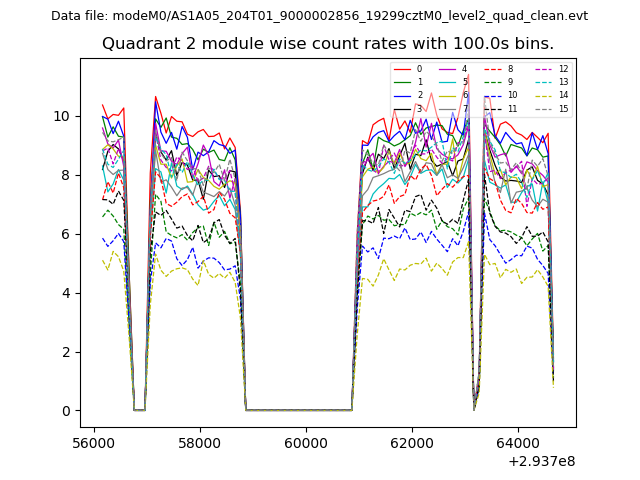
| Module-wise count rates for Quadrant B Data is divided into 100 sec bins |
 |
 |
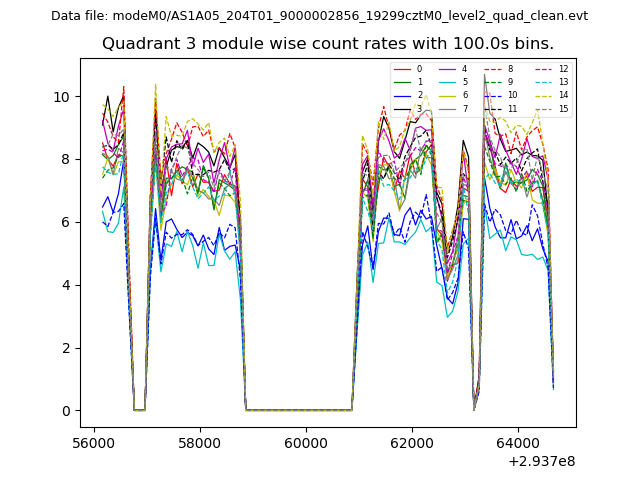
| Module-wise count rates for Quadrant C Data is divided into 100 sec bins |
 |
 |
| Module-wise count rates for Quadrant D Data is divided into 100 sec bins |
 |
 |
| Parameter | Plot |
|---|---|
| CZT HV Monitor | 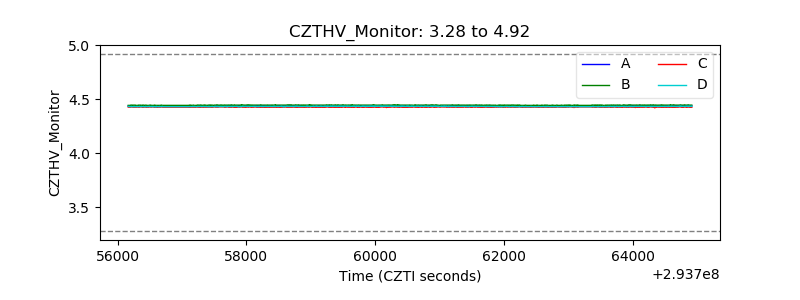 |
| D_VDD | 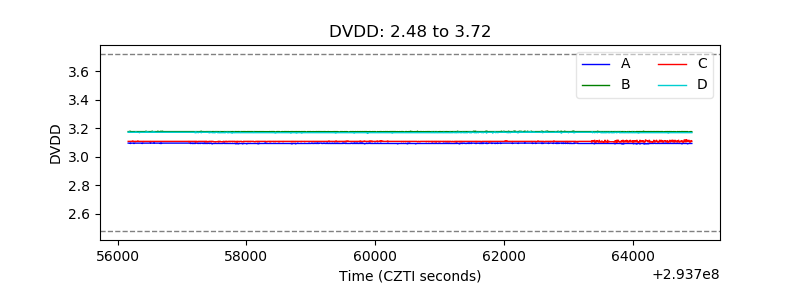 |
| Temperature 1 | 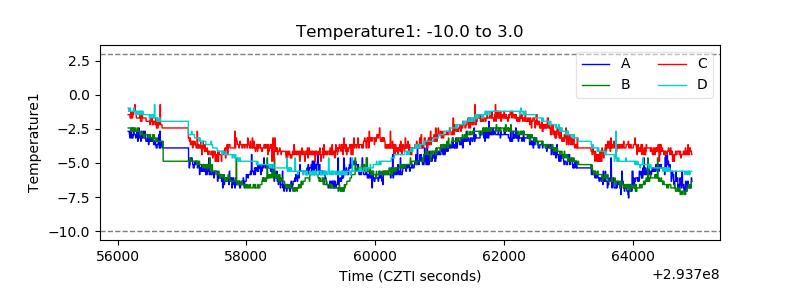 |
| Veto HV Monitor | 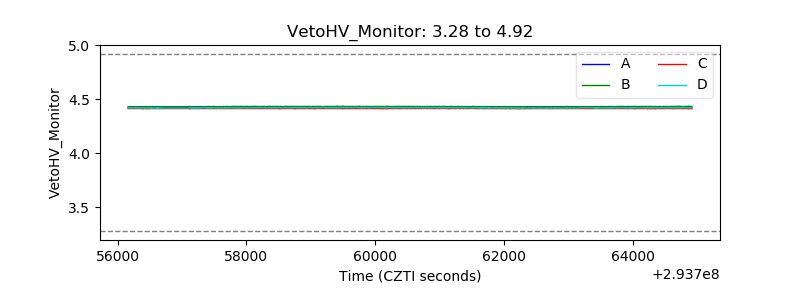 |
| Veto LLD | 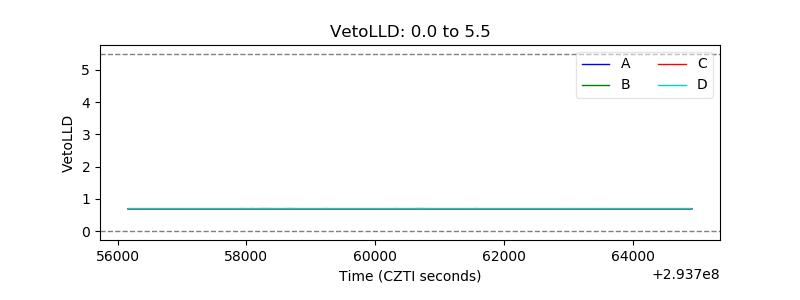 |
| Alpha Counter | 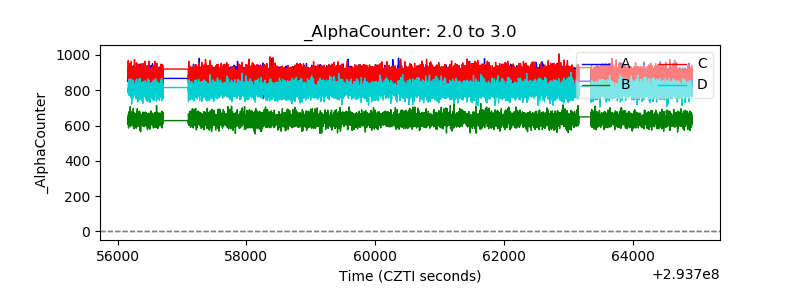 |
| _CPM_Rate | 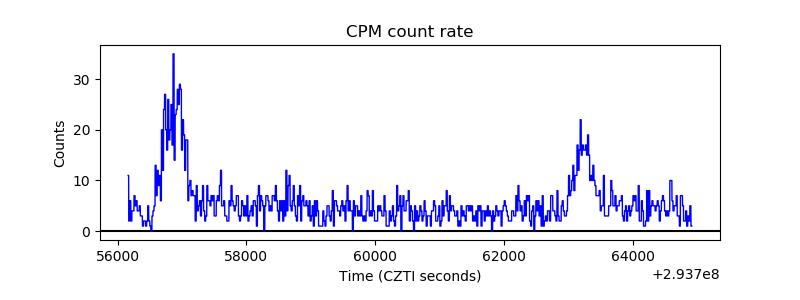 |
| CZT Counter | 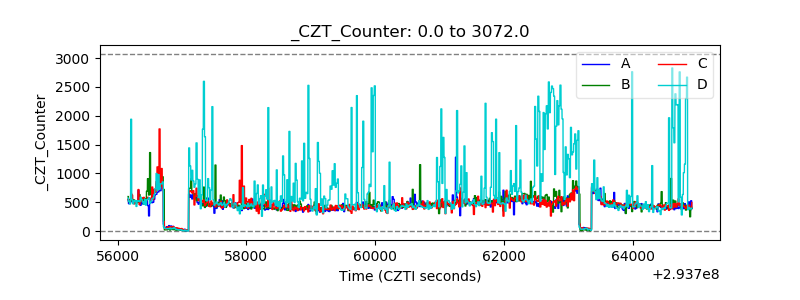 |
| +2.5 Volts monitor | 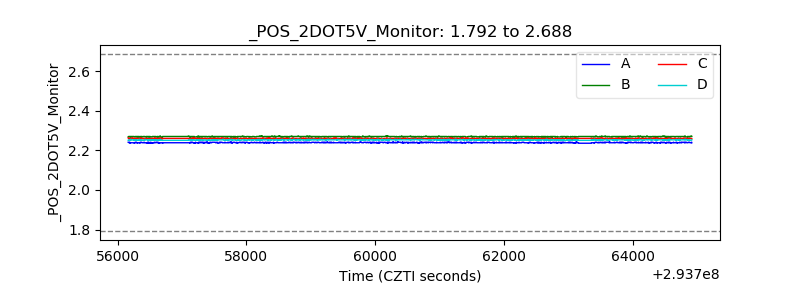 |
| +5 Volts monitor |  |
| _ROLL_ROT | 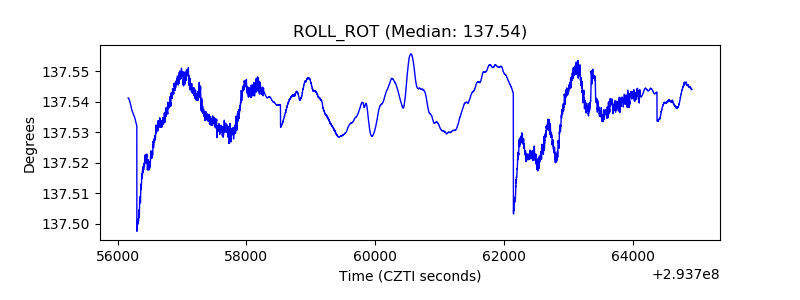 |
| _Roll_DEC | 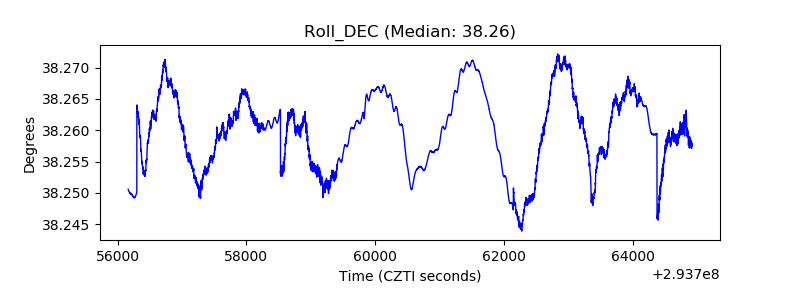 |
| _Roll_RA | 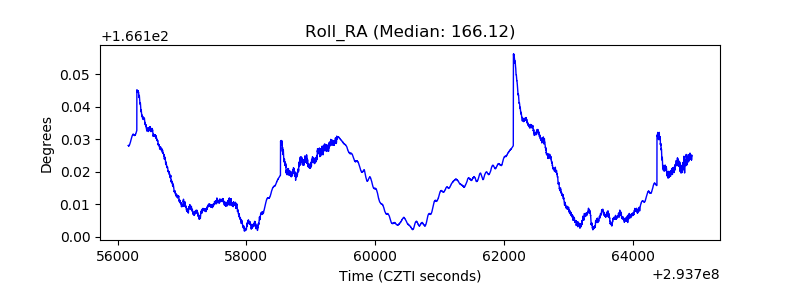 |
| Veto Counter | 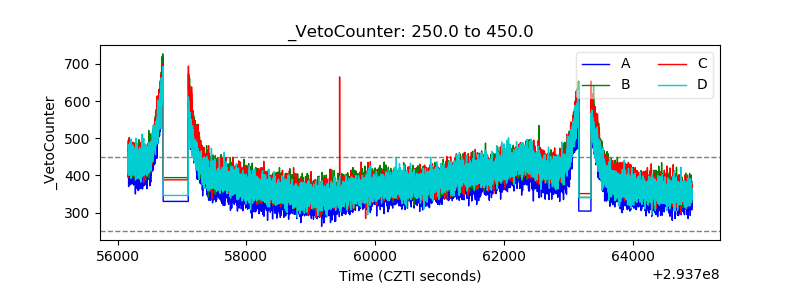 |