| Param | Original file | Final file |
|---|---|---|
| Filename | modeM0/AS1A05_204T01_9000002856_19300cztM0_level2.evt | modeM0/AS1A05_204T01_9000002856_19300cztM0_level2_quad_clean.evt |
| Size (bytes) | 640,630,080 | 105,396,480 |
| Size | 611.0 MB | 100.5 MB |
| Events in quadrant A | 3,848,345 | 686,521 |
| Events in quadrant B | 4,048,832 | 694,333 |
| Events in quadrant C | 3,914,051 | 666,998 |
| Events in quadrant D | 7,031,867 | 571,483 |
| Mode M0 | |||
|---|---|---|---|
| Quadrant | BADHDUFLAG | Total packets | Discarded packets |
| A | 0 | 16977 | 3 |
| B | 0 | 17527 | 3 |
| C | 0 | 17032 | 3 |
| D | 0 | 26751 | 3 |
| Mode M9 | |||
|---|---|---|---|
| Quadrant | BADHDUFLAG | Total packets | Discarded packets |
| A | 0 | 4 | 0 |
| B | 0 | 4 | 0 |
| C | 0 | 4 | 0 |
| D | 0 | 4 | 0 |
| Mode SS | |||
|---|---|---|---|
| Quadrant | BADHDUFLAG | Total packets | Discarded packets |
| A | 0 | 170 | 0 |
| B | 0 | 170 | 0 |
| C | 0 | 170 | 0 |
| D | 0 | 170 | 0 |
| Quadrant | Total seconds | Saturated seconds | Saturation percentage |
|---|---|---|---|
| A | 8225 | 95 | 1.155015% |
| B | 8226 | 133 | 1.616825% |
| C | 8226 | 137 | 1.665451% |
| D | 8226 | 1414 | 17.189399% |
Noise dominated data is calculated using 1-second bins in cleaned event files. If a bin has >2000 counts, and if more than 50% of those come from <1% of pixels, then it is considered to be noise-dominated and hence unusable.
| Quadrant | # 1 sec bins | Bins with >0 counts | Bins with >2000 counts | High rate bins dominated by noise | Noise dominated (total time) | Noise dominated (detector-on time) | Marked lightcurve |
|---|---|---|---|---|---|---|---|
| A | 8690 | 8227 | 0 | 0 | 0.00% | 0.00% | 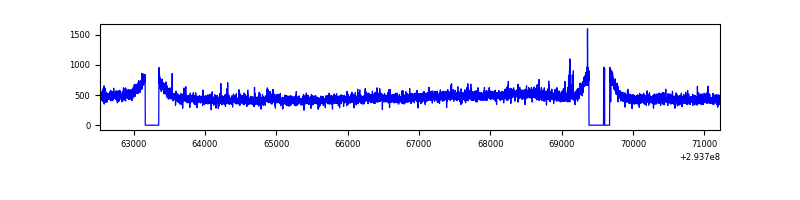 |
| B | 8691 | 8228 | 1 | 1 | 0.01% | 0.01% | 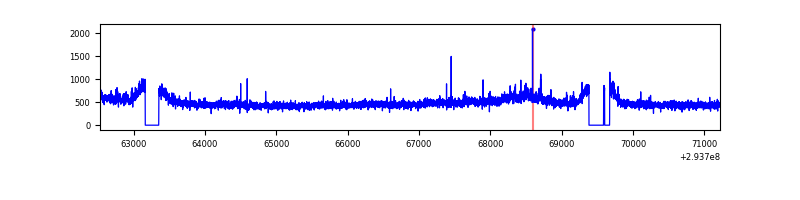 |
| C | 8691 | 8229 | 0 | 0 | 0.00% | 0.00% | 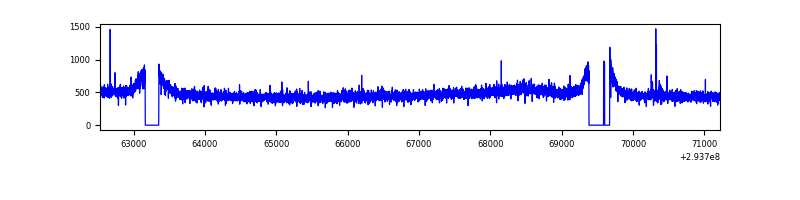 |
| D | 8691 | 8228 | 1067 | 1067 | 12.28% | 12.97% | 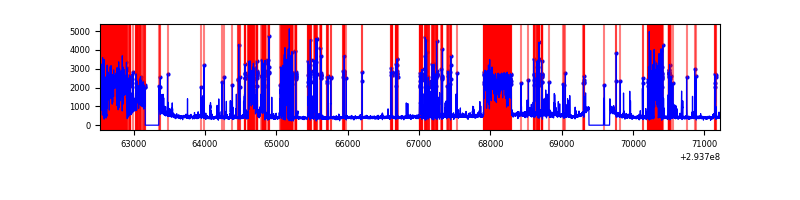 |
Top three noisy pixels from each quadrant. If the there are fewer than three noisy pixels in the level2.evt file, extra rows are filled as -1
| Pixel properties | Quadrant properties | ||||||
|---|---|---|---|---|---|---|---|
| Quadrant | DetID | PixID | Counts | Sigma | Mean | Median | Sigma |
| A | 9 | 143 | 33693 | 163.39 | 988 | 964 | 200.3 |
| A | 13 | 254 | 12054 | 55.36 | 988 | 964 | 200.3 |
| A | 0 | 226 | 8460 | 37.42 | 988 | 964 | 200.3 |
| B | 0 | 229 | 163804 | 855.03 | 985 | 957 | 190.5 |
| B | 12 | 111 | 23909 | 120.51 | 985 | 957 | 190.5 |
| B | 11 | 111 | 20594 | 103.1 | 985 | 957 | 190.5 |
| C | 14 | 238 | 146410 | 646.3 | 956 | 961 | 225.1 |
| C | 8 | 128 | 14802 | 61.5 | 956 | 961 | 225.1 |
| C | 9 | 54 | 10509 | 42.43 | 956 | 961 | 225.1 |
| D | 1 | 52 | 3020718 | 14394.54 | 871 | 845 | 209.8 |
| D | 13 | 138 | 481614 | 2291.64 | 871 | 845 | 209.8 |
| D | 13 | 104 | 100753 | 476.22 | 871 | 845 | 209.8 |
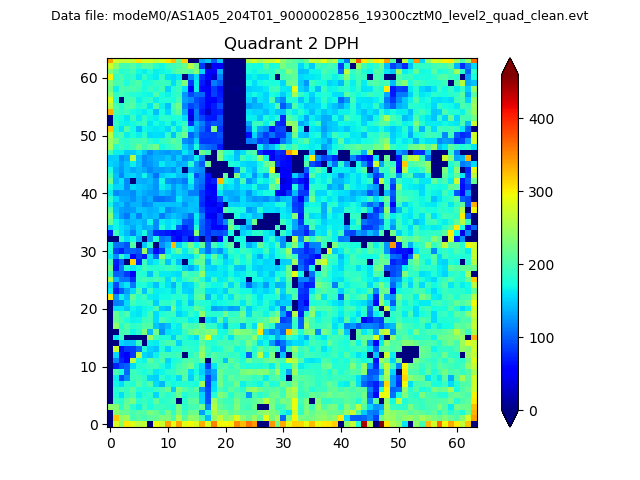
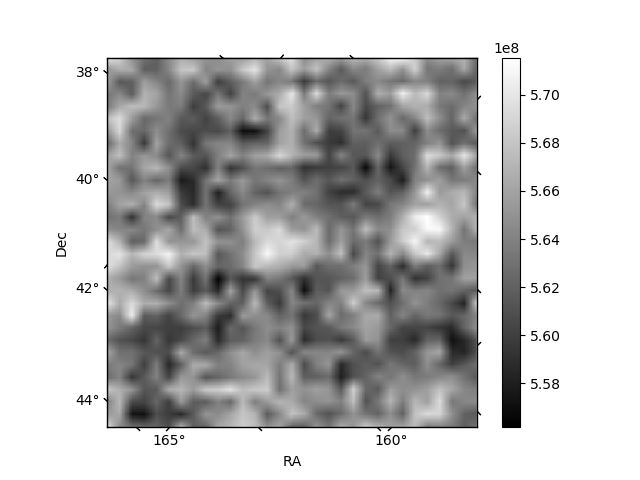
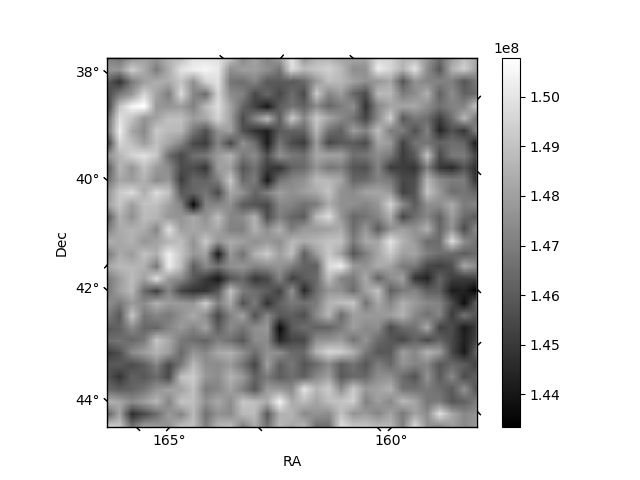
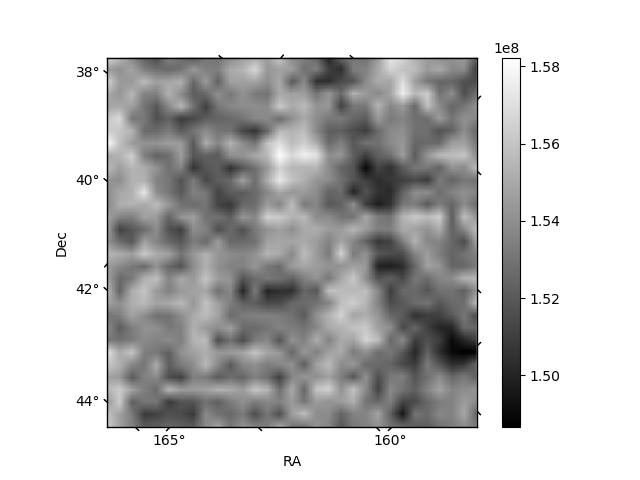
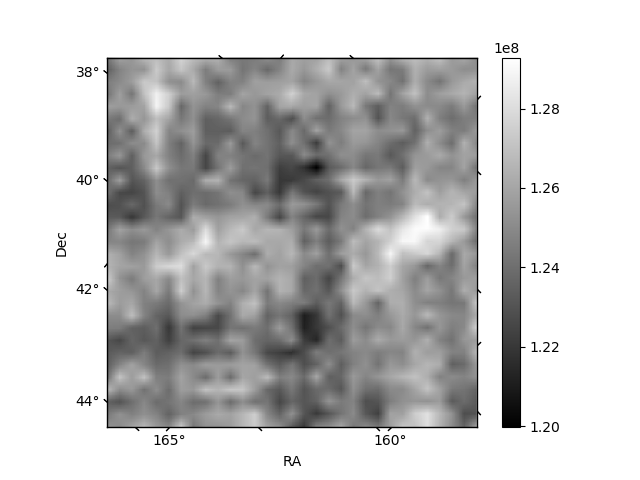
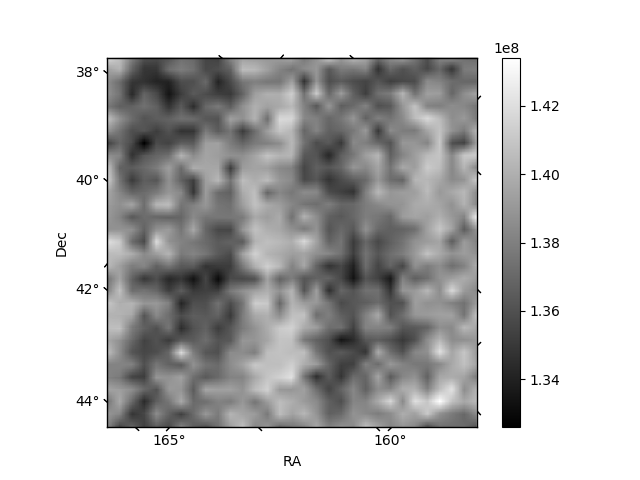
Histogram calculated using DETX and DETY for each event in the final _common_clean file
| Quadrant A | 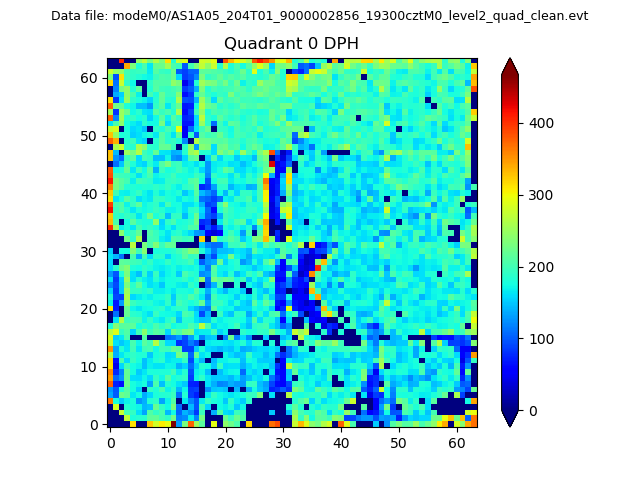 |
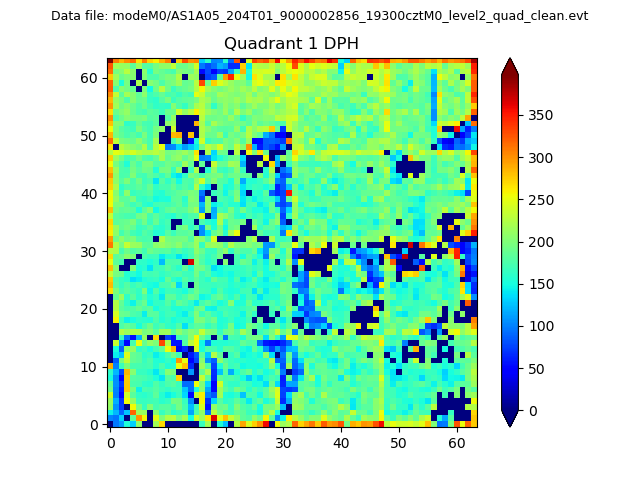 |
Quadrant B |
|---|---|---|---|
| Quadrant D | 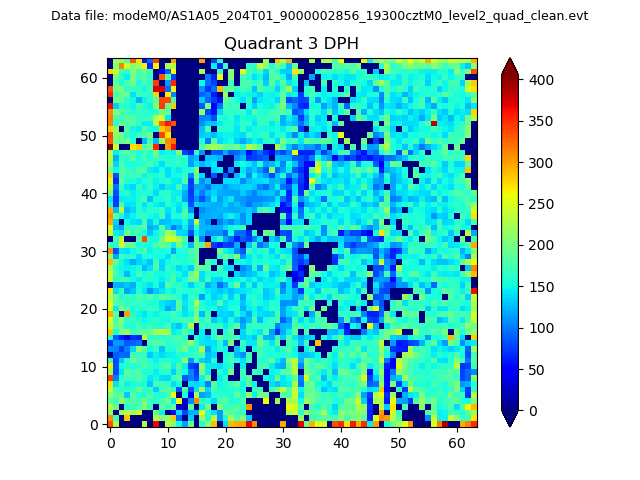 |
 |
Quadrant C |
| Plot type | Count rate plots | Images |
|---|---|---|
| Comparison with Poisson distribution Blue bars denote a histogram of data divided into 1 sec bins. Red curve is a Poisson curve with rate = median count rate of data. |
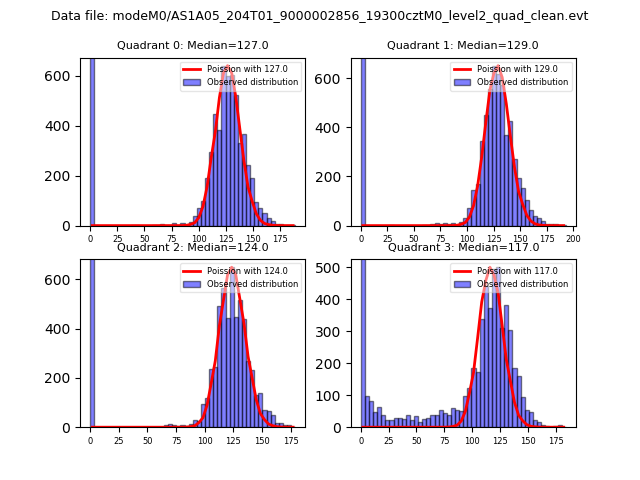 |
 |
| Quadrant-wise count rates Data is divided into 100 sec bins |
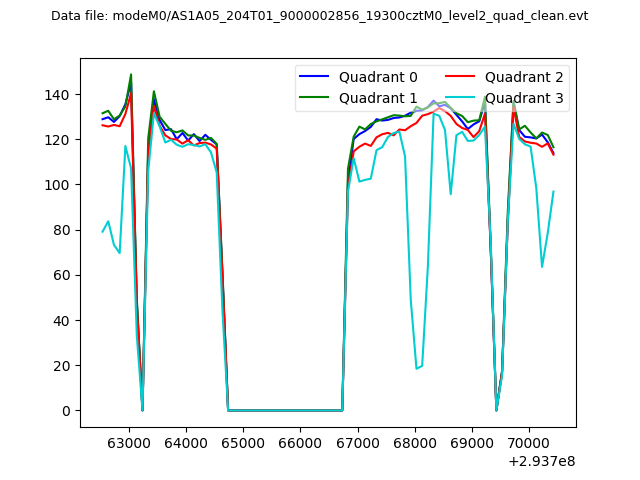 |
|
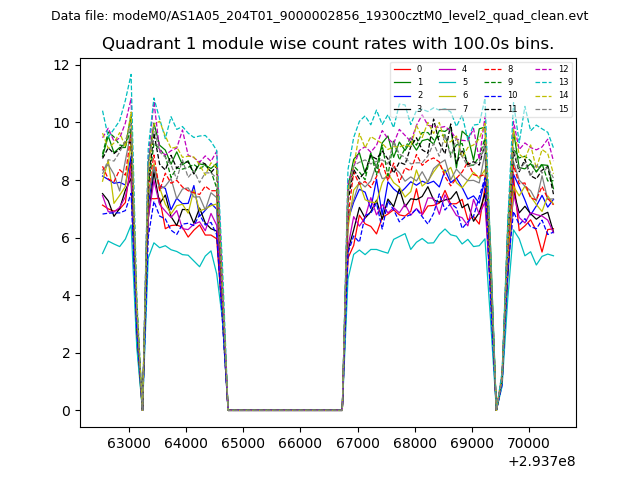
| Module-wise count rates for Quadrant A Data is divided into 100 sec bins |
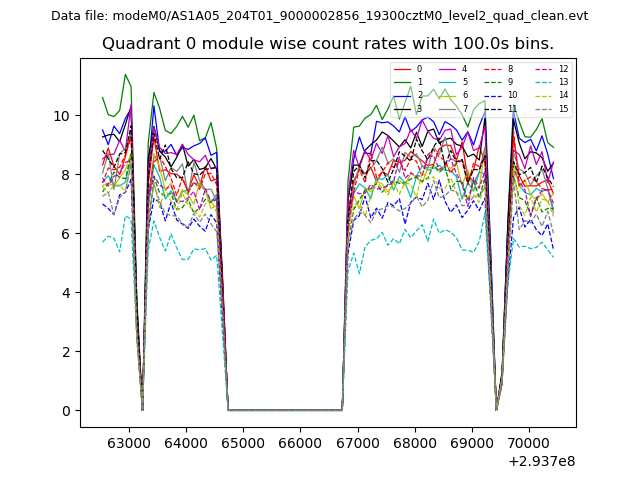 |
 |
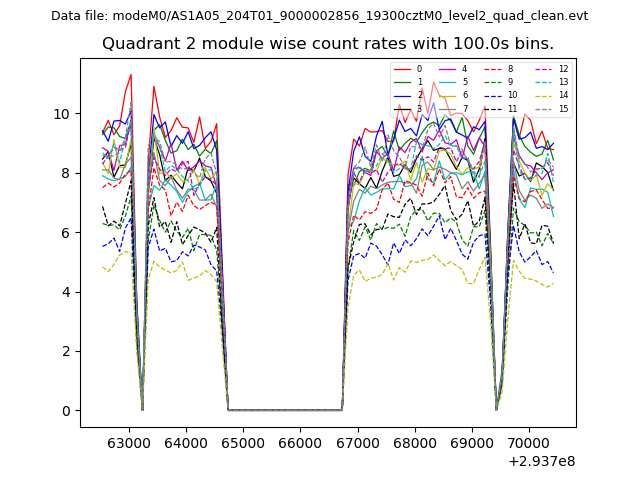
| Module-wise count rates for Quadrant B Data is divided into 100 sec bins |
 |
 |
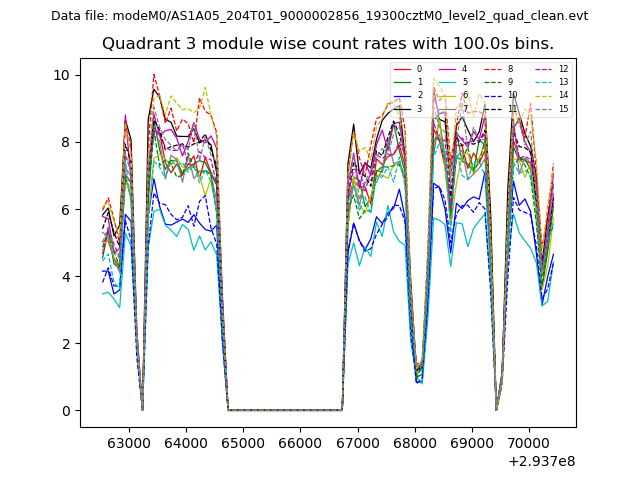
| Module-wise count rates for Quadrant C Data is divided into 100 sec bins |
 |
 |
| Module-wise count rates for Quadrant D Data is divided into 100 sec bins |
 |
 |
| Parameter | Plot |
|---|---|
| CZT HV Monitor | 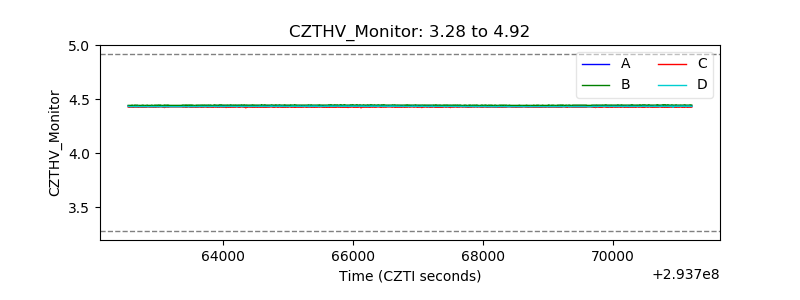 |
| D_VDD | 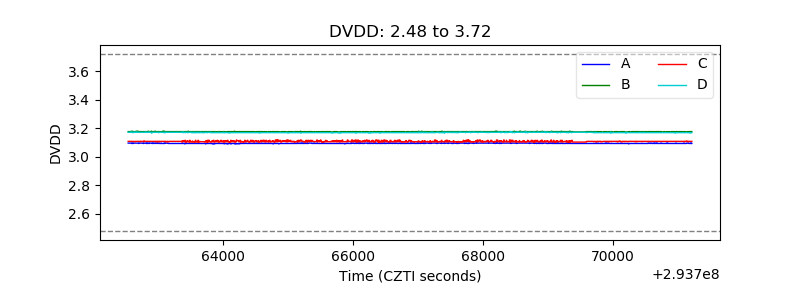 |
| Temperature 1 | 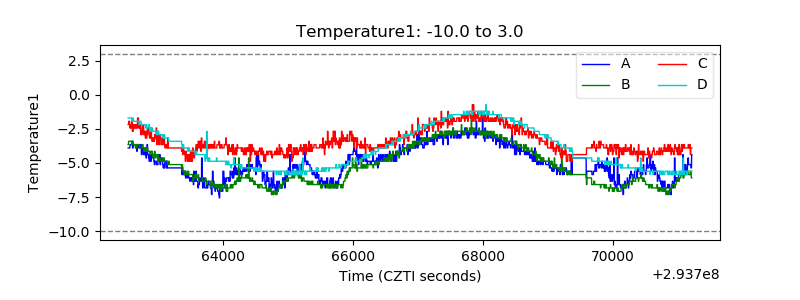 |
| Veto HV Monitor | 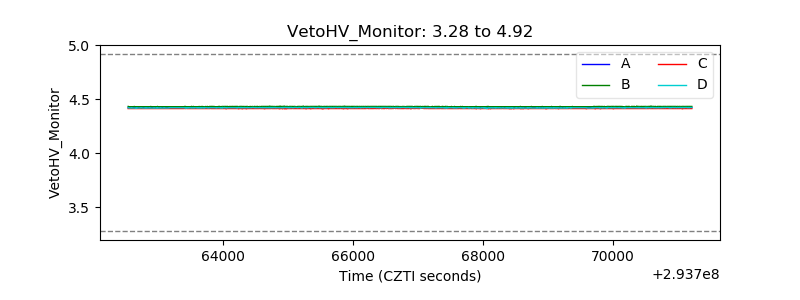 |
| Veto LLD | 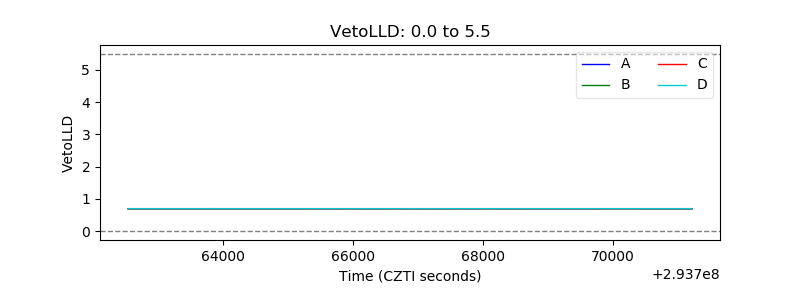 |
| Alpha Counter | 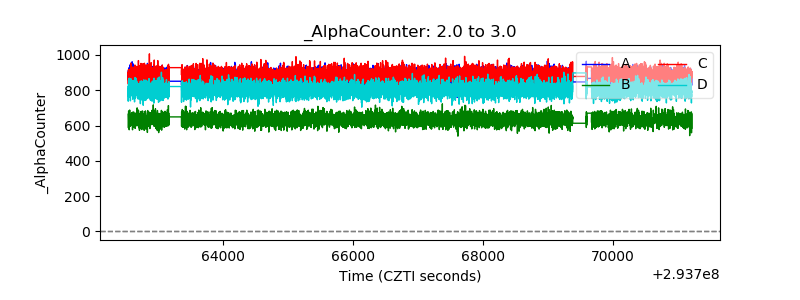 |
| _CPM_Rate | 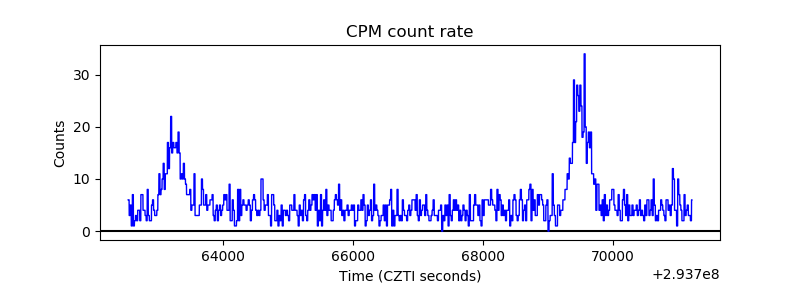 |
| CZT Counter | 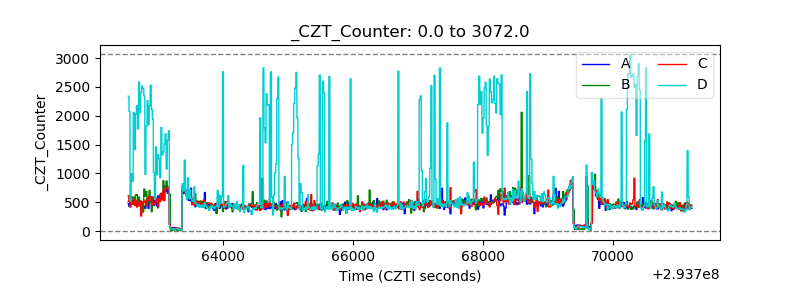 |
| +2.5 Volts monitor |  |
| +5 Volts monitor | 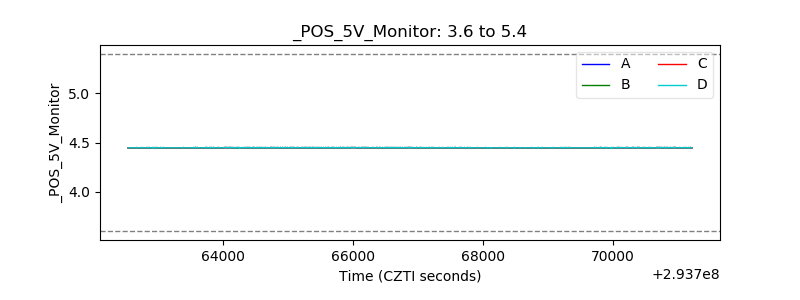 |
| _ROLL_ROT | 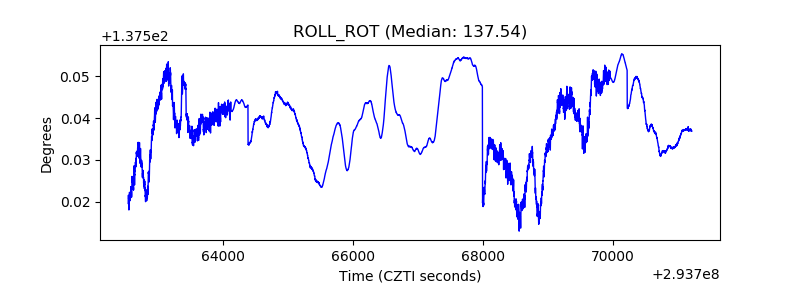 |
| _Roll_DEC | 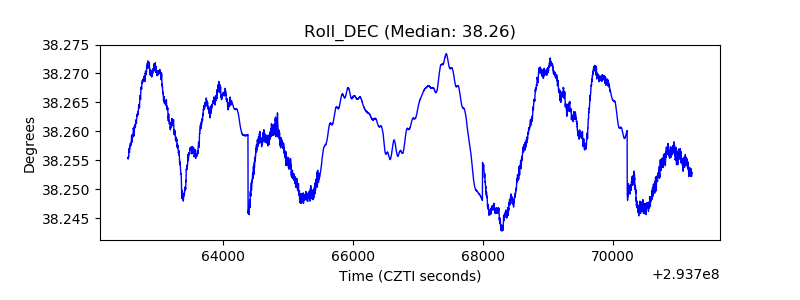 |
| _Roll_RA | 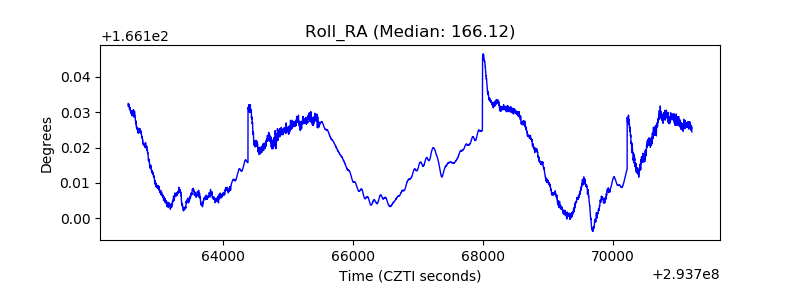 |
| Veto Counter | 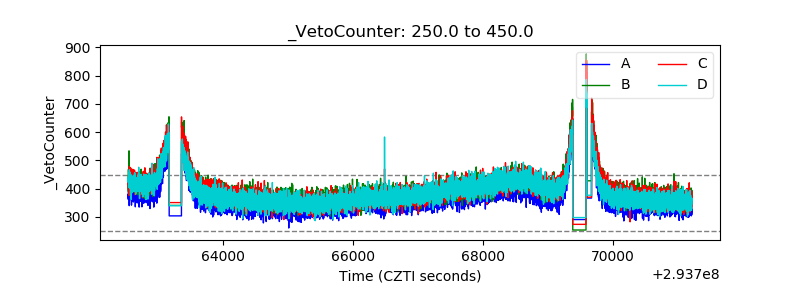 |