| Param | Original file | Final file |
|---|---|---|
| Filename | modeM0/AS1A05_204T01_9000002856_19302cztM0_level2.evt | modeM0/AS1A05_204T01_9000002856_19302cztM0_level2_quad_clean.evt |
| Size (bytes) | 1,068,721,920 | 158,155,200 |
| Size | 1019.2 MB | 150.8 MB |
| Events in quadrant A | 6,501,287 | 996,790 |
| Events in quadrant B | 6,615,380 | 1,010,863 |
| Events in quadrant C | 6,480,253 | 966,250 |
| Events in quadrant D | 11,841,334 | 867,420 |
| Mode M0 | |||
|---|---|---|---|
| Quadrant | BADHDUFLAG | Total packets | Discarded packets |
| A | 0 | 28297 | 8 |
| B | 0 | 28312 | 4 |
| C | 0 | 28151 | 4 |
| D | 0 | 44635 | 4 |
| Mode M9 | |||
|---|---|---|---|
| Quadrant | BADHDUFLAG | Total packets | Discarded packets |
| A | 0 | 14 | 0 |
| B | 0 | 14 | 0 |
| C | 0 | 14 | 0 |
| D | 0 | 14 | 0 |
| Mode SS | |||
|---|---|---|---|
| Quadrant | BADHDUFLAG | Total packets | Discarded packets |
| A | 0 | 280 | 0 |
| B | 0 | 280 | 0 |
| C | 0 | 280 | 0 |
| D | 0 | 280 | 0 |
| Quadrant | Total seconds | Saturated seconds | Saturation percentage |
|---|---|---|---|
| A | 13721 | 224 | 1.632534% |
| B | 13722 | 257 | 1.872905% |
| C | 13722 | 260 | 1.894768% |
| D | 13722 | 1903 | 13.868241% |
Noise dominated data is calculated using 1-second bins in cleaned event files. If a bin has >2000 counts, and if more than 50% of those come from <1% of pixels, then it is considered to be noise-dominated and hence unusable.
| Quadrant | # 1 sec bins | Bins with >0 counts | Bins with >2000 counts | High rate bins dominated by noise | Noise dominated (total time) | Noise dominated (detector-on time) | Marked lightcurve |
|---|---|---|---|---|---|---|---|
| A | 15101 | 13722 | 2 | 2 | 0.01% | 0.01% | 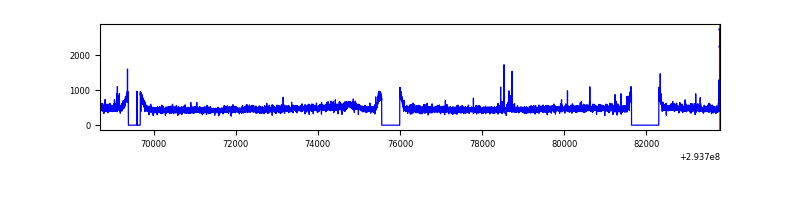 |
| B | 15102 | 13723 | 0 | 0 | 0.00% | 0.00% | 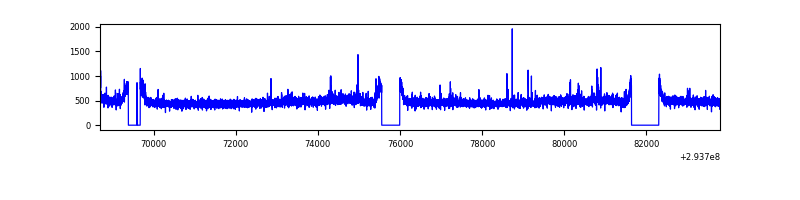 |
| C | 15102 | 13725 | 0 | 0 | 0.00% | 0.00% | 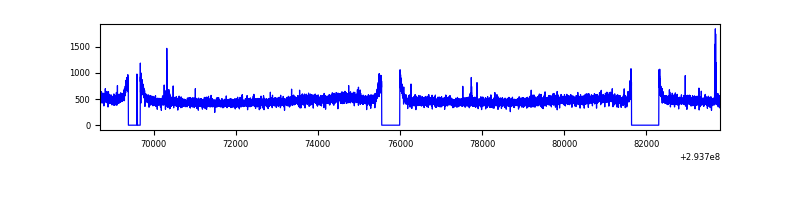 |
| D | 15102 | 13724 | 1585 | 1585 | 10.50% | 11.55% | 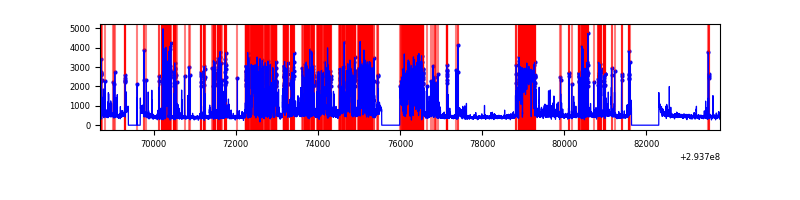 |
Top three noisy pixels from each quadrant. If the there are fewer than three noisy pixels in the level2.evt file, extra rows are filled as -1
| Pixel properties | Quadrant properties | ||||||
|---|---|---|---|---|---|---|---|
| Quadrant | DetID | PixID | Counts | Sigma | Mean | Median | Sigma |
| A | 9 | 143 | 72182 | 210.08 | 1655 | 1615 | 335.9 |
| A | 4 | 2 | 37314 | 106.28 | 1655 | 1615 | 335.9 |
| A | 13 | 254 | 18255 | 49.54 | 1655 | 1615 | 335.9 |
| B | 0 | 229 | 86401 | 267.19 | 1648 | 1600 | 317.4 |
| B | 12 | 111 | 40309 | 121.97 | 1648 | 1600 | 317.4 |
| B | 11 | 111 | 35626 | 107.21 | 1648 | 1600 | 317.4 |
| C | 14 | 238 | 242955 | 641.81 | 1590 | 1600 | 376.1 |
| C | 9 | 54 | 30757 | 77.53 | 1590 | 1600 | 376.1 |
| C | 13 | 61 | 11046 | 25.12 | 1590 | 1600 | 376.1 |
| D | 1 | 52 | 4231519 | 11398.8 | 1531 | 1486 | 371.1 |
| D | 10 | 199 | 936050 | 2518.4 | 1531 | 1486 | 371.1 |
| D | 7 | 238 | 561561 | 1509.25 | 1531 | 1486 | 371.1 |
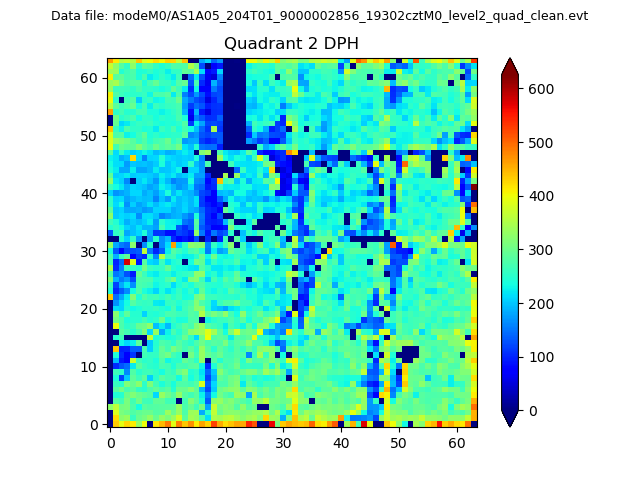
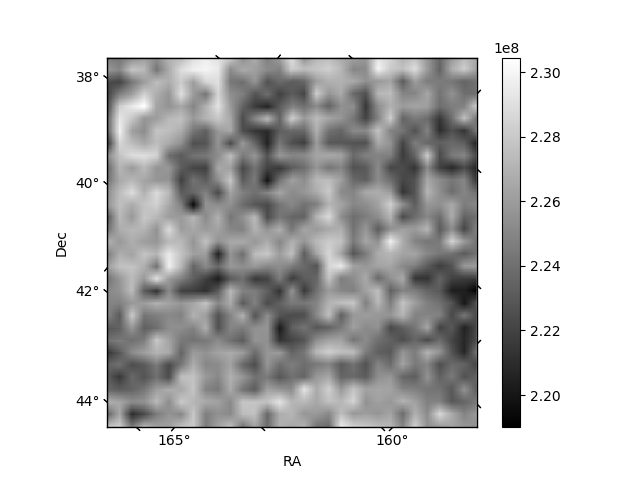
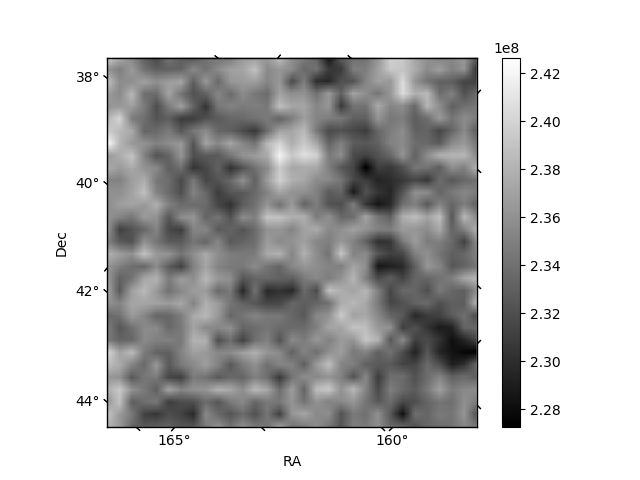
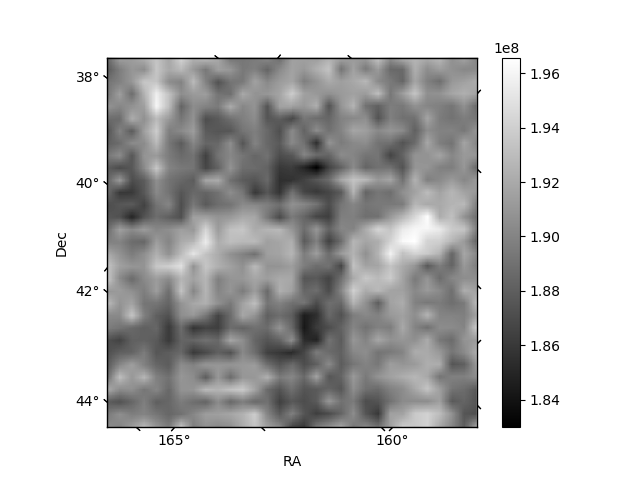
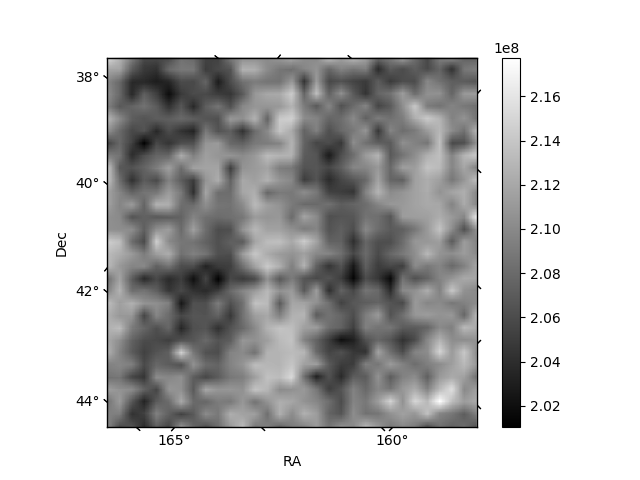
Histogram calculated using DETX and DETY for each event in the final _common_clean file
| Quadrant A | 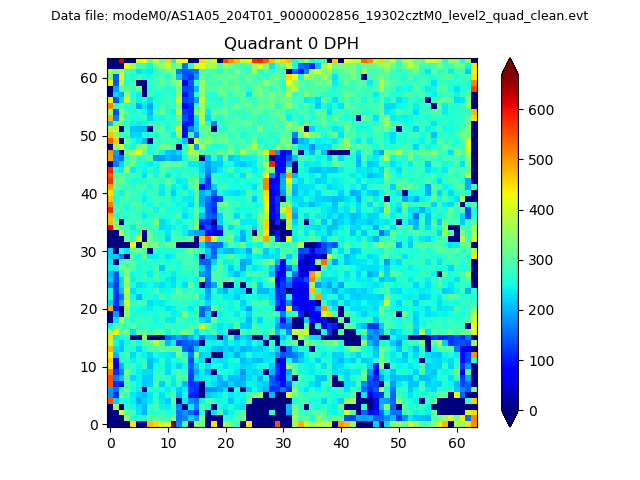 |
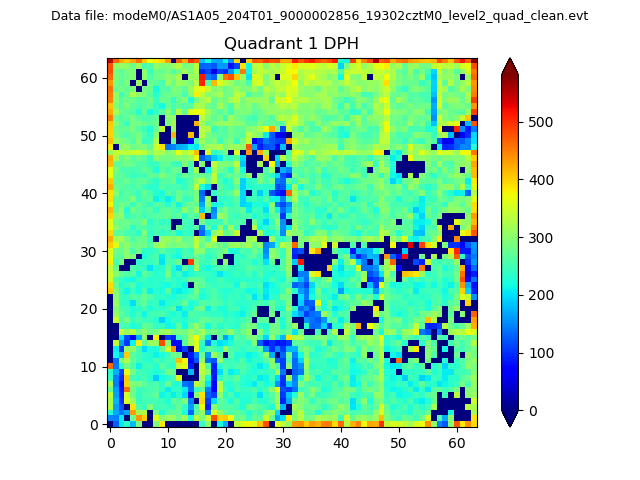 |
Quadrant B |
|---|---|---|---|
| Quadrant D | 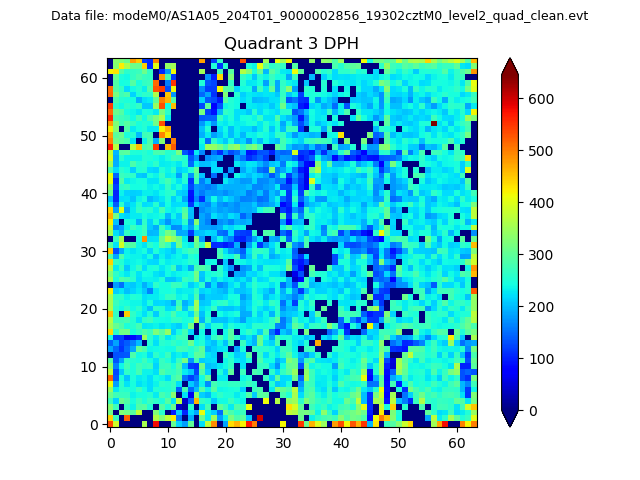 |
 |
Quadrant C |
| Plot type | Count rate plots | Images |
|---|---|---|
| Comparison with Poisson distribution Blue bars denote a histogram of data divided into 1 sec bins. Red curve is a Poisson curve with rate = median count rate of data. |
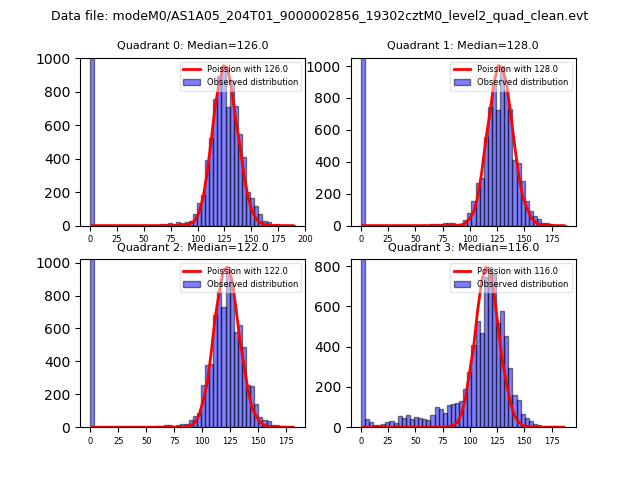 |
 |
| Quadrant-wise count rates Data is divided into 100 sec bins |
 |
|
| Module-wise count rates for Quadrant A Data is divided into 100 sec bins |
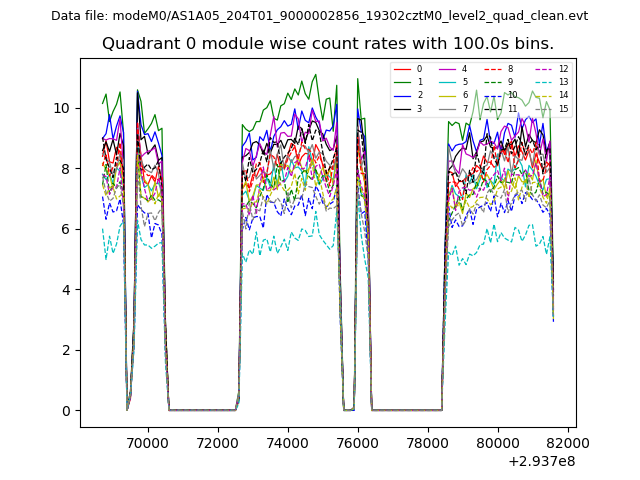 |
 |
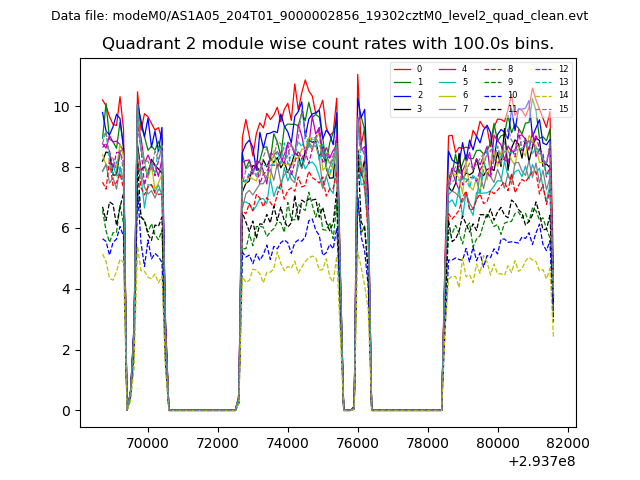
| Module-wise count rates for Quadrant B Data is divided into 100 sec bins |
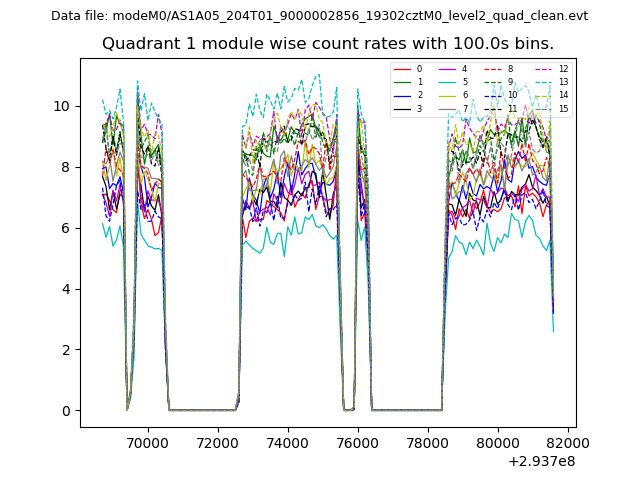 |
 |
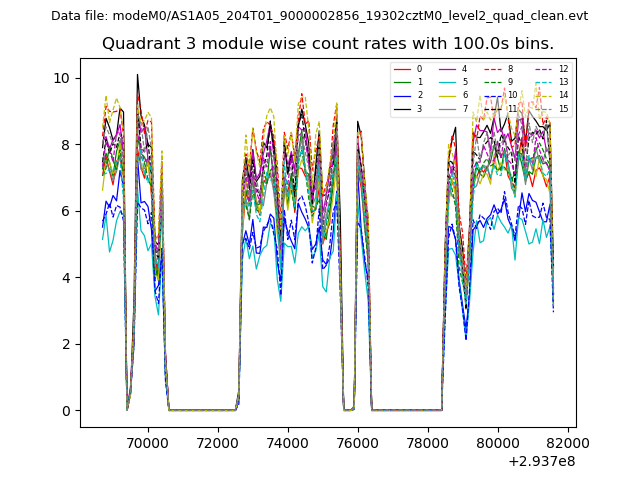
| Module-wise count rates for Quadrant C Data is divided into 100 sec bins |
 |
 |
| Module-wise count rates for Quadrant D Data is divided into 100 sec bins |
 |
 |
| Parameter | Plot |
|---|---|
| CZT HV Monitor | 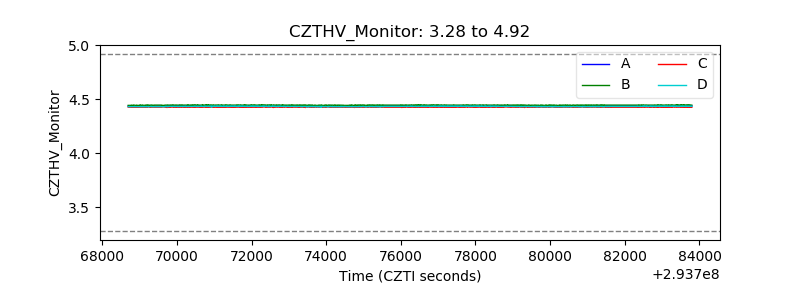 |
| D_VDD | 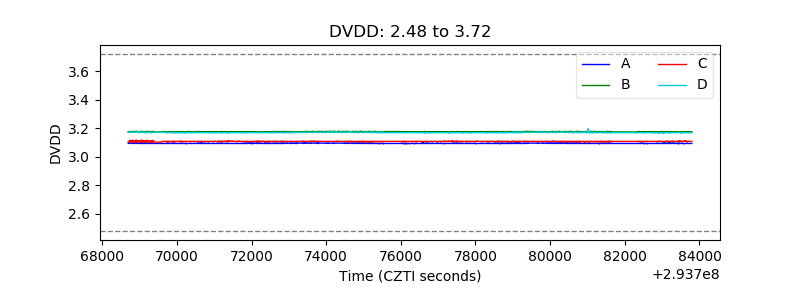 |
| Temperature 1 | 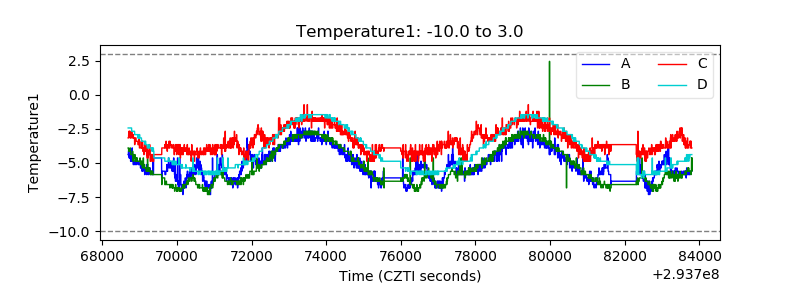 |
| Veto HV Monitor | 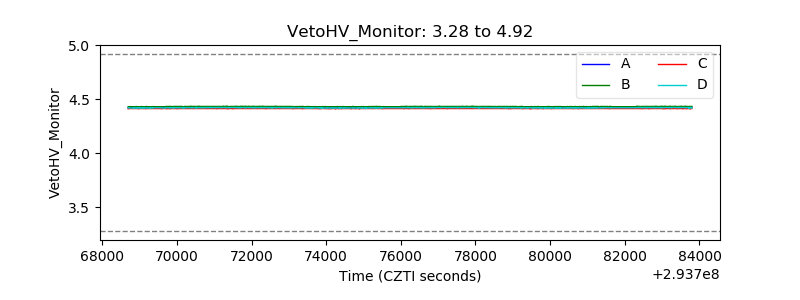 |
| Veto LLD | 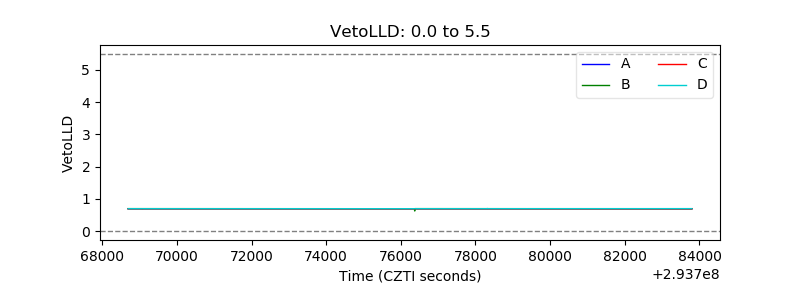 |
| Alpha Counter | 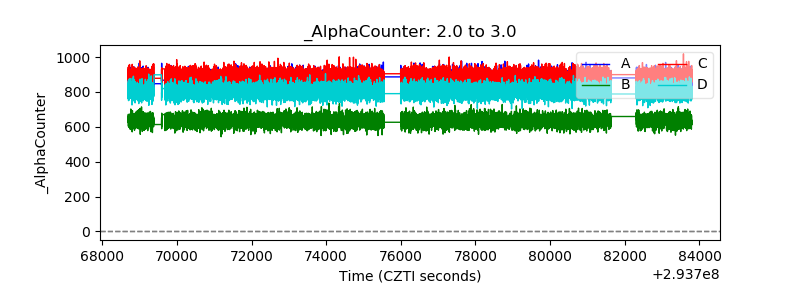 |
| _CPM_Rate | 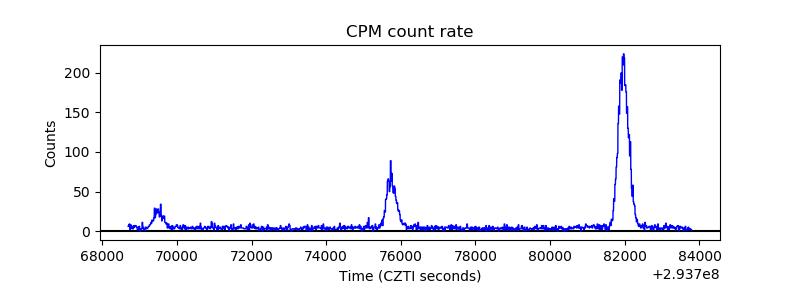 |
| CZT Counter | 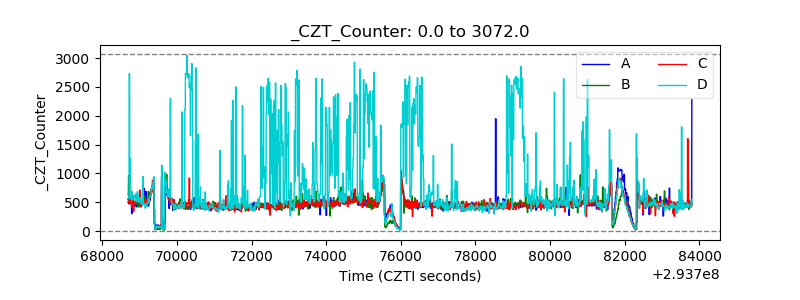 |
| +2.5 Volts monitor |  |
| +5 Volts monitor |  |
| _ROLL_ROT | 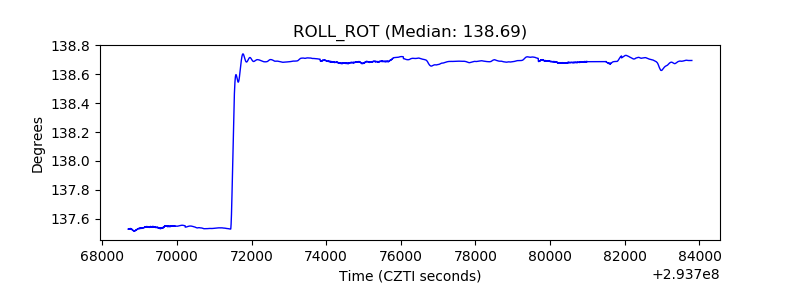 |
| _Roll_DEC | 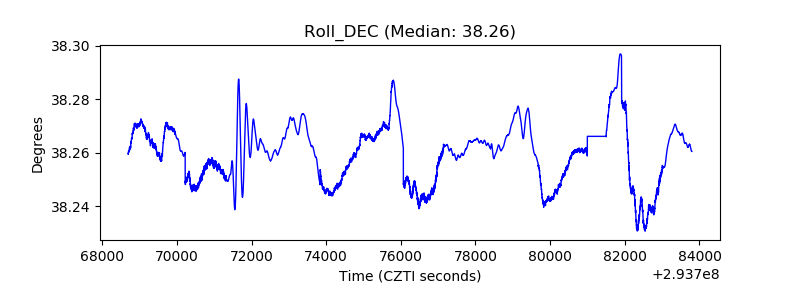 |
| _Roll_RA |  |
| Veto Counter | 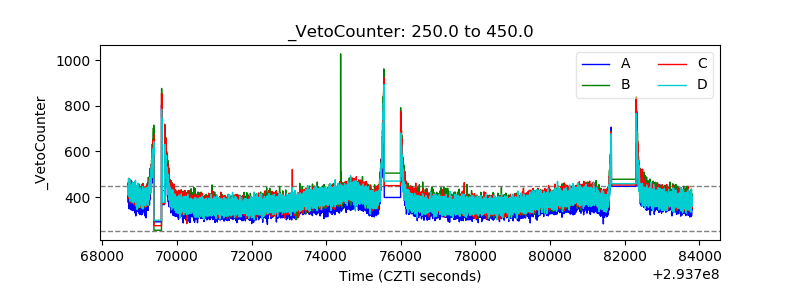 |