| Param | Original file | Final file |
|---|---|---|
| Filename | modeM0/AS1A05_204T01_9000002856_19304cztM0_level2.evt | modeM0/AS1A05_204T01_9000002856_19304cztM0_level2_quad_clean.evt |
| Size (bytes) | 511,418,880 | 80,510,400 |
| Size | 487.7 MB | 76.8 MB |
| Events in quadrant A | 3,550,575 | 505,472 |
| Events in quadrant B | 3,342,682 | 509,781 |
| Events in quadrant C | 3,336,139 | 485,085 |
| Events in quadrant D | 4,801,212 | 467,431 |
| Mode M0 | |||
|---|---|---|---|
| Quadrant | BADHDUFLAG | Total packets | Discarded packets |
| A | 0 | 14936 | 2 |
| B | 0 | 14066 | 3 |
| C | 0 | 14064 | 2 |
| D | 0 | 18632 | 2 |
| Mode M9 | |||
|---|---|---|---|
| Quadrant | BADHDUFLAG | Total packets | Discarded packets |
| A | 0 | 19 | 0 |
| B | 0 | 19 | 0 |
| C | 0 | 19 | 0 |
| D | 0 | 19 | 0 |
| Mode SS | |||
|---|---|---|---|
| Quadrant | BADHDUFLAG | Total packets | Discarded packets |
| A | 0 | 138 | 0 |
| B | 0 | 138 | 0 |
| C | 0 | 138 | 0 |
| D | 0 | 138 | 0 |
| Quadrant | Total seconds | Saturated seconds | Saturation percentage |
|---|---|---|---|
| A | 6747 | 105 | 1.556247% |
| B | 6747 | 108 | 1.600711% |
| C | 6747 | 113 | 1.674818% |
| D | 6747 | 431 | 6.388024% |
Noise dominated data is calculated using 1-second bins in cleaned event files. If a bin has >2000 counts, and if more than 50% of those come from <1% of pixels, then it is considered to be noise-dominated and hence unusable.
| Quadrant | # 1 sec bins | Bins with >0 counts | Bins with >2000 counts | High rate bins dominated by noise | Noise dominated (total time) | Noise dominated (detector-on time) | Marked lightcurve |
|---|---|---|---|---|---|---|---|
| A | 8612 | 6747 | 3 | 3 | 0.03% | 0.04% | 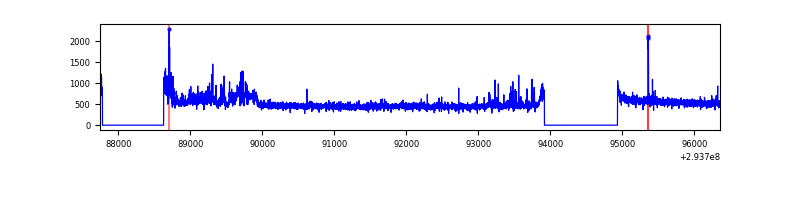 |
| B | 8612 | 6747 | 0 | 0 | 0.00% | 0.00% | 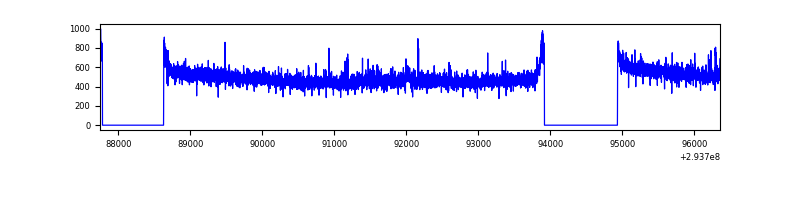 |
| C | 8612 | 6747 | 2 | 2 | 0.02% | 0.03% | 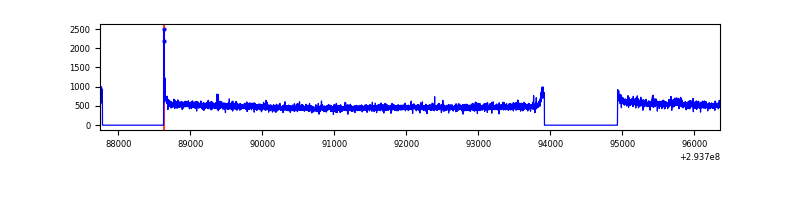 |
| D | 8612 | 6747 | 295 | 295 | 3.43% | 4.37% | 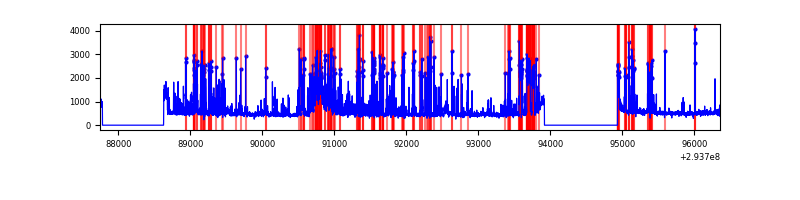 |
Top three noisy pixels from each quadrant. If the there are fewer than three noisy pixels in the level2.evt file, extra rows are filled as -1
| Pixel properties | Quadrant properties | ||||||
|---|---|---|---|---|---|---|---|
| Quadrant | DetID | PixID | Counts | Sigma | Mean | Median | Sigma |
| A | 4 | 2 | 246269 | 1431.87 | 853 | 835 | 171.4 |
| A | 11 | 29 | 15351 | 84.69 | 853 | 835 | 171.4 |
| A | 0 | 226 | 7359 | 38.06 | 853 | 835 | 171.4 |
| B | 0 | 229 | 21486 | 127.64 | 843 | 820 | 161.9 |
| B | 12 | 111 | 19984 | 118.36 | 843 | 820 | 161.9 |
| B | 11 | 111 | 17958 | 105.85 | 843 | 820 | 161.9 |
| C | 14 | 238 | 126452 | 666.41 | 809 | 812 | 188.5 |
| C | 3 | 247 | 19656 | 99.95 | 809 | 812 | 188.5 |
| C | 8 | 128 | 15571 | 78.28 | 809 | 812 | 188.5 |
| D | 11 | 176 | 701180 | 3577.67 | 807 | 782 | 195.8 |
| D | 7 | 238 | 679234 | 3465.57 | 807 | 782 | 195.8 |
| D | 1 | 52 | 150685 | 765.71 | 807 | 782 | 195.8 |
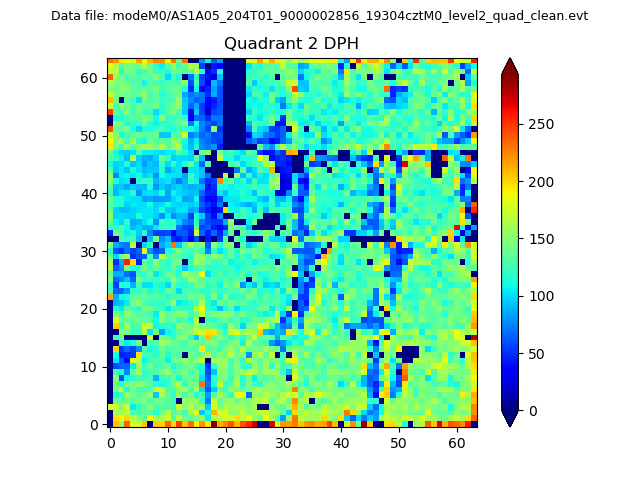
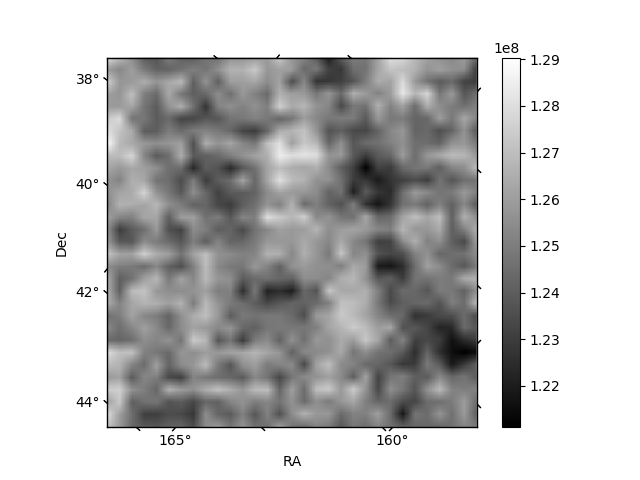
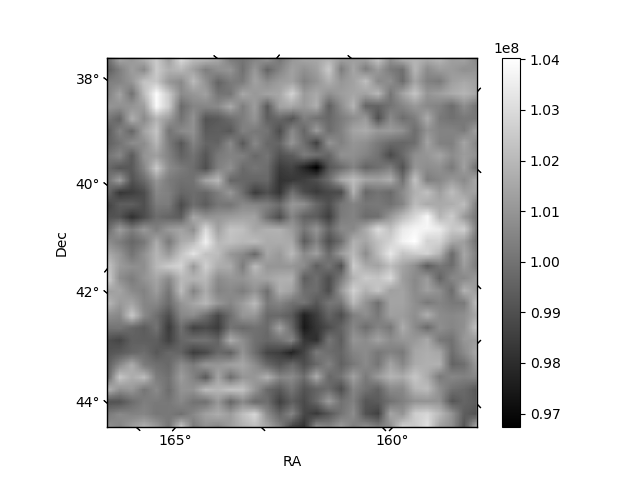
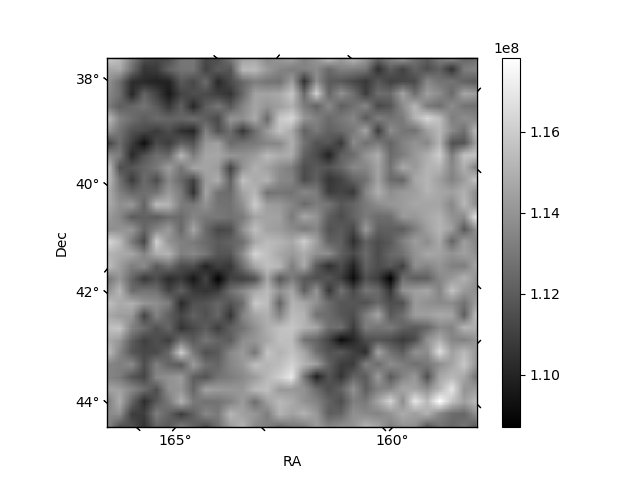
Histogram calculated using DETX and DETY for each event in the final _common_clean file
| Quadrant A | 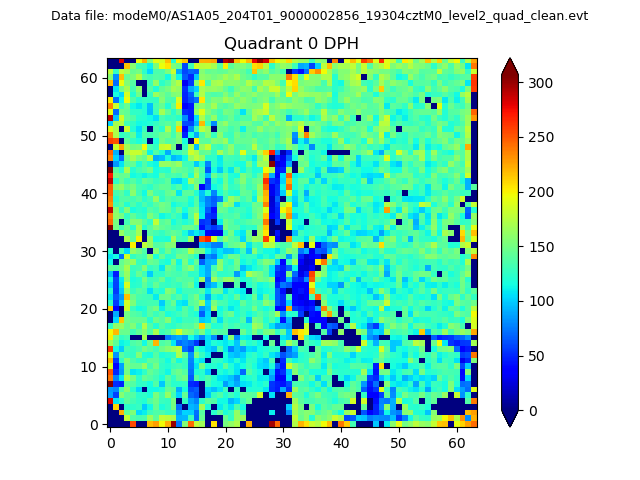 |
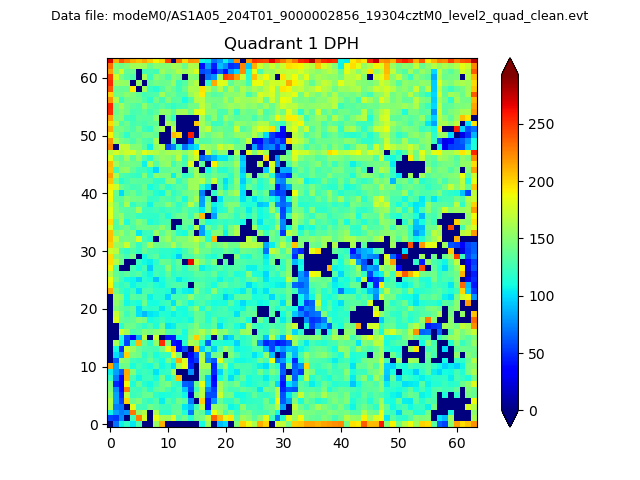 |
Quadrant B |
|---|---|---|---|
| Quadrant D | 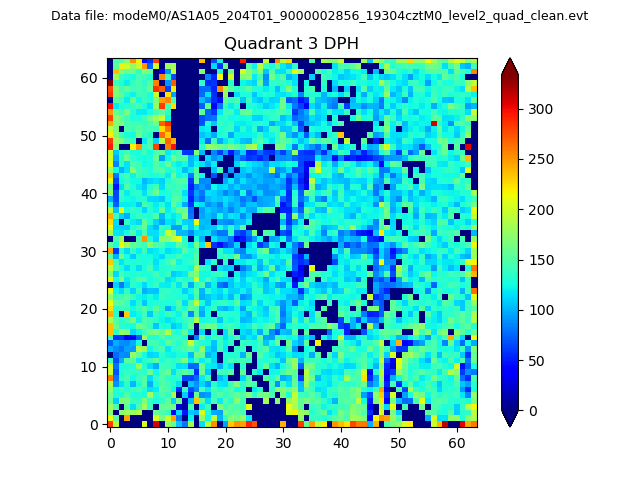 |
 |
Quadrant C |
| Plot type | Count rate plots | Images |
|---|---|---|
| Comparison with Poisson distribution Blue bars denote a histogram of data divided into 1 sec bins. Red curve is a Poisson curve with rate = median count rate of data. |
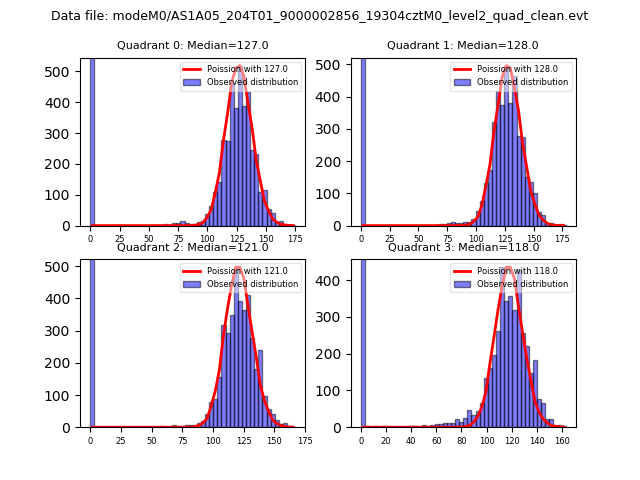 |
 |
| Quadrant-wise count rates Data is divided into 100 sec bins |
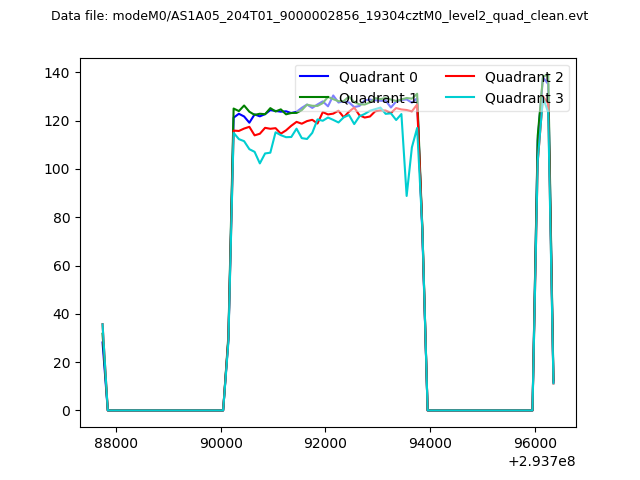 |
|
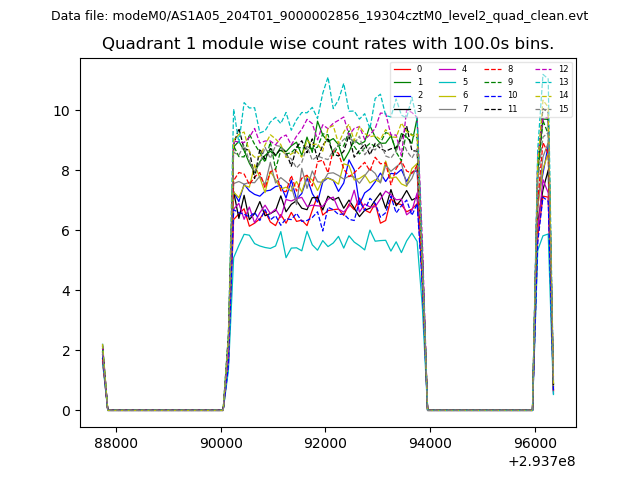
| Module-wise count rates for Quadrant A Data is divided into 100 sec bins |
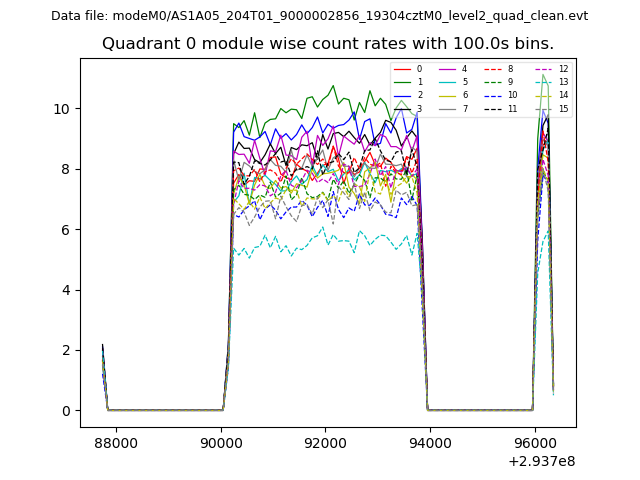 |
 |
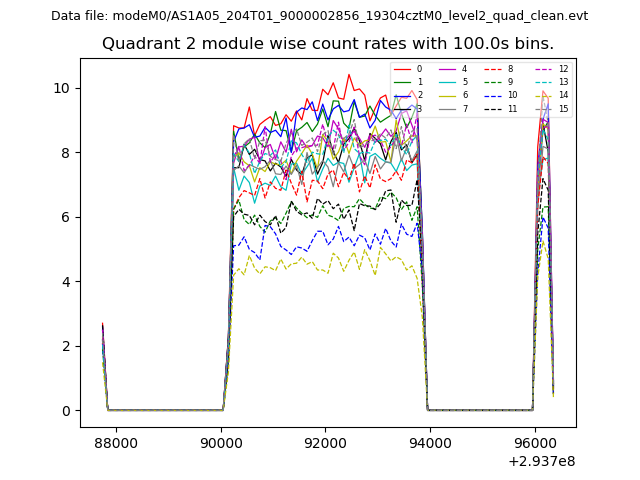
| Module-wise count rates for Quadrant B Data is divided into 100 sec bins |
 |
 |
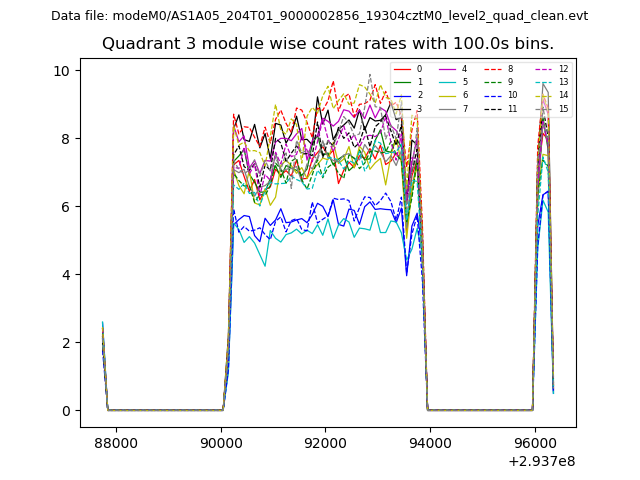
| Module-wise count rates for Quadrant C Data is divided into 100 sec bins |
 |
 |
| Module-wise count rates for Quadrant D Data is divided into 100 sec bins |
 |
 |
| Parameter | Plot |
|---|---|
| CZT HV Monitor | 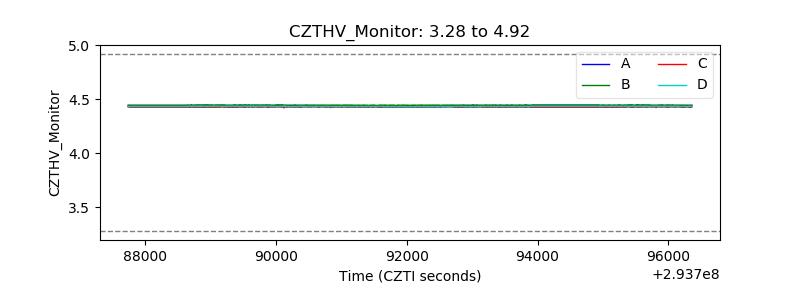 |
| D_VDD | 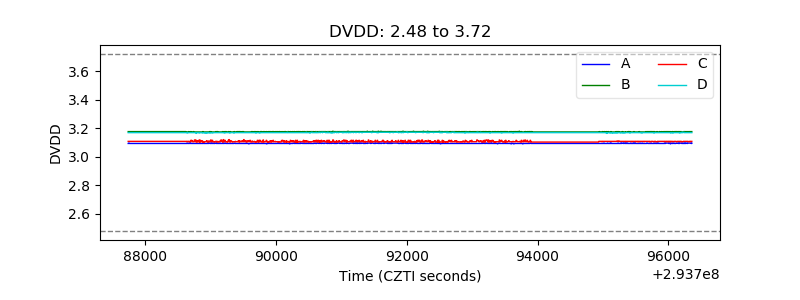 |
| Temperature 1 | 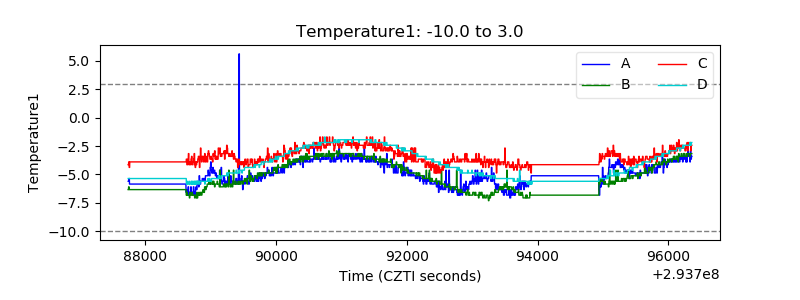 |
| Veto HV Monitor | 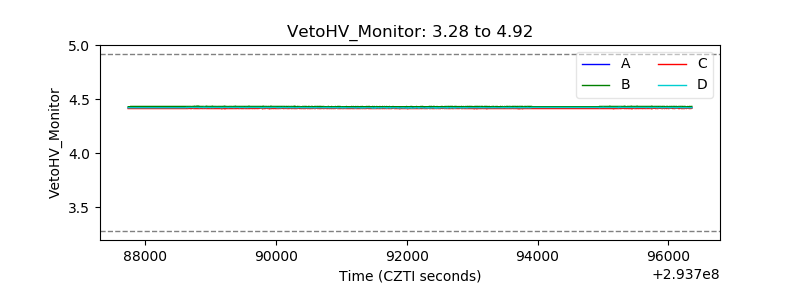 |
| Veto LLD | 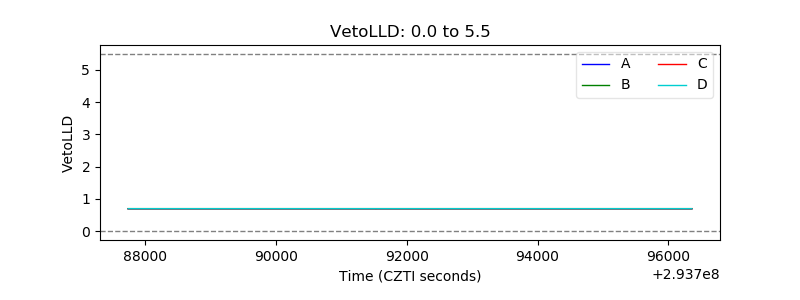 |
| Alpha Counter |  |
| _CPM_Rate | 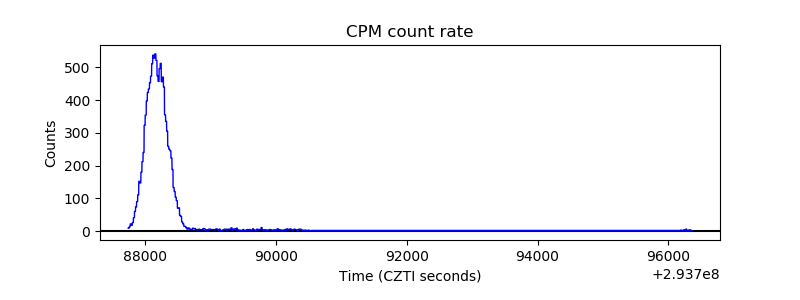 |
| CZT Counter | 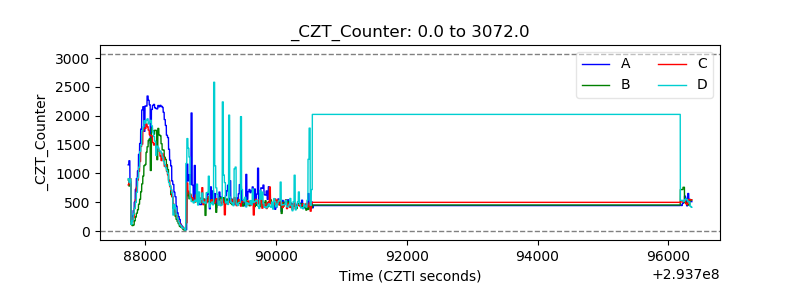 |
| +2.5 Volts monitor | 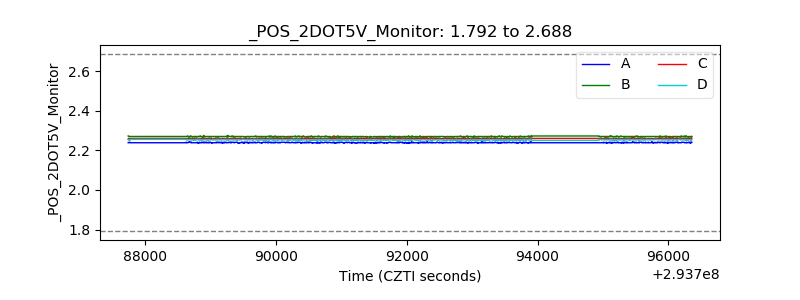 |
| +5 Volts monitor | 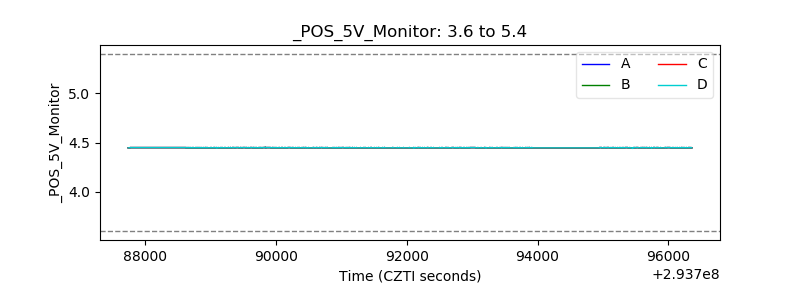 |
| _ROLL_ROT |  |
| _Roll_DEC | 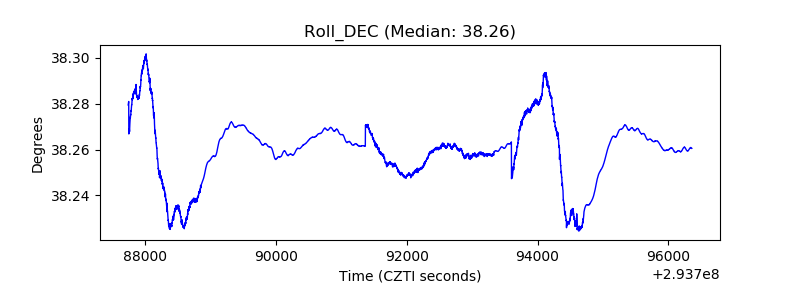 |
| _Roll_RA | 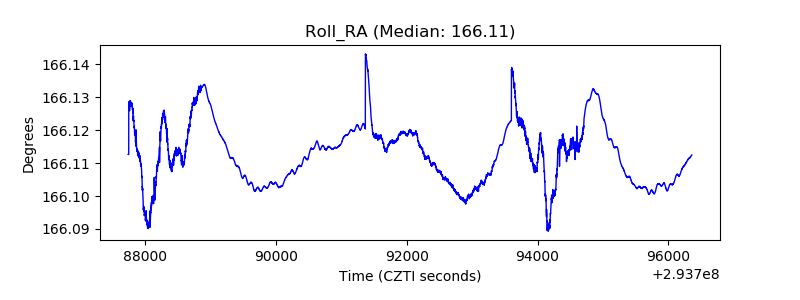 |
| Veto Counter | 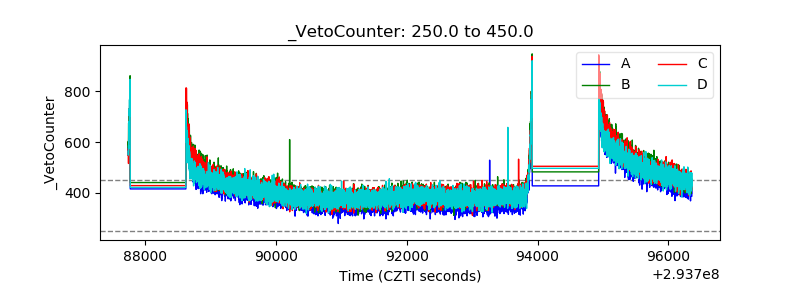 |