| Param | Original file | Final file |
|---|---|---|
| Filename | modeM0/AS1A05_204T01_9000002856_19306cztM0_level2.evt | modeM0/AS1A05_204T01_9000002856_19306cztM0_level2_quad_clean.evt |
| Size (bytes) | 486,743,040 | 92,643,840 |
| Size | 464.2 MB | 88.4 MB |
| Events in quadrant A | 3,371,093 | 605,259 |
| Events in quadrant B | 3,451,421 | 606,370 |
| Events in quadrant C | 3,350,273 | 572,480 |
| Events in quadrant D | 4,121,788 | 562,981 |
| Mode M0 | |||
|---|---|---|---|
| Quadrant | BADHDUFLAG | Total packets | Discarded packets |
| A | 0 | 14314 | 3 |
| B | 0 | 14357 | 2 |
| C | 0 | 14062 | 2 |
| D | 0 | 16436 | 2 |
| Mode M9 | |||
|---|---|---|---|
| Quadrant | BADHDUFLAG | Total packets | Discarded packets |
| A | 0 | 18 | 0 |
| B | 0 | 19 | 0 |
| C | 0 | 19 | 0 |
| D | 0 | 19 | 0 |
| Mode SS | |||
|---|---|---|---|
| Quadrant | BADHDUFLAG | Total packets | Discarded packets |
| A | 0 | 132 | 0 |
| B | 0 | 132 | 0 |
| C | 0 | 132 | 0 |
| D | 0 | 132 | 0 |
| Quadrant | Total seconds | Saturated seconds | Saturation percentage |
|---|---|---|---|
| A | 6581 | 69 | 1.048473% |
| B | 6581 | 65 | 0.987692% |
| C | 6581 | 72 | 1.094059% |
| D | 6581 | 226 | 3.434129% |
Noise dominated data is calculated using 1-second bins in cleaned event files. If a bin has >2000 counts, and if more than 50% of those come from <1% of pixels, then it is considered to be noise-dominated and hence unusable.
| Quadrant | # 1 sec bins | Bins with >0 counts | Bins with >2000 counts | High rate bins dominated by noise | Noise dominated (total time) | Noise dominated (detector-on time) | Marked lightcurve |
|---|---|---|---|---|---|---|---|
| A | 7746 | 6581 | 4 | 4 | 0.05% | 0.06% | 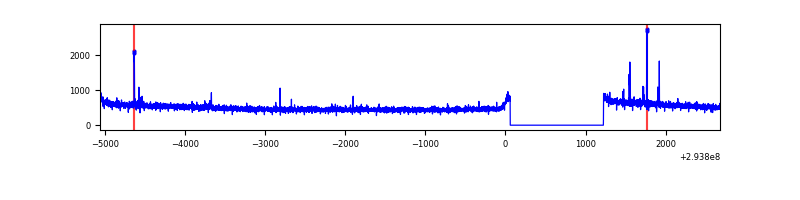 |
| B | 7746 | 6581 | 4 | 4 | 0.05% | 0.06% | 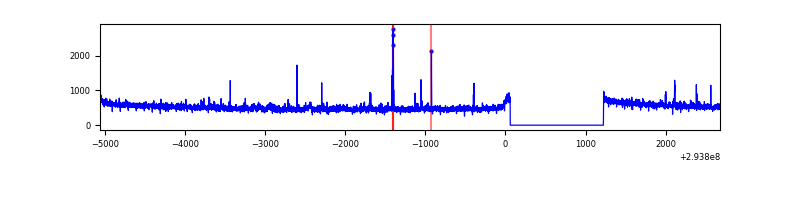 |
| C | 7746 | 6581 | 0 | 0 | 0.00% | 0.00% | 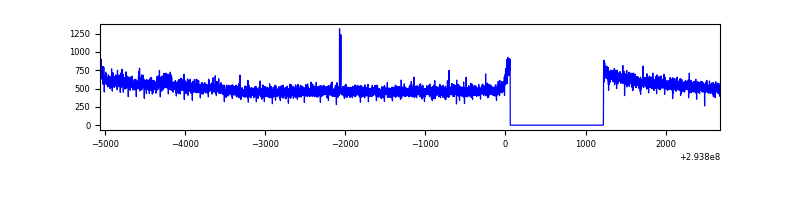 |
| D | 7746 | 6581 | 137 | 137 | 1.77% | 2.08% | 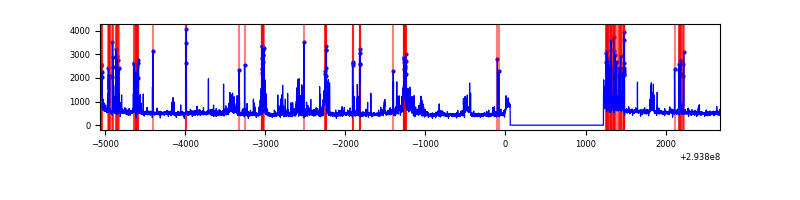 |
Top three noisy pixels from each quadrant. If the there are fewer than three noisy pixels in the level2.evt file, extra rows are filled as -1
| Pixel properties | Quadrant properties | ||||||
|---|---|---|---|---|---|---|---|
| Quadrant | DetID | PixID | Counts | Sigma | Mean | Median | Sigma |
| A | 4 | 2 | 35527 | 201.49 | 866 | 848 | 172.1 |
| A | 0 | 226 | 7603 | 39.25 | 866 | 848 | 172.1 |
| A | 3 | 137 | 6828 | 34.74 | 866 | 848 | 172.1 |
| B | 3 | 64 | 35825 | 217.01 | 850 | 830 | 161.3 |
| B | 15 | 19 | 33862 | 204.84 | 850 | 830 | 161.3 |
| B | 12 | 111 | 19451 | 115.47 | 850 | 830 | 161.3 |
| C | 14 | 238 | 127594 | 665.74 | 817 | 822 | 190.4 |
| C | 3 | 247 | 21745 | 109.88 | 817 | 822 | 190.4 |
| C | 9 | 54 | 8658 | 41.15 | 817 | 822 | 190.4 |
| D | 7 | 238 | 561234 | 2798.46 | 826 | 801 | 200.3 |
| D | 11 | 176 | 177226 | 880.96 | 826 | 801 | 200.3 |
| D | 1 | 52 | 86407 | 427.46 | 826 | 801 | 200.3 |
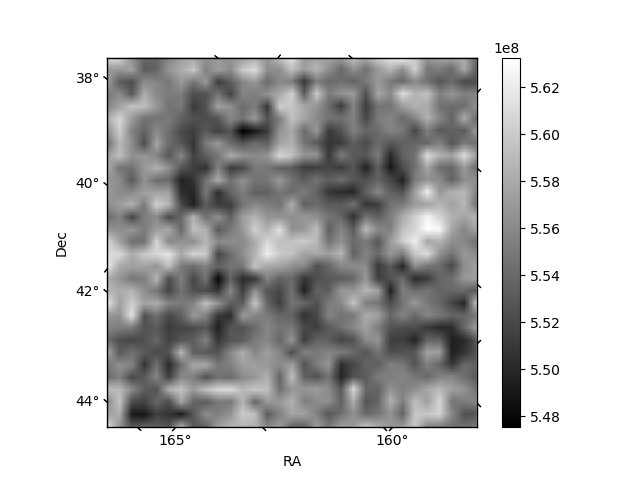
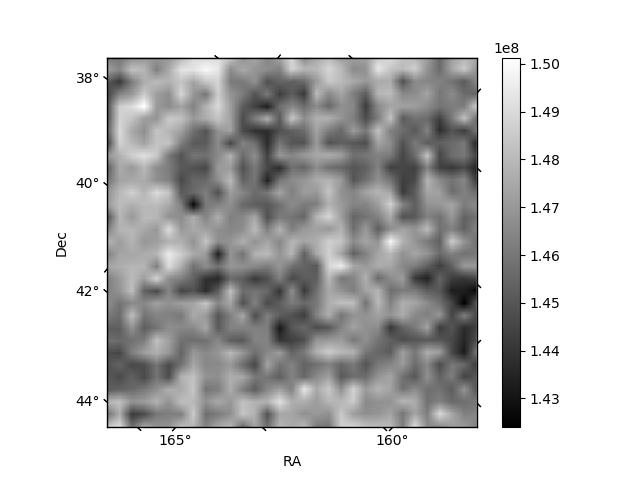
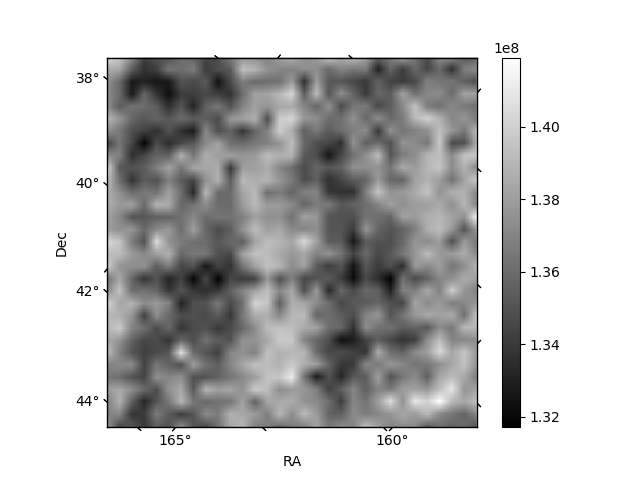
Histogram calculated using DETX and DETY for each event in the final _common_clean file
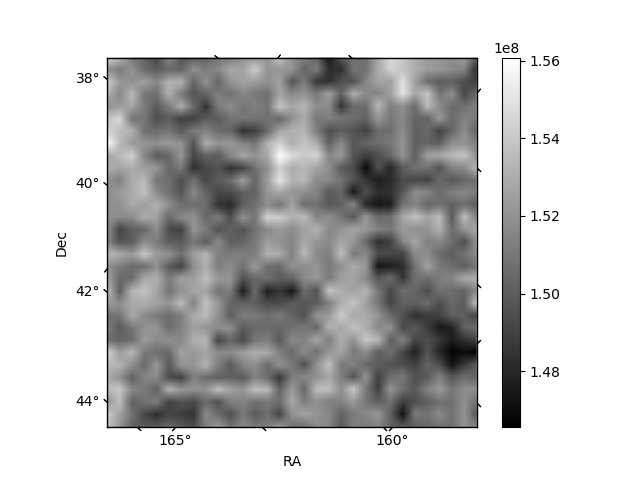
| Quadrant A | 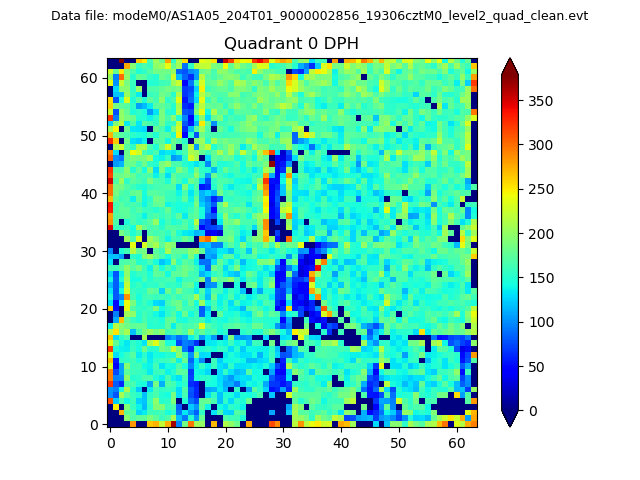 |
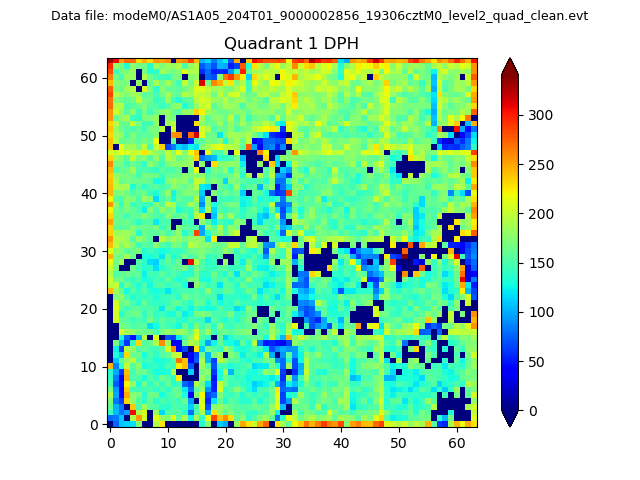 |
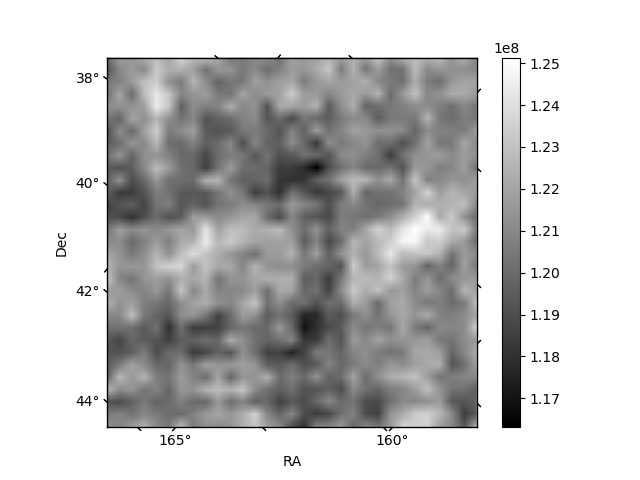
Quadrant B |
|---|---|---|---|
| Quadrant D | 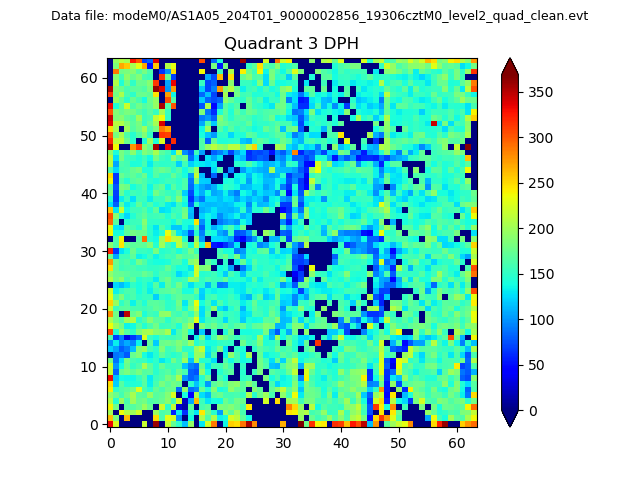 |
 |
Quadrant C |
| Plot type | Count rate plots | Images |
|---|---|---|
| Comparison with Poisson distribution Blue bars denote a histogram of data divided into 1 sec bins. Red curve is a Poisson curve with rate = median count rate of data. |
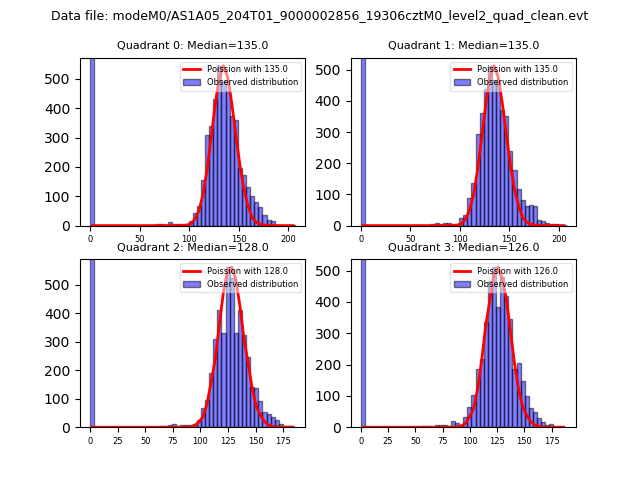 |
 |
| Quadrant-wise count rates Data is divided into 100 sec bins |
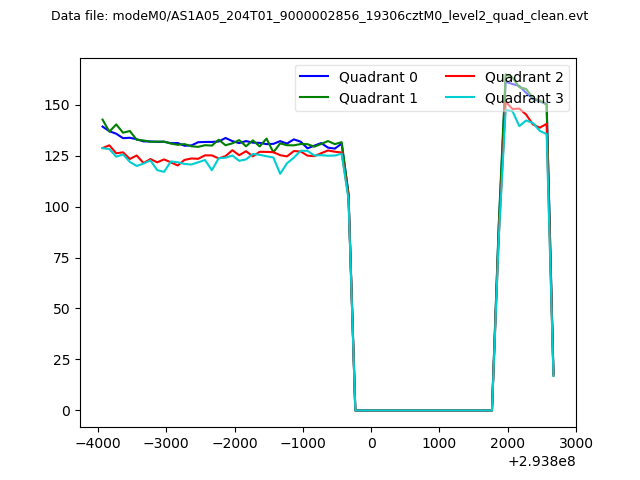 |
|
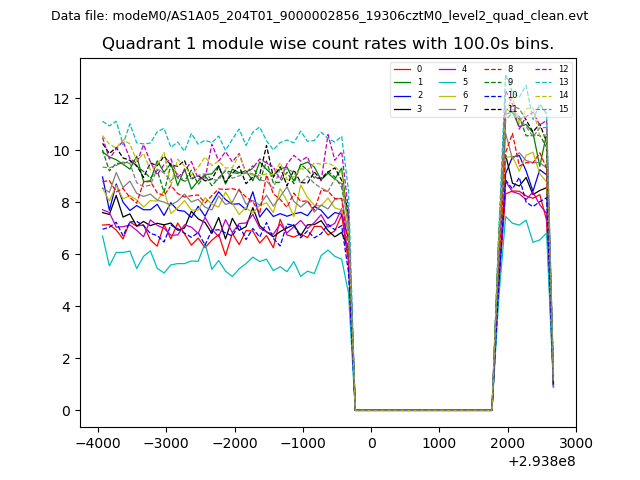
| Module-wise count rates for Quadrant A Data is divided into 100 sec bins |
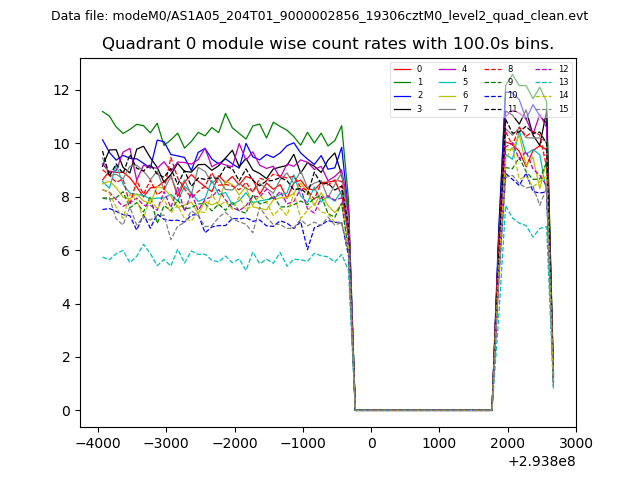 |
 |
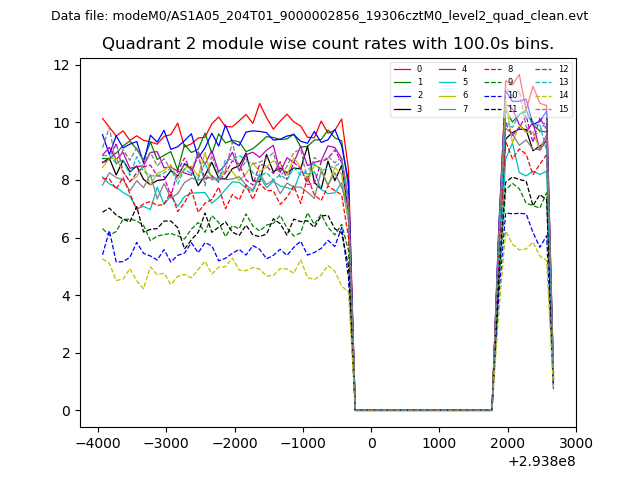
| Module-wise count rates for Quadrant B Data is divided into 100 sec bins |
 |
 |
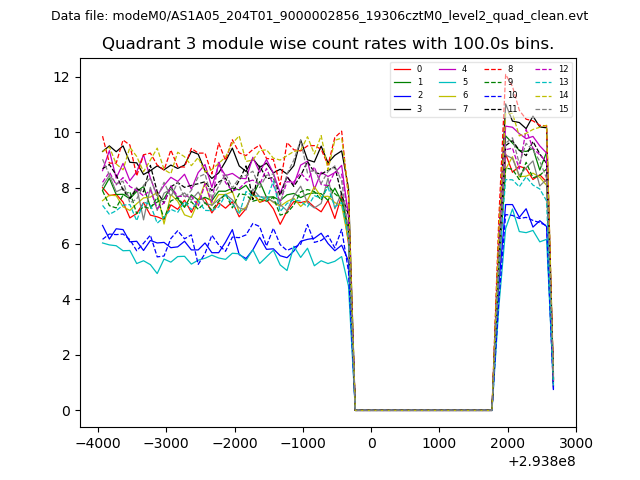
| Module-wise count rates for Quadrant C Data is divided into 100 sec bins |
 |
 |
| Module-wise count rates for Quadrant D Data is divided into 100 sec bins |
 |
 |
| Parameter | Plot |
|---|---|
| CZT HV Monitor | 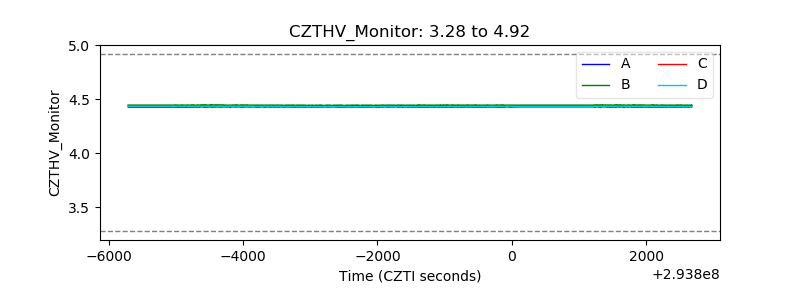 |
| D_VDD | 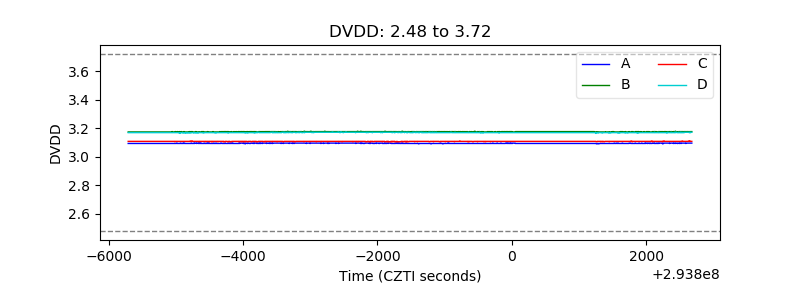 |
| Temperature 1 | 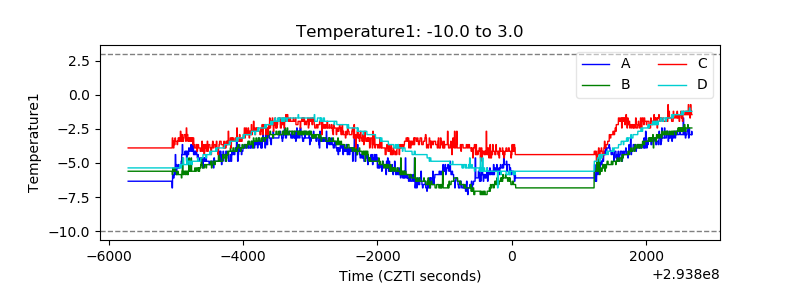 |
| Veto HV Monitor | 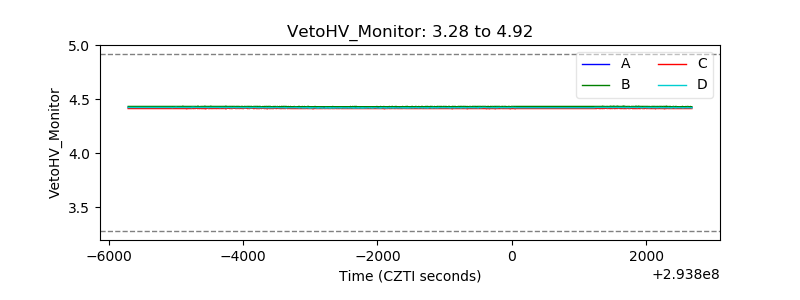 |
| Veto LLD | 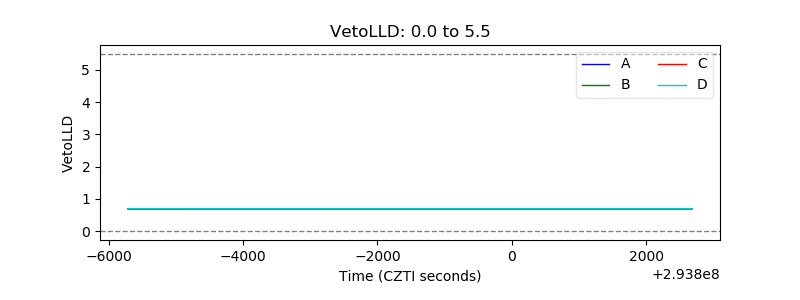 |
| Alpha Counter | 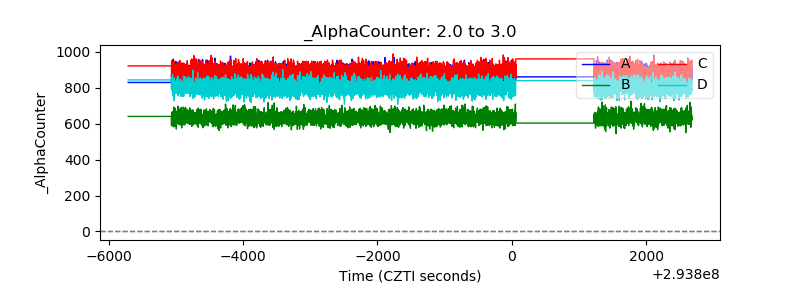 |
| _CPM_Rate | 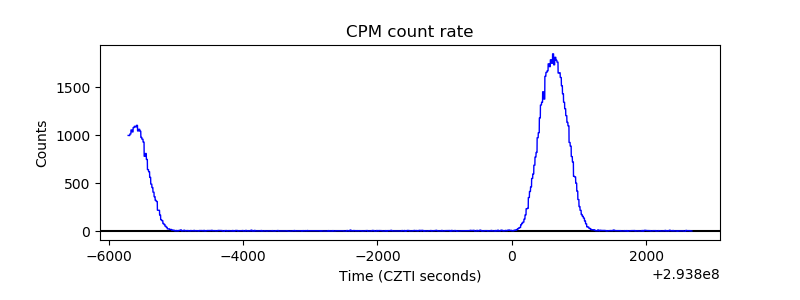 |
| CZT Counter | 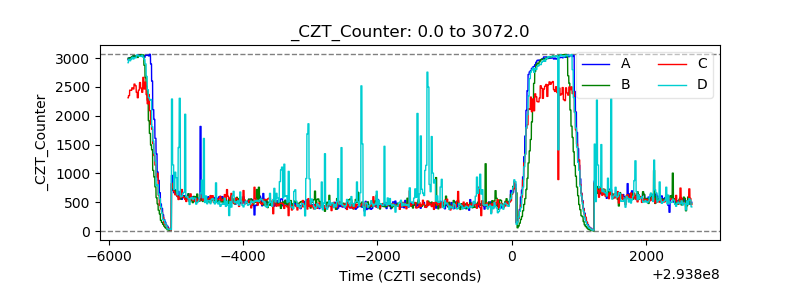 |
| +2.5 Volts monitor | 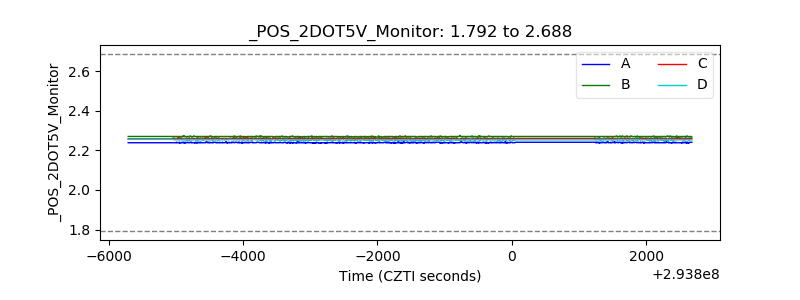 |
| +5 Volts monitor | 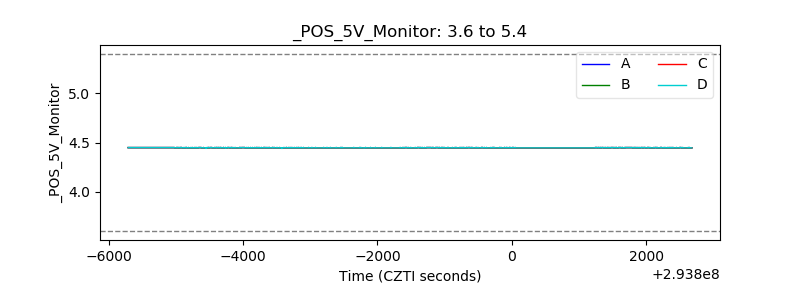 |
| _ROLL_ROT | 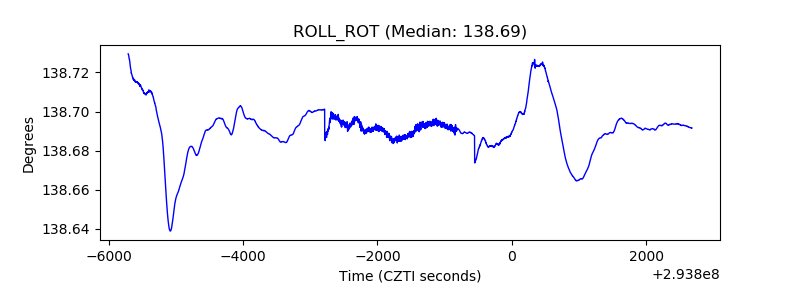 |
| _Roll_DEC | 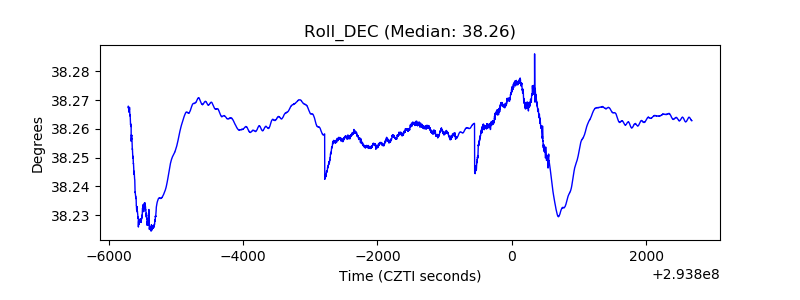 |
| _Roll_RA | 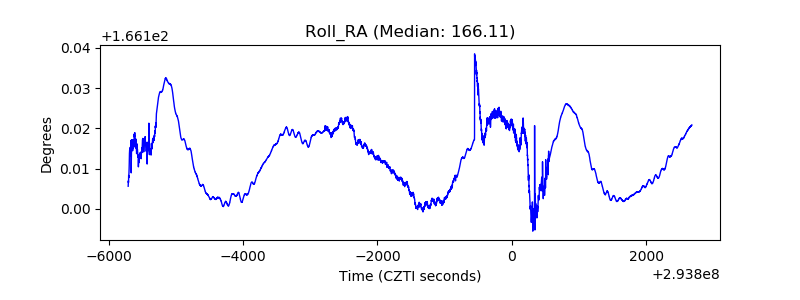 |
| Veto Counter | 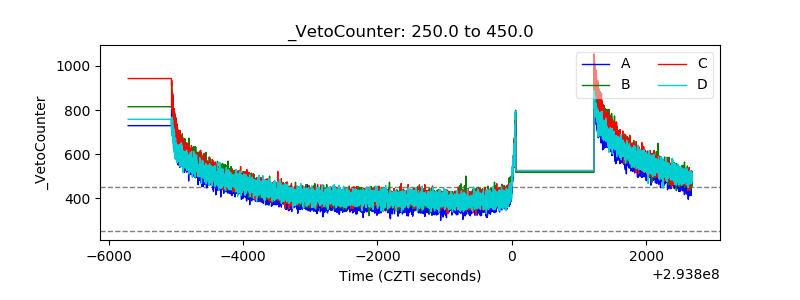 |