| Param | Original file | Final file |
|---|---|---|
| Filename | modeM0/AS1A05_204T01_9000002856_19307cztM0_level2.evt | modeM0/AS1A05_204T01_9000002856_19307cztM0_level2_quad_clean.evt |
| Size (bytes) | 515,021,760 | 106,176,960 |
| Size | 491.2 MB | 101.3 MB |
| Events in quadrant A | 3,328,656 | 721,737 |
| Events in quadrant B | 3,413,456 | 720,260 |
| Events in quadrant C | 3,393,988 | 679,261 |
| Events in quadrant D | 5,034,293 | 654,968 |
| Mode M0 | |||
|---|---|---|---|
| Quadrant | BADHDUFLAG | Total packets | Discarded packets |
| A | 0 | 14079 | 1 |
| B | 0 | 14185 | 1 |
| C | 0 | 14058 | 1 |
| D | 0 | 19155 | 1 |
| Mode M9 | |||
|---|---|---|---|
| Quadrant | BADHDUFLAG | Total packets | Discarded packets |
| A | 0 | 12 | 0 |
| B | 0 | 12 | 0 |
| C | 0 | 12 | 0 |
| D | 0 | 12 | 0 |
| Mode SS | |||
|---|---|---|---|
| Quadrant | BADHDUFLAG | Total packets | Discarded packets |
| A | 0 | 130 | 0 |
| B | 0 | 130 | 0 |
| C | 0 | 130 | 0 |
| D | 0 | 130 | 0 |
| Quadrant | Total seconds | Saturated seconds | Saturation percentage |
|---|---|---|---|
| A | 6289 | 96 | 1.526475% |
| B | 6290 | 102 | 1.621622% |
| C | 6290 | 120 | 1.907790% |
| D | 6290 | 474 | 7.535771% |
Noise dominated data is calculated using 1-second bins in cleaned event files. If a bin has >2000 counts, and if more than 50% of those come from <1% of pixels, then it is considered to be noise-dominated and hence unusable.
| Quadrant | # 1 sec bins | Bins with >0 counts | Bins with >2000 counts | High rate bins dominated by noise | Noise dominated (total time) | Noise dominated (detector-on time) | Marked lightcurve |
|---|---|---|---|---|---|---|---|
| A | 7509 | 6289 | 2 | 2 | 0.03% | 0.03% | 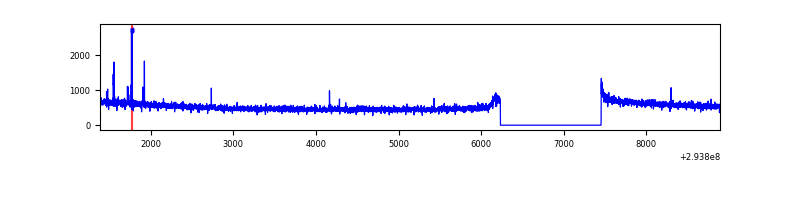 |
| B | 7510 | 6290 | 1 | 1 | 0.01% | 0.02% | 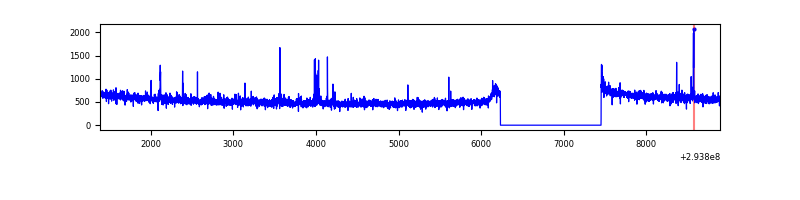 |
| C | 7510 | 6290 | 4 | 4 | 0.05% | 0.06% | 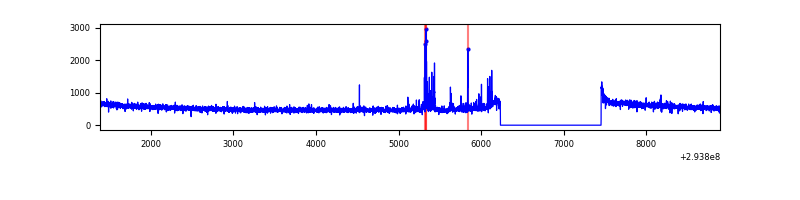 |
| D | 7510 | 6290 | 313 | 313 | 4.17% | 4.98% | 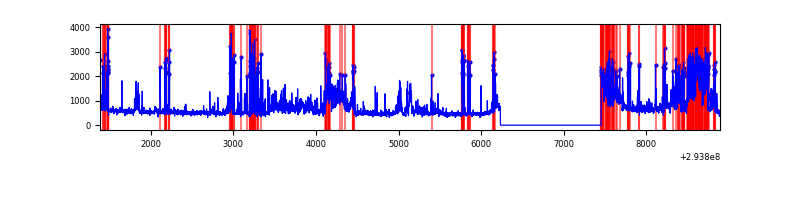 |
Top three noisy pixels from each quadrant. If the there are fewer than three noisy pixels in the level2.evt file, extra rows are filled as -1
| Pixel properties | Quadrant properties | ||||||
|---|---|---|---|---|---|---|---|
| Quadrant | DetID | PixID | Counts | Sigma | Mean | Median | Sigma |
| A | 4 | 2 | 21826 | 123.43 | 859 | 842 | 170.0 |
| A | 0 | 226 | 7677 | 40.2 | 859 | 842 | 170.0 |
| A | 13 | 254 | 6432 | 32.88 | 859 | 842 | 170.0 |
| B | 0 | 229 | 43921 | 274.11 | 839 | 819 | 157.2 |
| B | 15 | 19 | 33141 | 205.55 | 839 | 819 | 157.2 |
| B | 12 | 111 | 18291 | 111.11 | 839 | 819 | 157.2 |
| C | 14 | 238 | 127067 | 675.81 | 809 | 816 | 186.8 |
| C | 0 | 79 | 89254 | 473.4 | 809 | 816 | 186.8 |
| C | 3 | 233 | 9095 | 44.32 | 809 | 816 | 186.8 |
| D | 7 | 238 | 1280900 | 6458.02 | 811 | 789 | 198.2 |
| D | 10 | 66 | 313567 | 1577.93 | 811 | 789 | 198.2 |
| D | 11 | 176 | 290090 | 1459.49 | 811 | 789 | 198.2 |
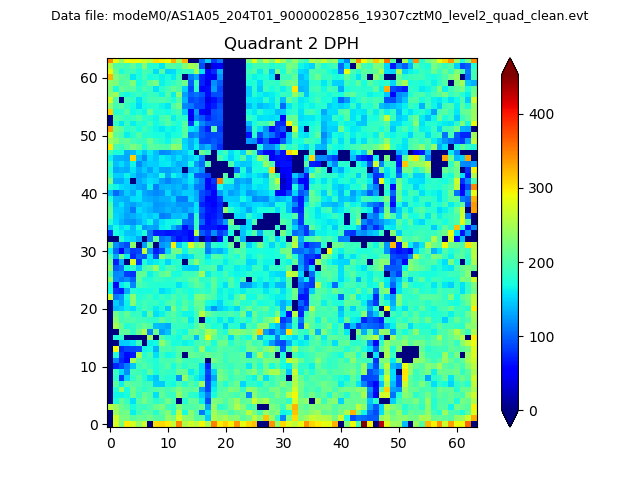
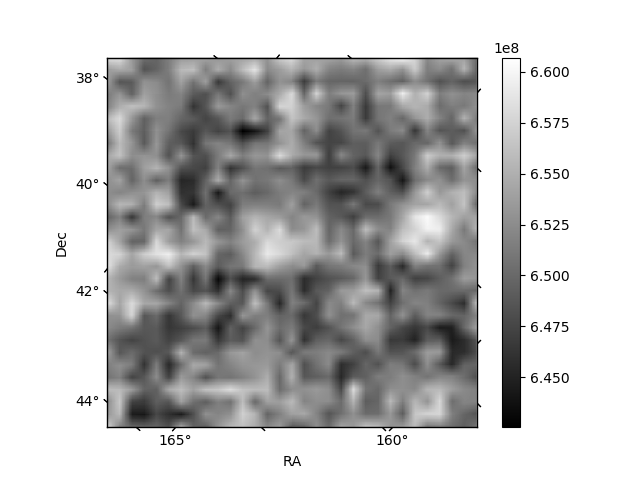
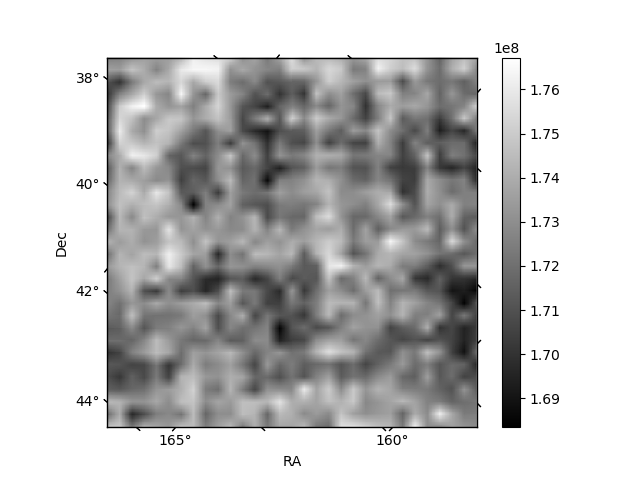
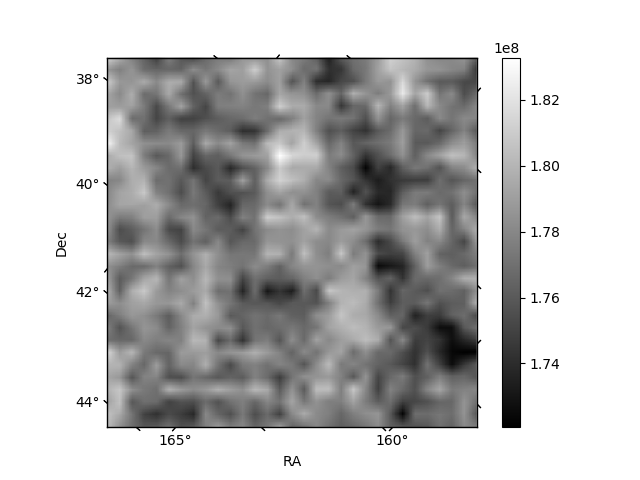
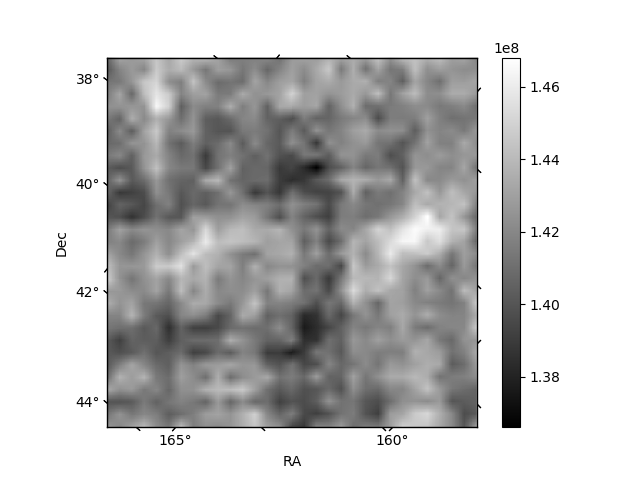
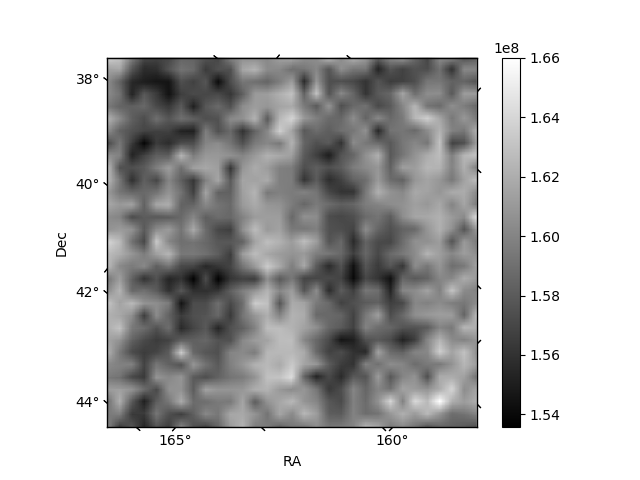
Histogram calculated using DETX and DETY for each event in the final _common_clean file
| Quadrant A | 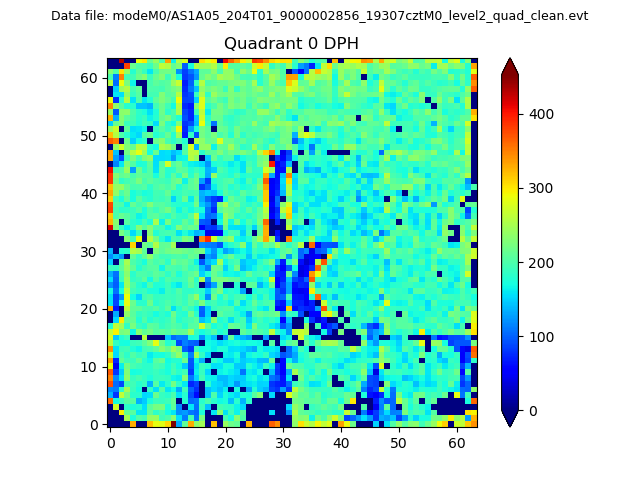 |
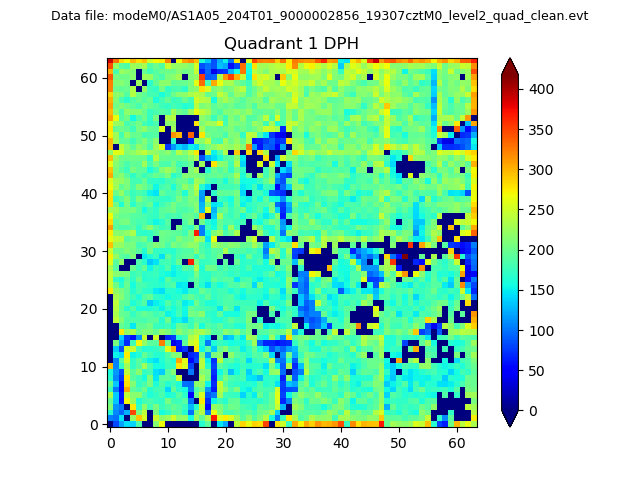 |
Quadrant B |
|---|---|---|---|
| Quadrant D | 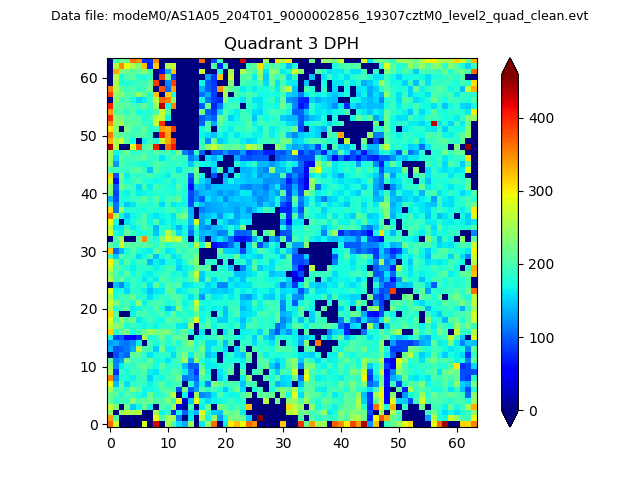 |
 |
Quadrant C |
| Plot type | Count rate plots | Images |
|---|---|---|
| Comparison with Poisson distribution Blue bars denote a histogram of data divided into 1 sec bins. Red curve is a Poisson curve with rate = median count rate of data. |
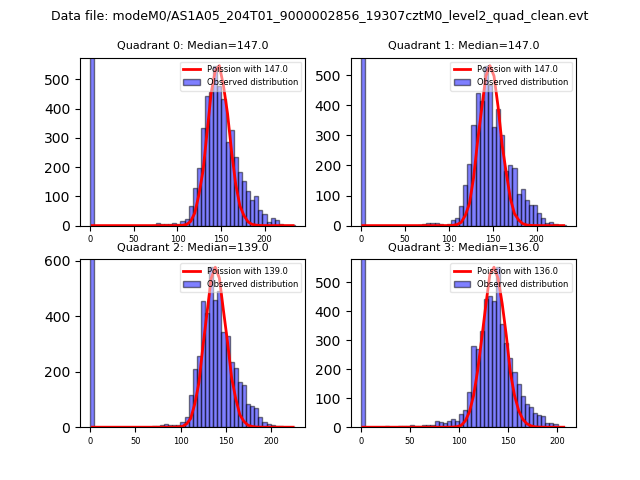 |
 |
| Quadrant-wise count rates Data is divided into 100 sec bins |
 |
|
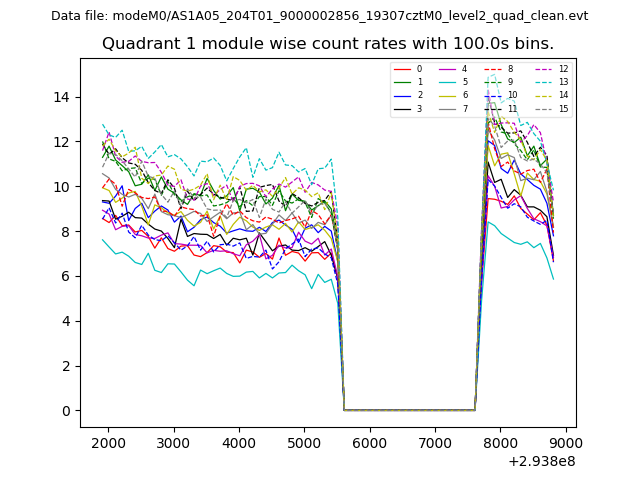
| Module-wise count rates for Quadrant A Data is divided into 100 sec bins |
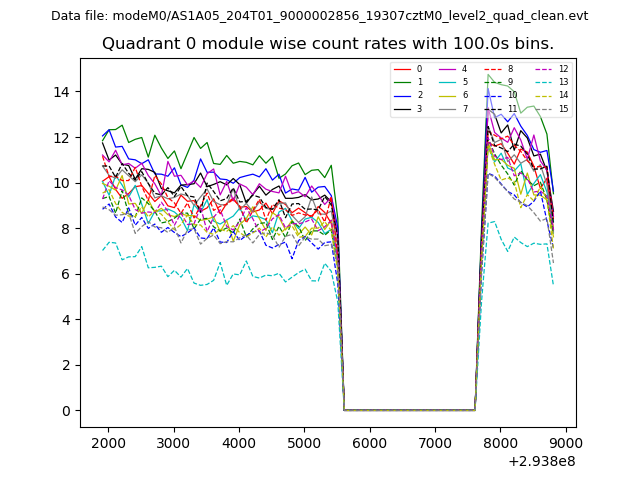 |
 |
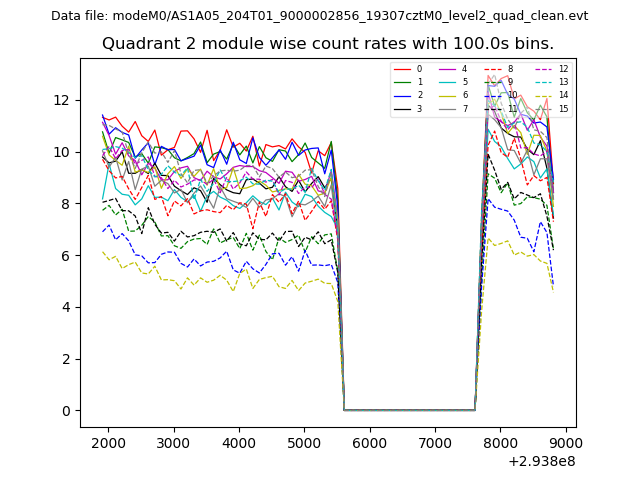
| Module-wise count rates for Quadrant B Data is divided into 100 sec bins |
 |
 |
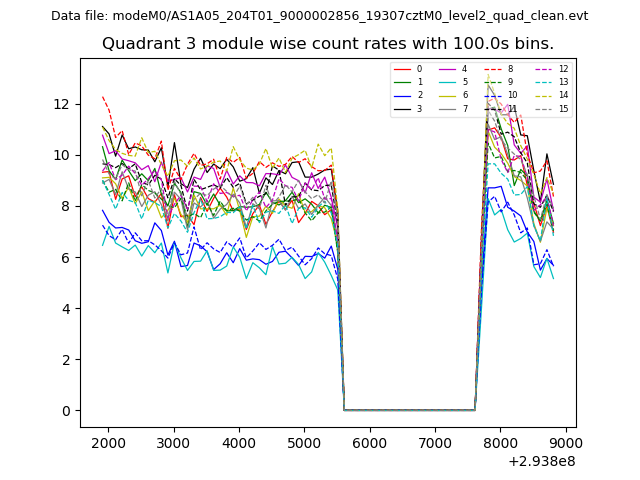
| Module-wise count rates for Quadrant C Data is divided into 100 sec bins |
 |
 |
| Module-wise count rates for Quadrant D Data is divided into 100 sec bins |
 |
 |
| Parameter | Plot |
|---|---|
| CZT HV Monitor | 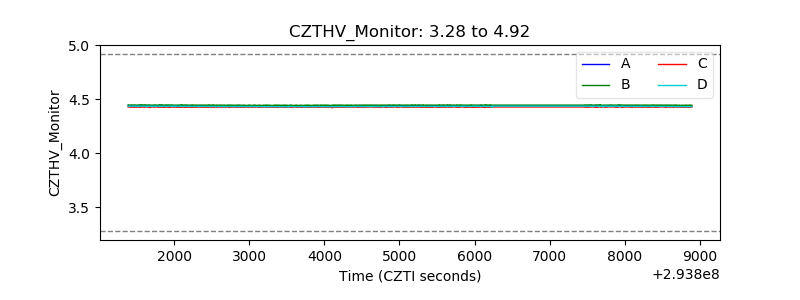 |
| D_VDD | 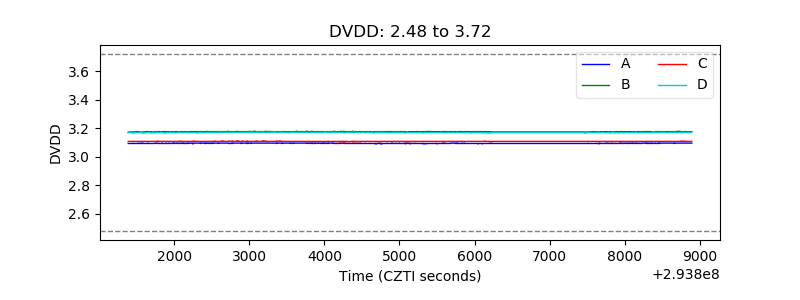 |
| Temperature 1 | 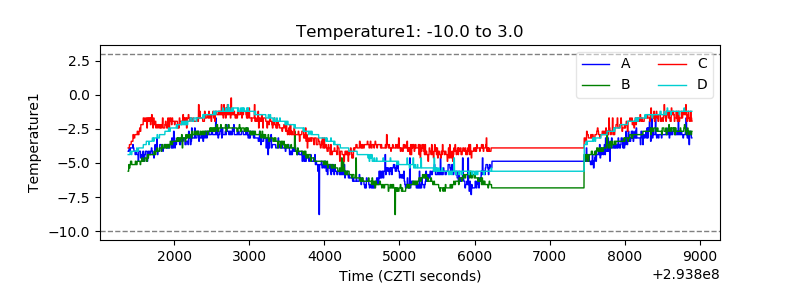 |
| Veto HV Monitor | 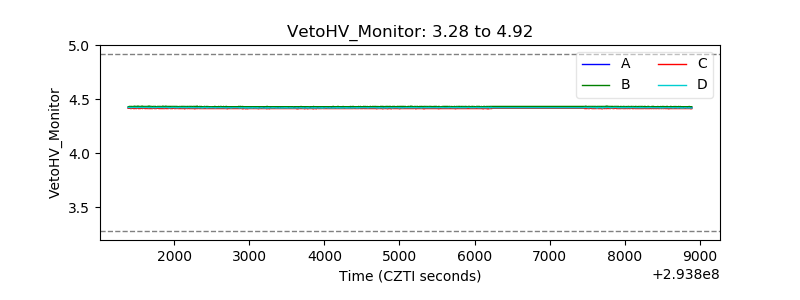 |
| Veto LLD | 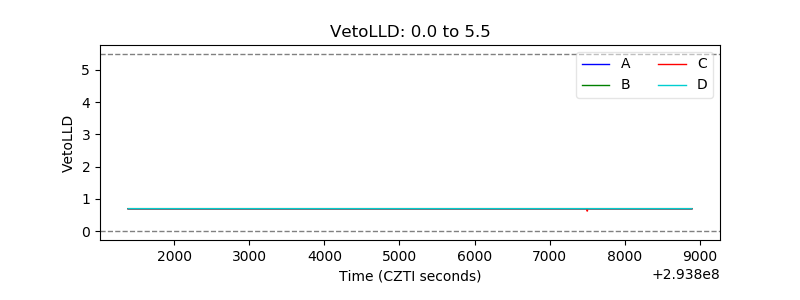 |
| Alpha Counter |  |
| _CPM_Rate |  |
| CZT Counter | 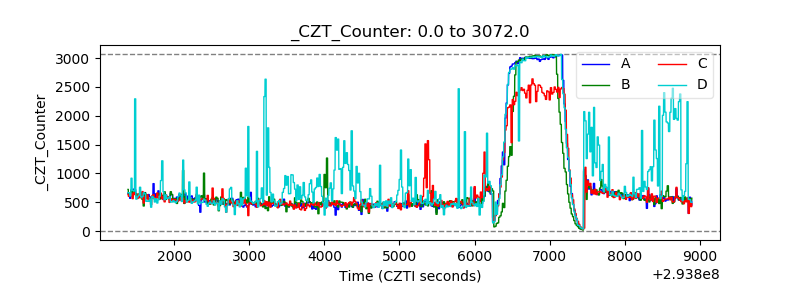 |
| +2.5 Volts monitor |  |
| +5 Volts monitor |  |
| _ROLL_ROT | 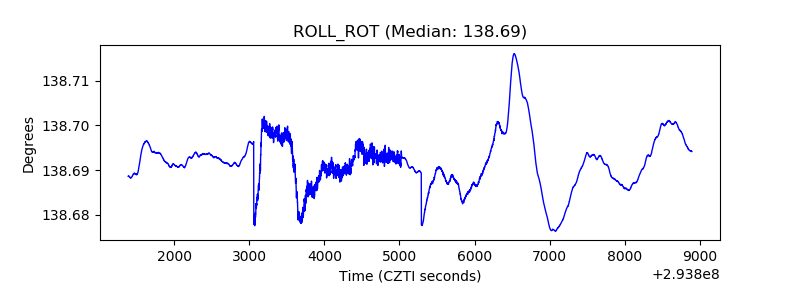 |
| _Roll_DEC | 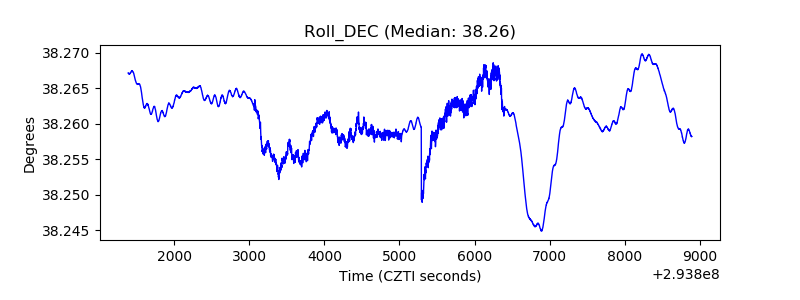 |
| _Roll_RA | 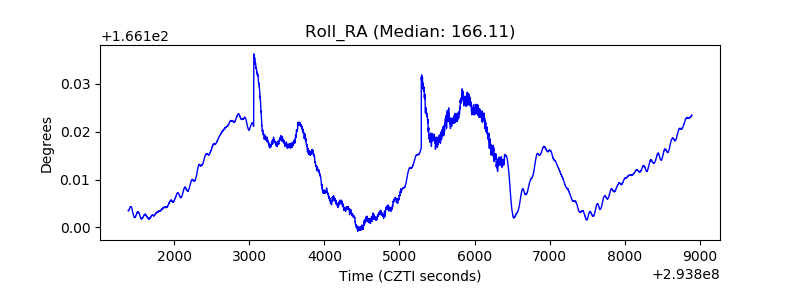 |
| Veto Counter | 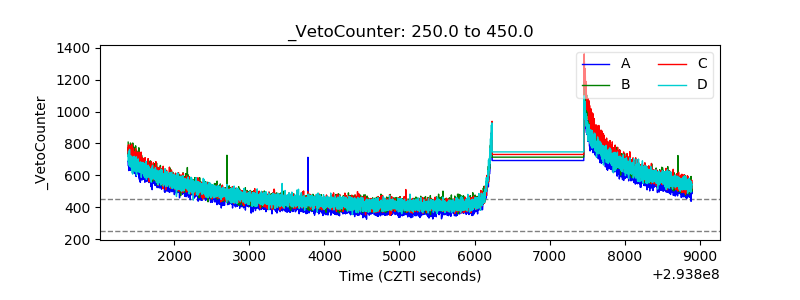 |