| Param | Original file | Final file |
|---|---|---|
| Filename | modeM0/AS1A05_204T01_9000002856_19308cztM0_level2.evt | modeM0/AS1A05_204T01_9000002856_19308cztM0_level2_quad_clean.evt |
| Size (bytes) | 580,682,880 | 113,385,600 |
| Size | 553.8 MB | 108.1 MB |
| Events in quadrant A | 3,160,191 | 794,548 |
| Events in quadrant B | 3,237,286 | 790,963 |
| Events in quadrant C | 3,146,982 | 753,507 |
| Events in quadrant D | 7,639,910 | 680,156 |
| Mode M0 | |||
|---|---|---|---|
| Quadrant | BADHDUFLAG | Total packets | Discarded packets |
| A | 0 | 13146 | 1 |
| B | 0 | 13411 | 1 |
| C | 0 | 13013 | 1 |
| D | 0 | 26859 | 1 |
| Mode M9 | |||
|---|---|---|---|
| Quadrant | BADHDUFLAG | Total packets | Discarded packets |
| A | 0 | 13 | 0 |
| B | 0 | 13 | 0 |
| C | 0 | 13 | 0 |
| D | 0 | 13 | 0 |
| Mode SS | |||
|---|---|---|---|
| Quadrant | BADHDUFLAG | Total packets | Discarded packets |
| A | 0 | 120 | 0 |
| B | 0 | 120 | 0 |
| C | 0 | 120 | 0 |
| D | 0 | 120 | 0 |
| Quadrant | Total seconds | Saturated seconds | Saturation percentage |
|---|---|---|---|
| A | 5936 | 80 | 1.347709% |
| B | 5937 | 78 | 1.313795% |
| C | 5937 | 108 | 1.819101% |
| D | 5937 | 1247 | 21.003874% |
Noise dominated data is calculated using 1-second bins in cleaned event files. If a bin has >2000 counts, and if more than 50% of those come from <1% of pixels, then it is considered to be noise-dominated and hence unusable.
| Quadrant | # 1 sec bins | Bins with >0 counts | Bins with >2000 counts | High rate bins dominated by noise | Noise dominated (total time) | Noise dominated (detector-on time) | Marked lightcurve |
|---|---|---|---|---|---|---|---|
| A | 7261 | 5936 | 2 | 2 | 0.03% | 0.03% | 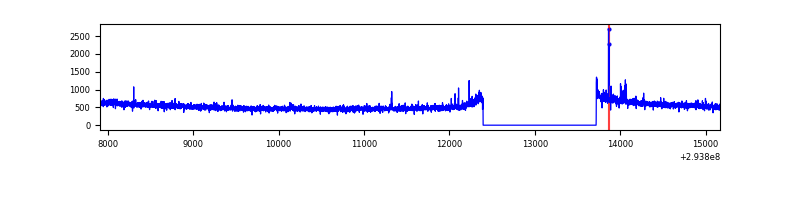 |
| B | 7262 | 5937 | 2 | 2 | 0.03% | 0.03% | 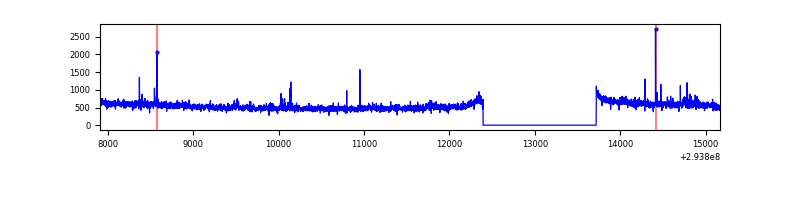 |
| C | 7262 | 5937 | 0 | 0 | 0.00% | 0.00% |  |
| D | 7262 | 5937 | 1110 | 1110 | 15.29% | 18.70% | 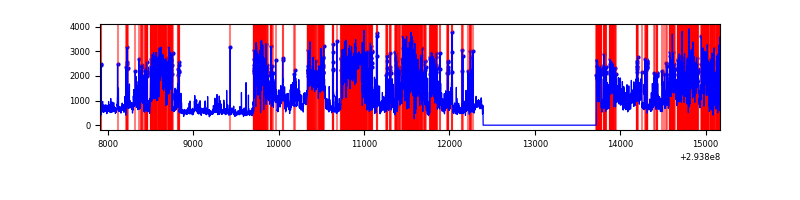 |
Top three noisy pixels from each quadrant. If the there are fewer than three noisy pixels in the level2.evt file, extra rows are filled as -1
| Pixel properties | Quadrant properties | ||||||
|---|---|---|---|---|---|---|---|
| Quadrant | DetID | PixID | Counts | Sigma | Mean | Median | Sigma |
| A | 4 | 2 | 41335 | 252.22 | 810 | 795 | 160.7 |
| A | 0 | 226 | 7174 | 39.69 | 810 | 795 | 160.7 |
| A | 13 | 254 | 7168 | 39.65 | 810 | 795 | 160.7 |
| B | 0 | 229 | 42600 | 286.16 | 792 | 776 | 146.2 |
| B | 0 | 190 | 32838 | 219.37 | 792 | 776 | 146.2 |
| B | 15 | 19 | 19080 | 125.24 | 792 | 776 | 146.2 |
| C | 14 | 238 | 120833 | 672.92 | 771 | 777 | 178.4 |
| C | 3 | 233 | 9513 | 48.97 | 771 | 777 | 178.4 |
| C | 9 | 54 | 8844 | 45.22 | 771 | 777 | 178.4 |
| D | 7 | 238 | 2535891 | 14137.44 | 745 | 727 | 179.3 |
| D | 1 | 52 | 963317 | 5367.92 | 745 | 727 | 179.3 |
| D | 11 | 176 | 717851 | 3999.07 | 745 | 727 | 179.3 |
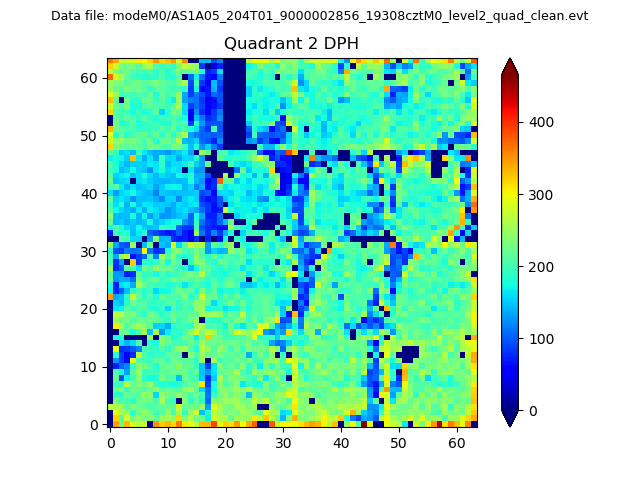
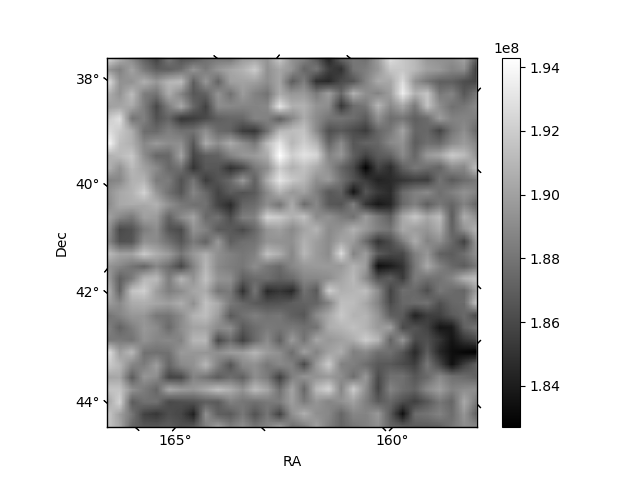
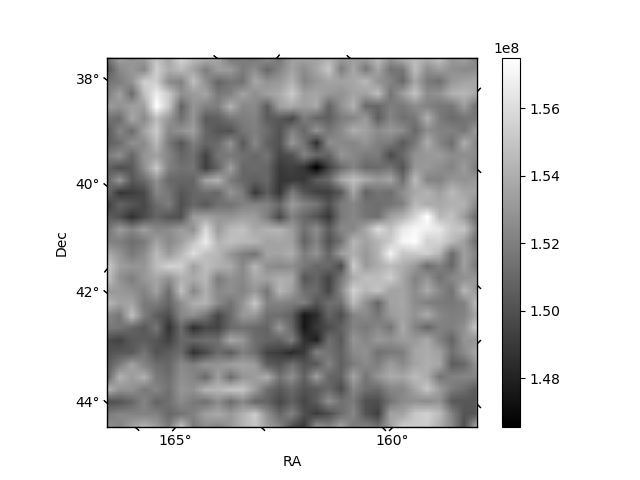
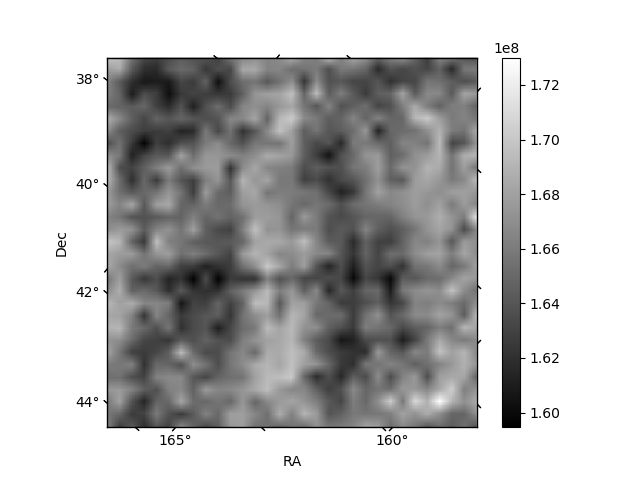
Histogram calculated using DETX and DETY for each event in the final _common_clean file
| Quadrant A | 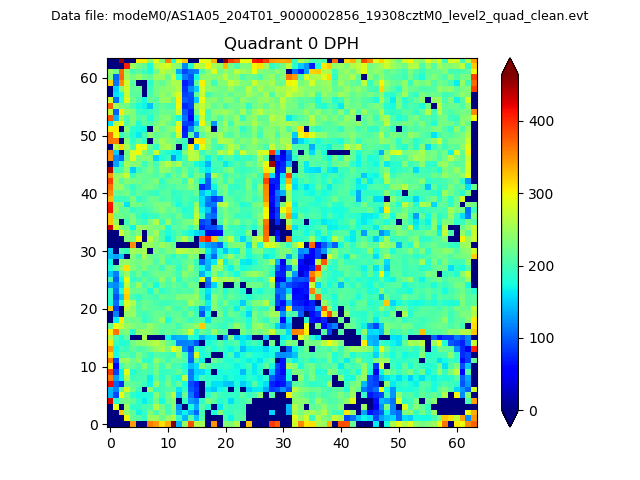 |
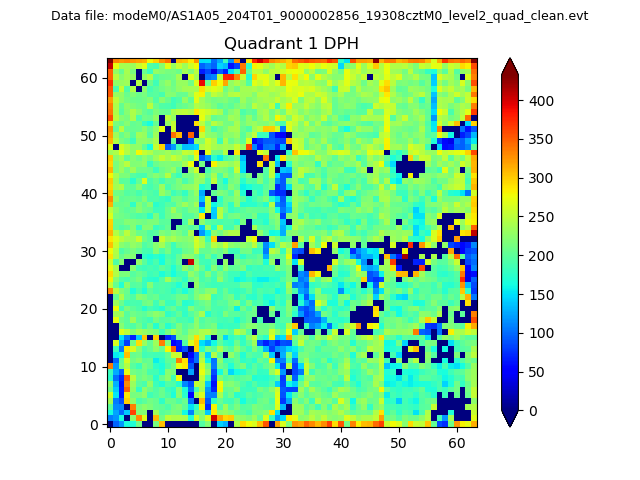 |
Quadrant B |
|---|---|---|---|
| Quadrant D | 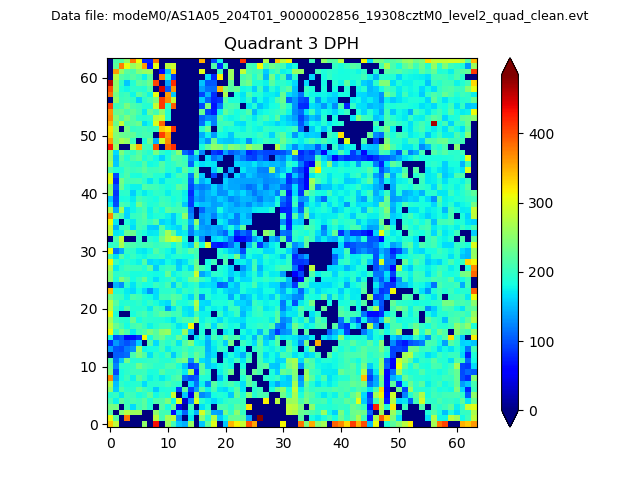 |
 |
Quadrant C |
| Plot type | Count rate plots | Images |
|---|---|---|
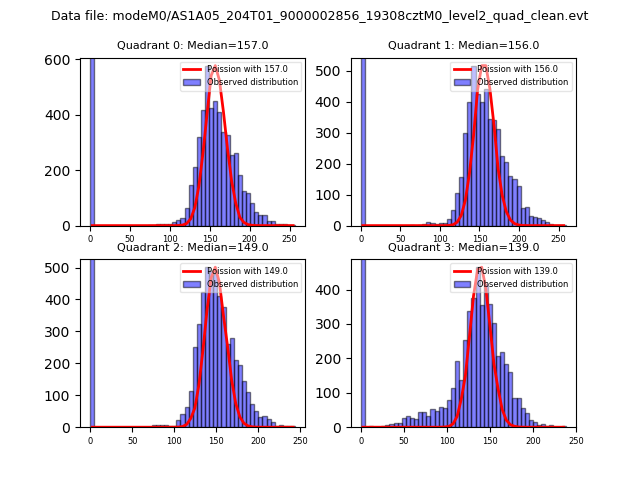
| Comparison with Poisson distribution Blue bars denote a histogram of data divided into 1 sec bins. Red curve is a Poisson curve with rate = median count rate of data. |
 |
 |
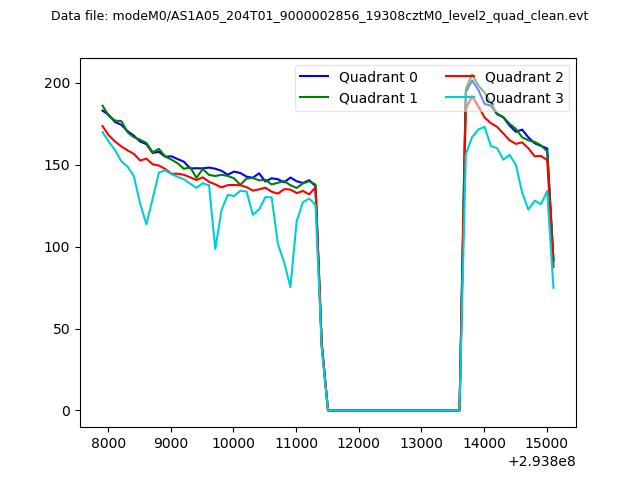
| Quadrant-wise count rates Data is divided into 100 sec bins |
 |
|
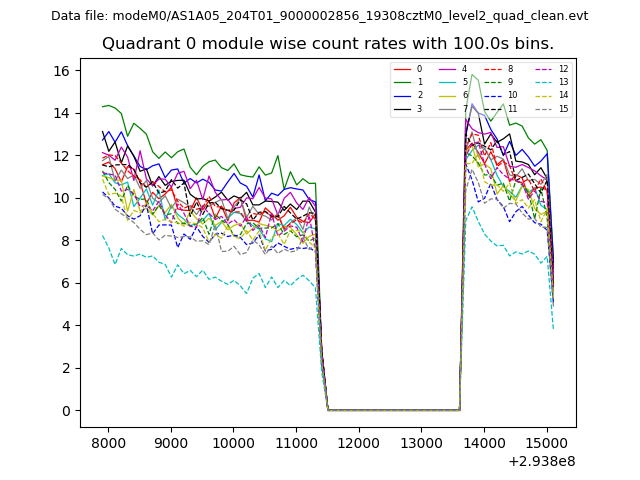
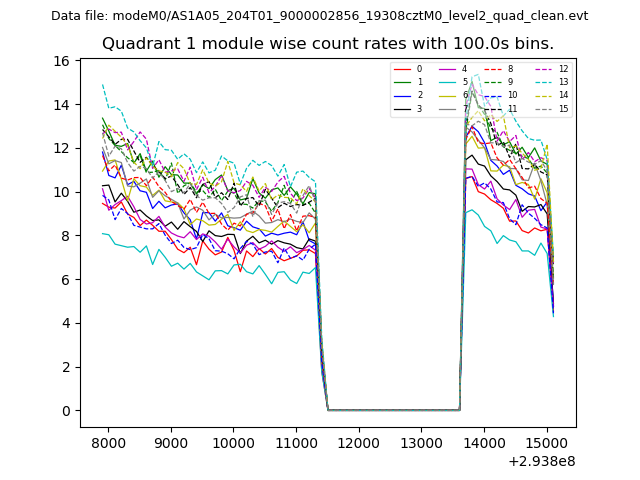
| Module-wise count rates for Quadrant A Data is divided into 100 sec bins |
 |
 |
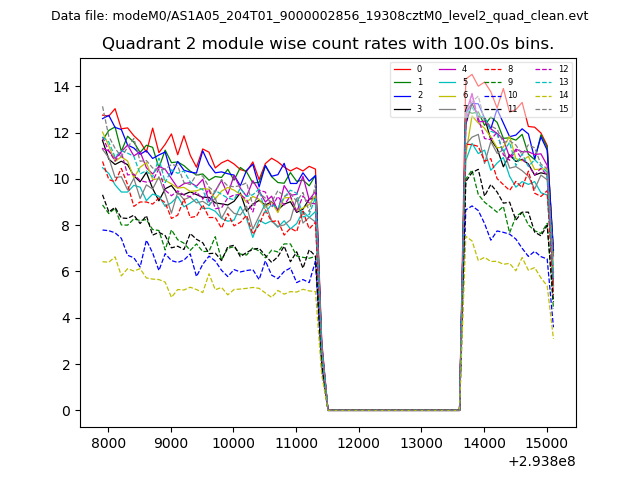
| Module-wise count rates for Quadrant B Data is divided into 100 sec bins |
 |
 |
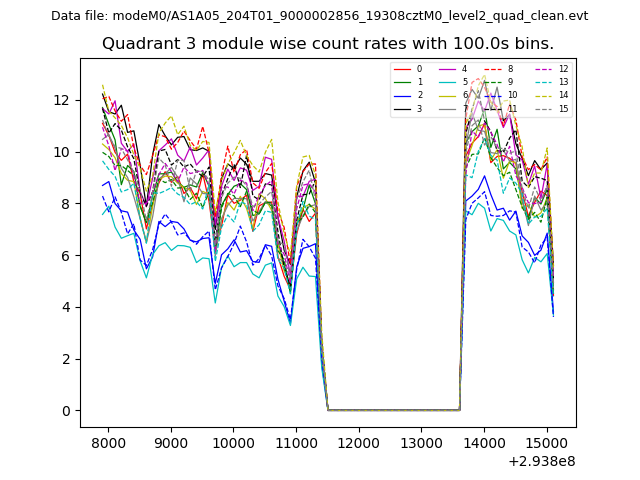
| Module-wise count rates for Quadrant C Data is divided into 100 sec bins |
 |
 |
| Module-wise count rates for Quadrant D Data is divided into 100 sec bins |
 |
 |
| Parameter | Plot |
|---|---|
| CZT HV Monitor | 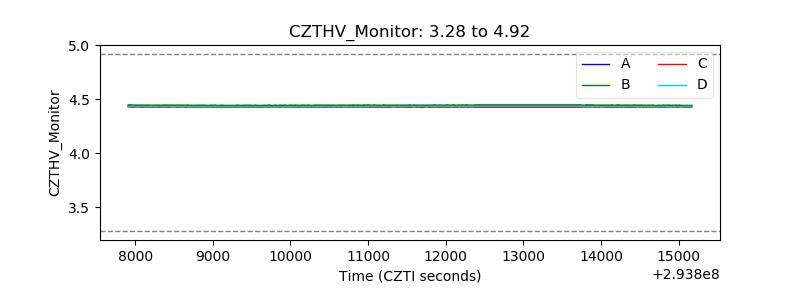 |
| D_VDD | 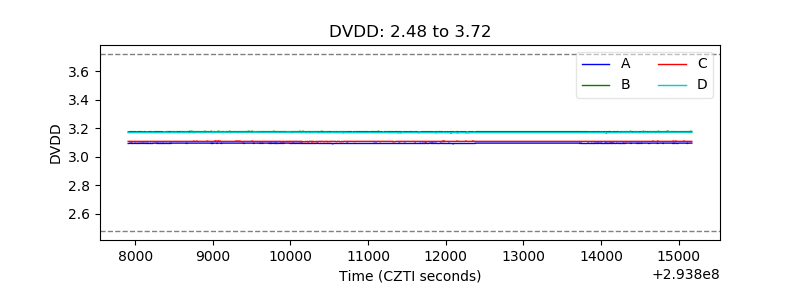 |
| Temperature 1 |  |
| Veto HV Monitor | 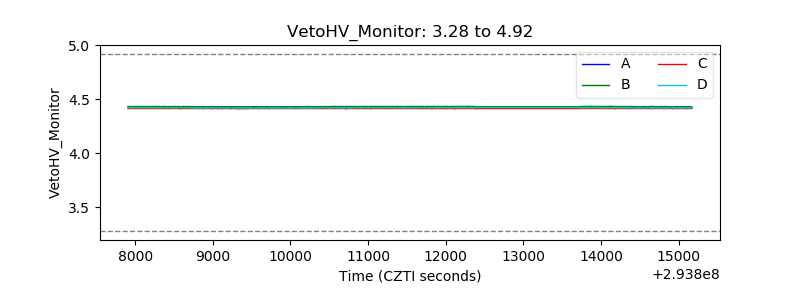 |
| Veto LLD | 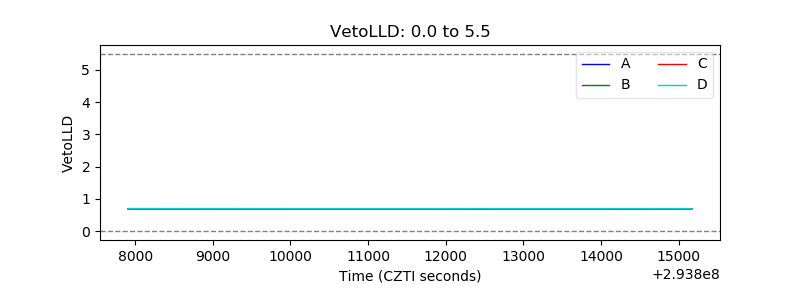 |
| Alpha Counter | 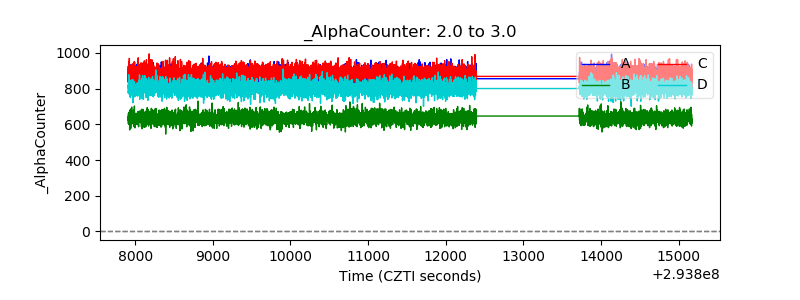 |
| _CPM_Rate | 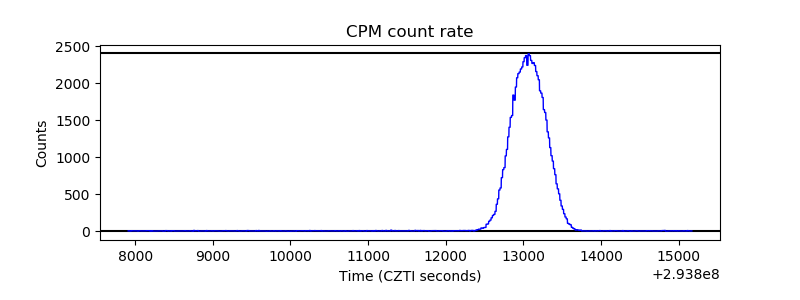 |
| CZT Counter |  |
| +2.5 Volts monitor |  |
| +5 Volts monitor |  |
| _ROLL_ROT | 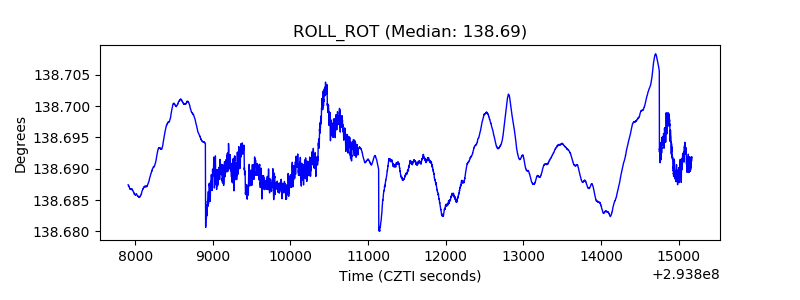 |
| _Roll_DEC | 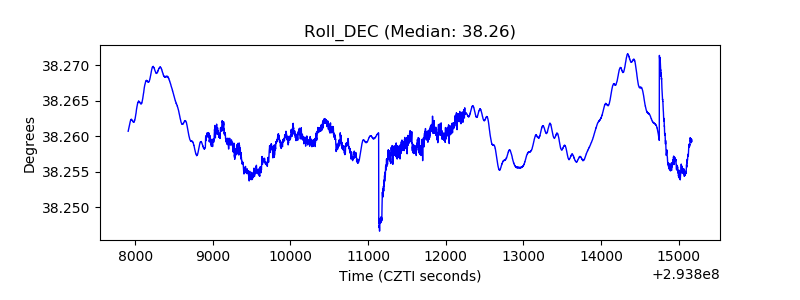 |
| _Roll_RA | 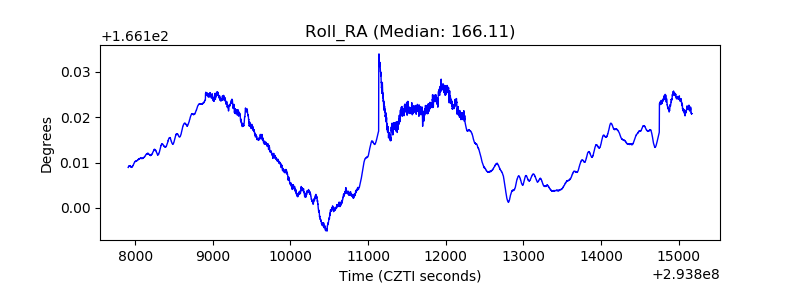 |
| Veto Counter | 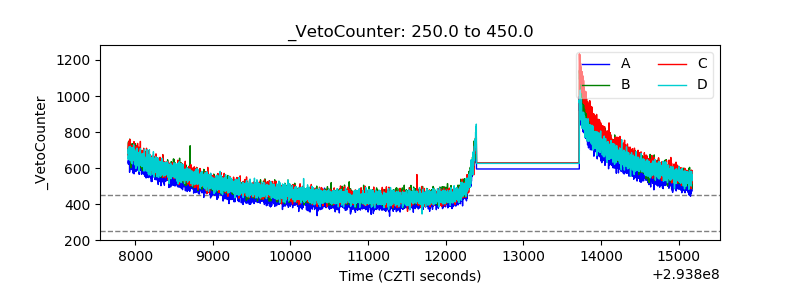 |