| Param | Original file | Final file |
|---|---|---|
| Filename | modeM0/AS1A05_204T01_9000002856_19310cztM0_level2.evt | modeM0/AS1A05_204T01_9000002856_19310cztM0_level2_quad_clean.evt |
| Size (bytes) | 483,681,600 | 98,000,640 |
| Size | 461.3 MB | 93.5 MB |
| Events in quadrant A | 3,094,746 | 658,923 |
| Events in quadrant B | 3,238,902 | 662,227 |
| Events in quadrant C | 3,176,551 | 636,501 |
| Events in quadrant D | 4,718,939 | 579,079 |
| Mode M0 | |||
|---|---|---|---|
| Quadrant | BADHDUFLAG | Total packets | Discarded packets |
| A | 0 | 13081 | 1 |
| B | 0 | 13543 | 1 |
| C | 0 | 13253 | 1 |
| D | 0 | 18277 | 1 |
| Mode M9 | |||
|---|---|---|---|
| Quadrant | BADHDUFLAG | Total packets | Discarded packets |
| A | 0 | 14 | 0 |
| B | 0 | 14 | 0 |
| C | 0 | 14 | 0 |
| D | 0 | 14 | 0 |
| Mode SS | |||
|---|---|---|---|
| Quadrant | BADHDUFLAG | Total packets | Discarded packets |
| A | 0 | 126 | 0 |
| B | 0 | 126 | 0 |
| C | 0 | 126 | 0 |
| D | 0 | 126 | 0 |
| Quadrant | Total seconds | Saturated seconds | Saturation percentage |
|---|---|---|---|
| A | 6178 | 48 | 0.776950% |
| B | 6179 | 72 | 1.165237% |
| C | 6179 | 97 | 1.569833% |
| D | 6179 | 617 | 9.985435% |
Noise dominated data is calculated using 1-second bins in cleaned event files. If a bin has >2000 counts, and if more than 50% of those come from <1% of pixels, then it is considered to be noise-dominated and hence unusable.
| Quadrant | # 1 sec bins | Bins with >0 counts | Bins with >2000 counts | High rate bins dominated by noise | Noise dominated (total time) | Noise dominated (detector-on time) | Marked lightcurve |
|---|---|---|---|---|---|---|---|
| A | 7468 | 6179 | 0 | 0 | 0.00% | 0.00% |  |
| B | 7469 | 6180 | 1 | 1 | 0.01% | 0.02% | 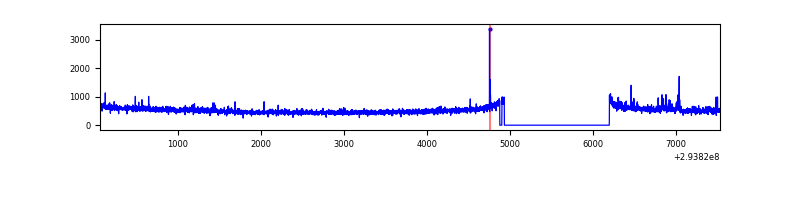 |
| C | 7469 | 6180 | 0 | 0 | 0.00% | 0.00% | 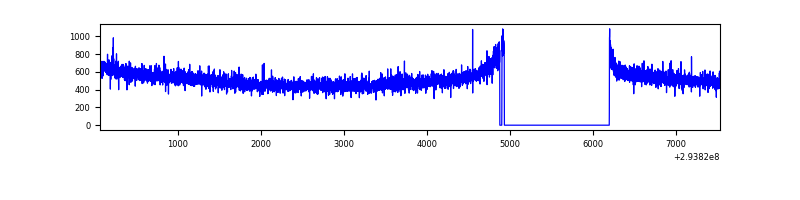 |
| D | 7468 | 6179 | 527 | 527 | 7.06% | 8.53% | 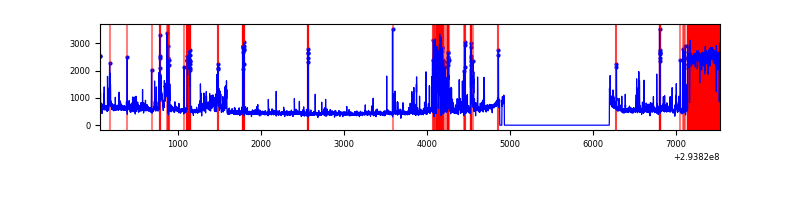 |
Top three noisy pixels from each quadrant. If the there are fewer than three noisy pixels in the level2.evt file, extra rows are filled as -1
| Pixel properties | Quadrant properties | ||||||
|---|---|---|---|---|---|---|---|
| Quadrant | DetID | PixID | Counts | Sigma | Mean | Median | Sigma |
| A | 13 | 254 | 7239 | 40.49 | 802 | 787 | 159.4 |
| A | 0 | 226 | 6947 | 38.65 | 802 | 787 | 159.4 |
| A | 3 | 137 | 6130 | 33.53 | 802 | 787 | 159.4 |
| B | 0 | 190 | 51980 | 347.18 | 793 | 775 | 147.5 |
| B | 0 | 229 | 42993 | 286.25 | 793 | 775 | 147.5 |
| B | 15 | 19 | 31725 | 209.85 | 793 | 775 | 147.5 |
| C | 14 | 238 | 121074 | 667.78 | 776 | 783 | 180.1 |
| C | 3 | 233 | 18394 | 97.76 | 776 | 783 | 180.1 |
| C | 13 | 61 | 5411 | 25.69 | 776 | 783 | 180.1 |
| D | 7 | 238 | 816542 | 4519.47 | 748 | 728 | 180.5 |
| D | 10 | 66 | 743388 | 4114.21 | 748 | 728 | 180.5 |
| D | 1 | 52 | 113522 | 624.86 | 748 | 728 | 180.5 |
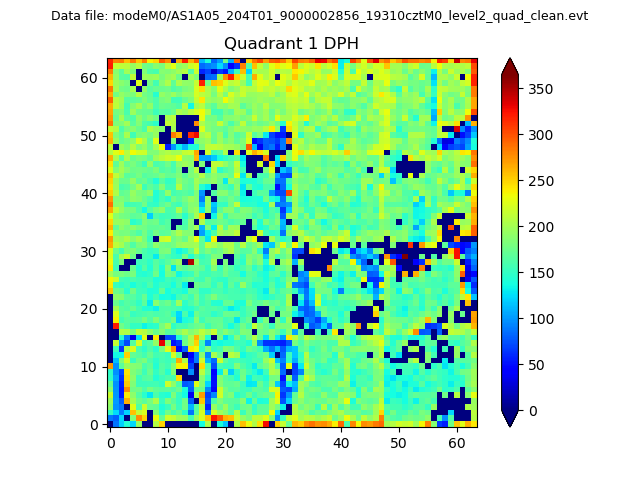
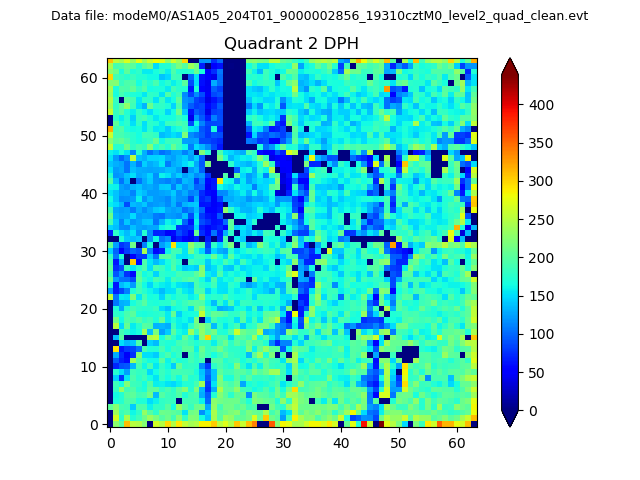
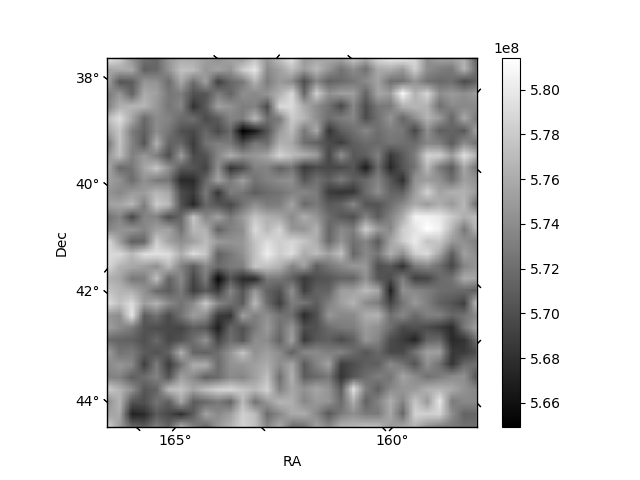
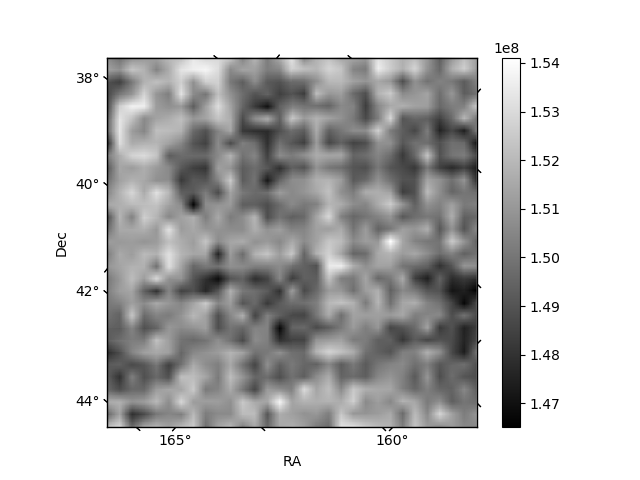
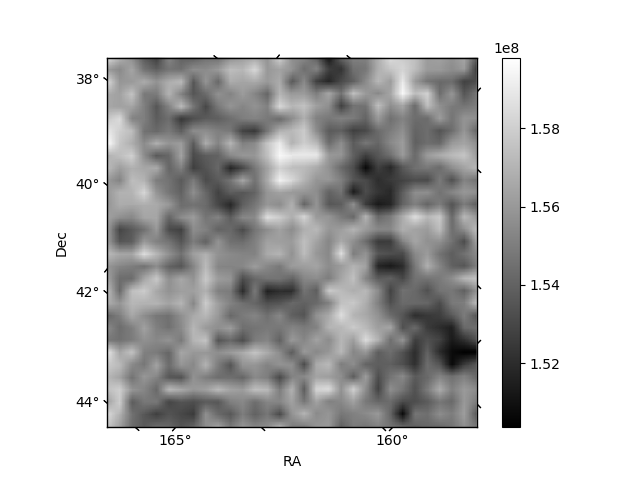
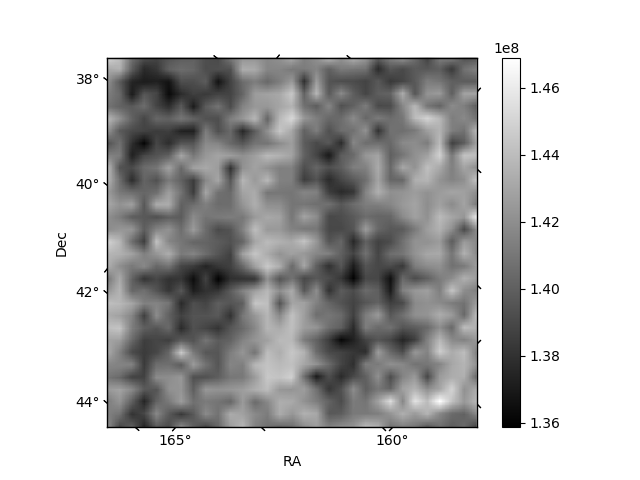
Histogram calculated using DETX and DETY for each event in the final _common_clean file
| Quadrant A | 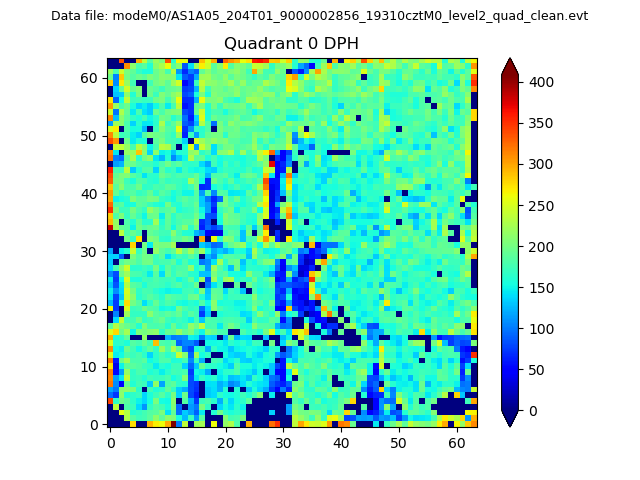 |
 |
Quadrant B |
|---|---|---|---|
| Quadrant D | 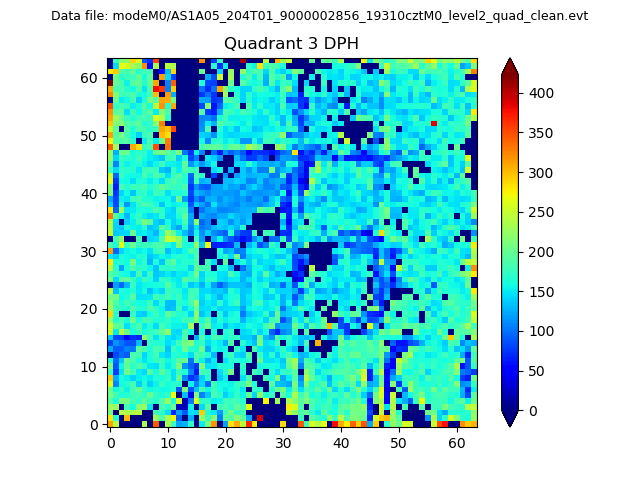 |
 |
Quadrant C |
| Plot type | Count rate plots | Images |
|---|---|---|
| Comparison with Poisson distribution Blue bars denote a histogram of data divided into 1 sec bins. Red curve is a Poisson curve with rate = median count rate of data. |
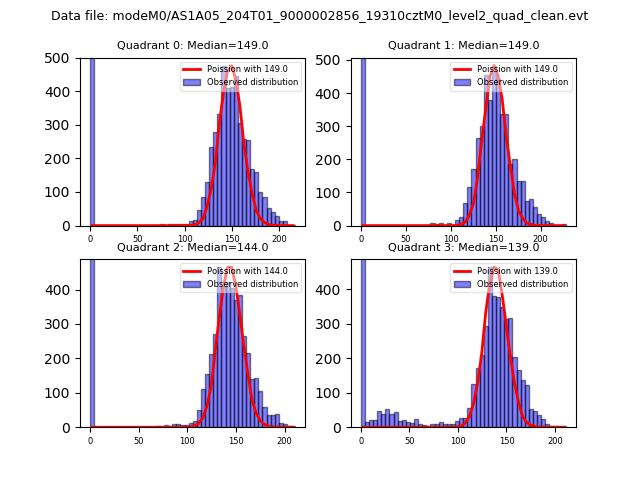 |
 |
| Quadrant-wise count rates Data is divided into 100 sec bins |
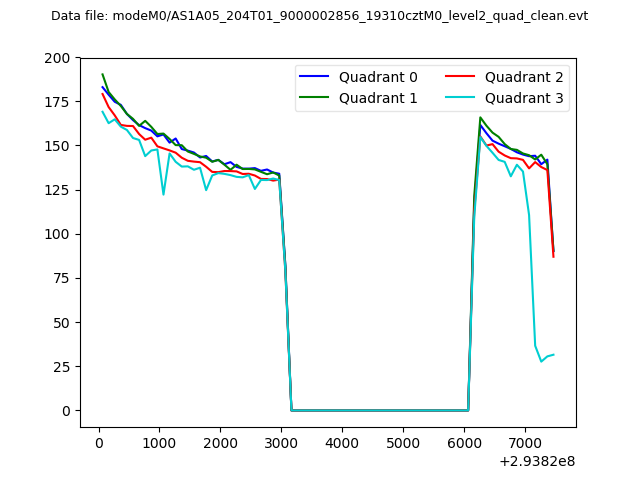 |
|
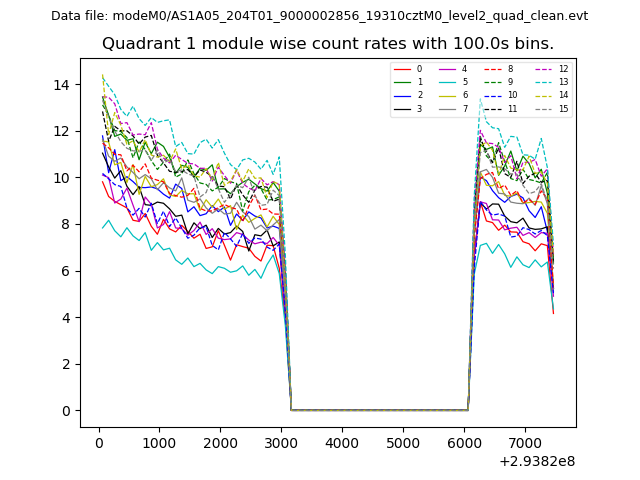
| Module-wise count rates for Quadrant A Data is divided into 100 sec bins |
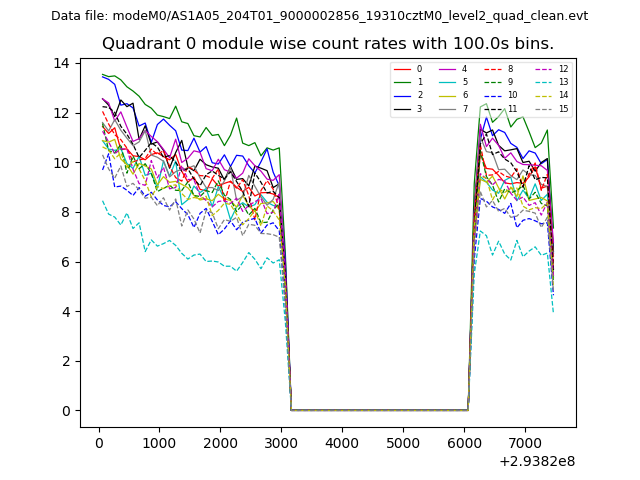 |
 |
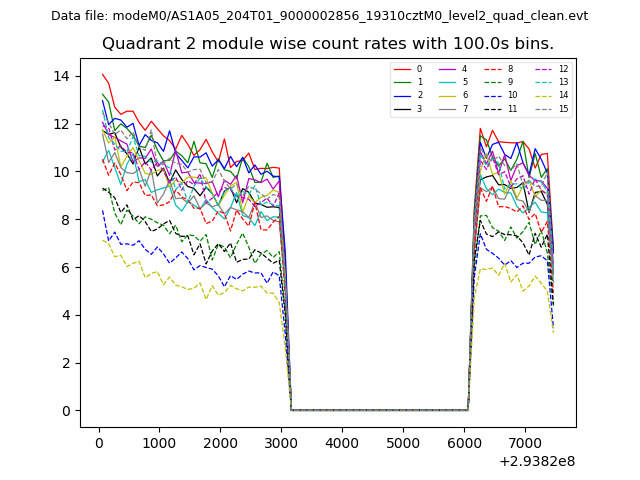
| Module-wise count rates for Quadrant B Data is divided into 100 sec bins |
 |
 |
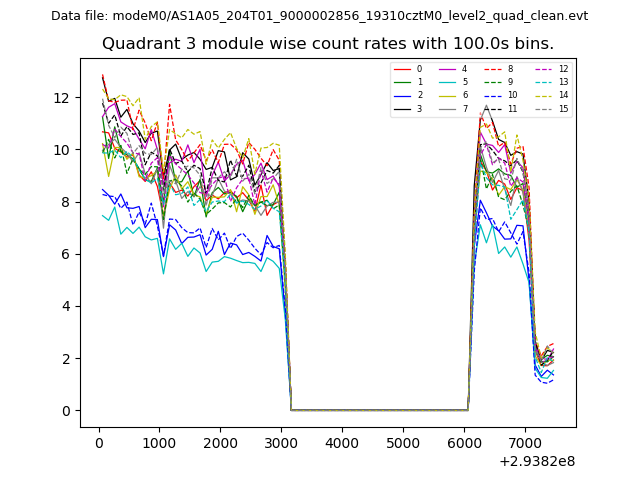
| Module-wise count rates for Quadrant C Data is divided into 100 sec bins |
 |
 |
| Module-wise count rates for Quadrant D Data is divided into 100 sec bins |
 |
 |
| Parameter | Plot |
|---|---|
| CZT HV Monitor | 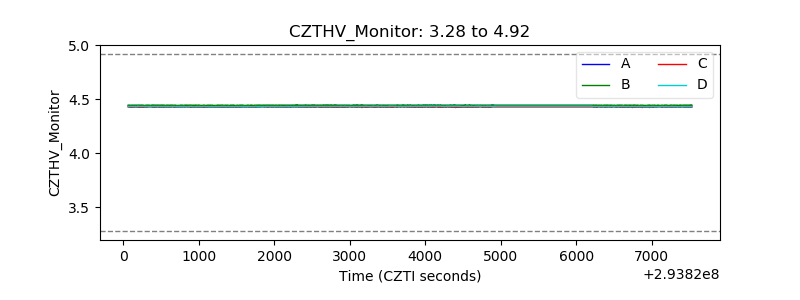 |
| D_VDD | 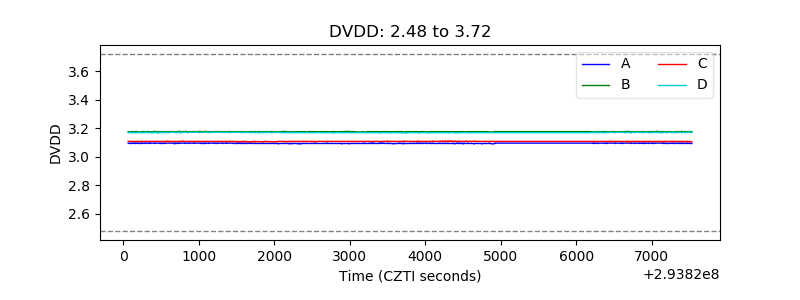 |
| Temperature 1 | 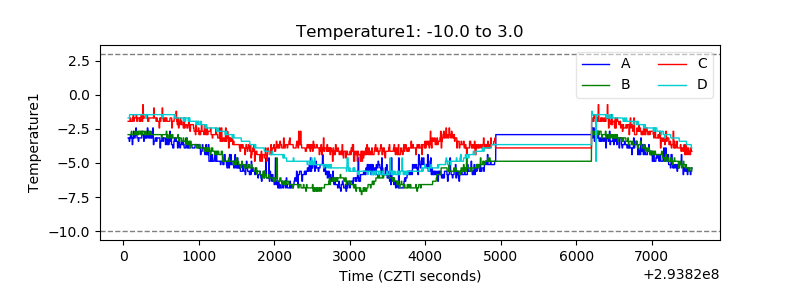 |
| Veto HV Monitor |  |
| Veto LLD | 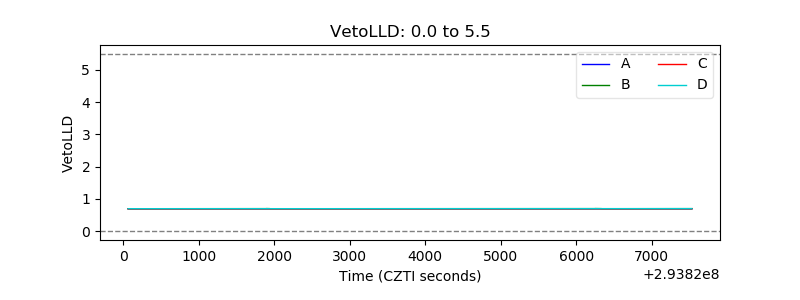 |
| Alpha Counter | 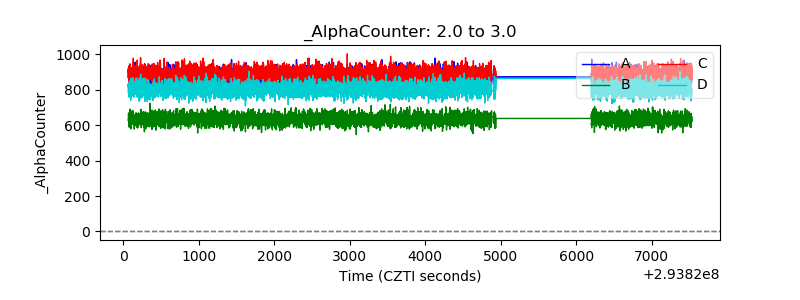 |
| _CPM_Rate | 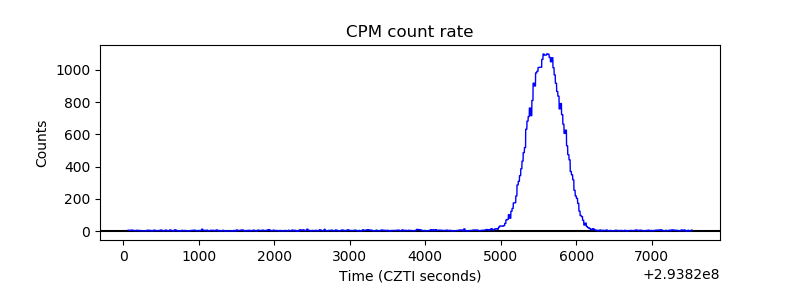 |
| CZT Counter | 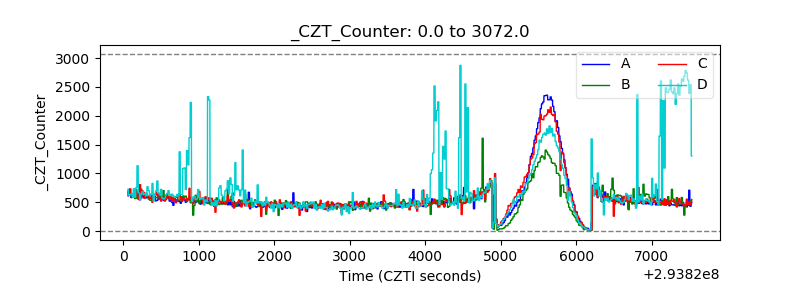 |
| +2.5 Volts monitor |  |
| +5 Volts monitor |  |
| _ROLL_ROT | 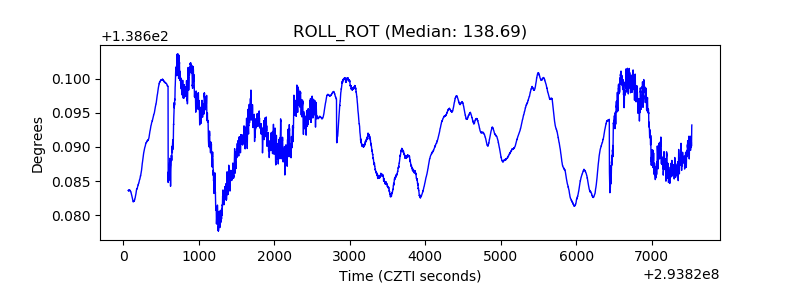 |
| _Roll_DEC |  |
| _Roll_RA | 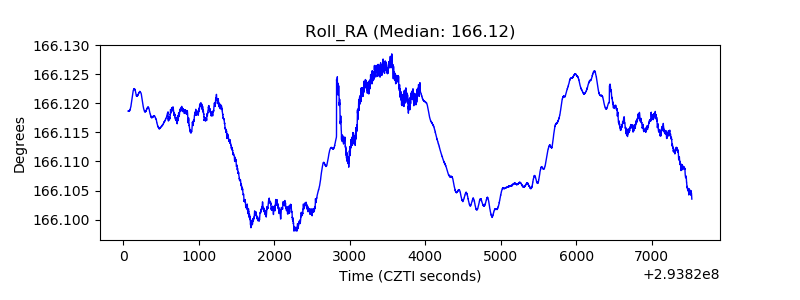 |
| Veto Counter | 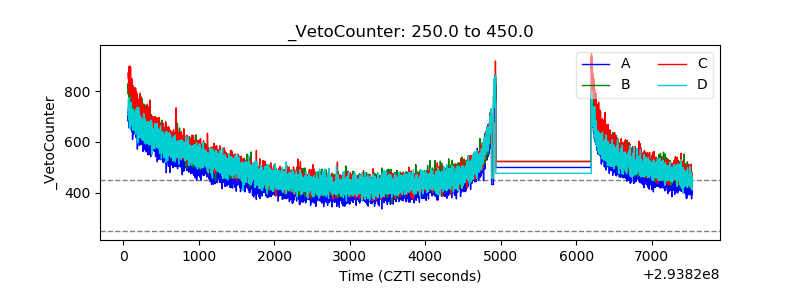 |