| Param | Original file | Final file |
|---|---|---|
| Filename | modeM0/AS1A05_204T01_9000002856_19311cztM0_level2.evt | modeM0/AS1A05_204T01_9000002856_19311cztM0_level2_quad_clean.evt |
| Size (bytes) | 682,761,600 | 90,812,160 |
| Size | 651.1 MB | 86.6 MB |
| Events in quadrant A | 3,171,835 | 610,064 |
| Events in quadrant B | 3,320,988 | 613,100 |
| Events in quadrant C | 3,265,448 | 590,831 |
| Events in quadrant D | 10,477,702 | 480,411 |
| Mode M0 | |||
|---|---|---|---|
| Quadrant | BADHDUFLAG | Total packets | Discarded packets |
| A | 0 | 13642 | 2 |
| B | 0 | 14042 | 2 |
| C | 0 | 13789 | 2 |
| D | 0 | 35583 | 2 |
| Mode M9 | |||
|---|---|---|---|
| Quadrant | BADHDUFLAG | Total packets | Discarded packets |
| A | 0 | 17 | 0 |
| B | 0 | 18 | 0 |
| C | 0 | 18 | 0 |
| D | 0 | 18 | 0 |
| Mode SS | |||
|---|---|---|---|
| Quadrant | BADHDUFLAG | Total packets | Discarded packets |
| A | 0 | 132 | 0 |
| B | 0 | 132 | 0 |
| C | 0 | 132 | 0 |
| D | 0 | 132 | 0 |
| Quadrant | Total seconds | Saturated seconds | Saturation percentage |
|---|---|---|---|
| A | 6526 | 39 | 0.597610% |
| B | 6526 | 66 | 1.011339% |
| C | 6526 | 108 | 1.654919% |
| D | 6526 | 2510 | 38.461538% |
Noise dominated data is calculated using 1-second bins in cleaned event files. If a bin has >2000 counts, and if more than 50% of those come from <1% of pixels, then it is considered to be noise-dominated and hence unusable.
| Quadrant | # 1 sec bins | Bins with >0 counts | Bins with >2000 counts | High rate bins dominated by noise | Noise dominated (total time) | Noise dominated (detector-on time) | Marked lightcurve |
|---|---|---|---|---|---|---|---|
| A | 7526 | 6527 | 0 | 0 | 0.00% | 0.00% | 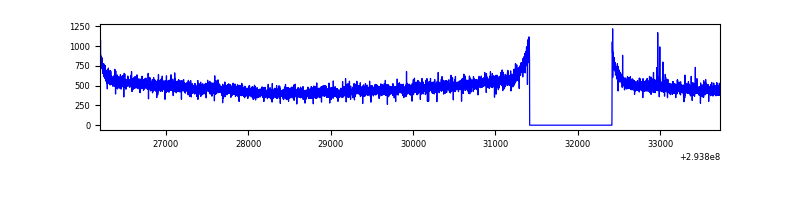 |
| B | 7526 | 6527 | 0 | 0 | 0.00% | 0.00% | 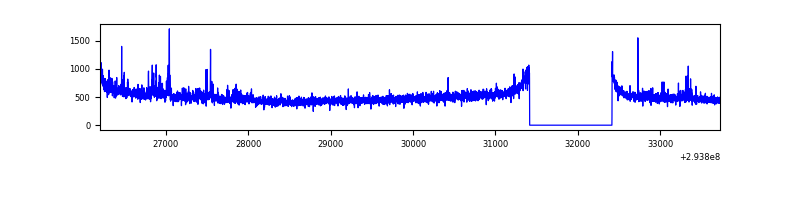 |
| C | 7526 | 6527 | 0 | 0 | 0.00% | 0.00% | 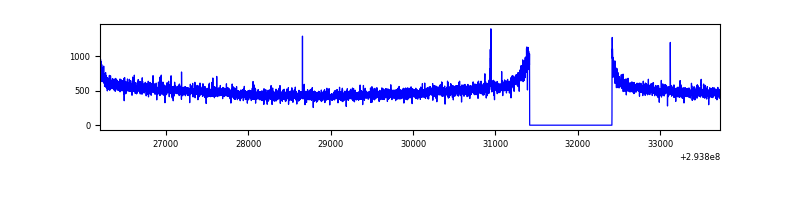 |
| D | 7526 | 6526 | 2324 | 2324 | 30.88% | 35.61% | 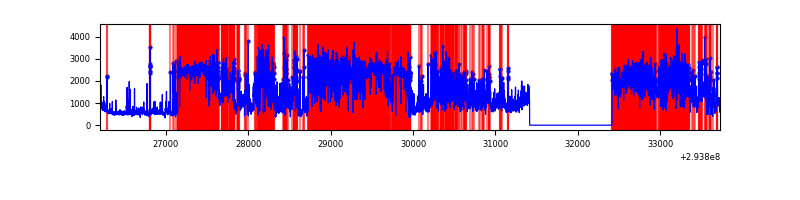 |
Top three noisy pixels from each quadrant. If the there are fewer than three noisy pixels in the level2.evt file, extra rows are filled as -1
| Pixel properties | Quadrant properties | ||||||
|---|---|---|---|---|---|---|---|
| Quadrant | DetID | PixID | Counts | Sigma | Mean | Median | Sigma |
| A | 4 | 2 | 10070 | 56.22 | 820 | 803 | 164.8 |
| A | 13 | 254 | 7509 | 40.68 | 820 | 803 | 164.8 |
| A | 0 | 226 | 7190 | 38.74 | 820 | 803 | 164.8 |
| B | 0 | 229 | 52105 | 332.43 | 813 | 793 | 154.4 |
| B | 0 | 190 | 48269 | 307.58 | 813 | 793 | 154.4 |
| B | 15 | 19 | 21296 | 132.83 | 813 | 793 | 154.4 |
| C | 14 | 238 | 122467 | 656.73 | 792 | 797 | 185.3 |
| C | 3 | 233 | 47012 | 249.45 | 792 | 797 | 185.3 |
| C | 9 | 54 | 6215 | 29.24 | 792 | 797 | 185.3 |
| D | 10 | 66 | 4572160 | 27530.72 | 683 | 665 | 166.1 |
| D | 7 | 238 | 1490815 | 8974.07 | 683 | 665 | 166.1 |
| D | 1 | 52 | 1263115 | 7602.8 | 683 | 665 | 166.1 |
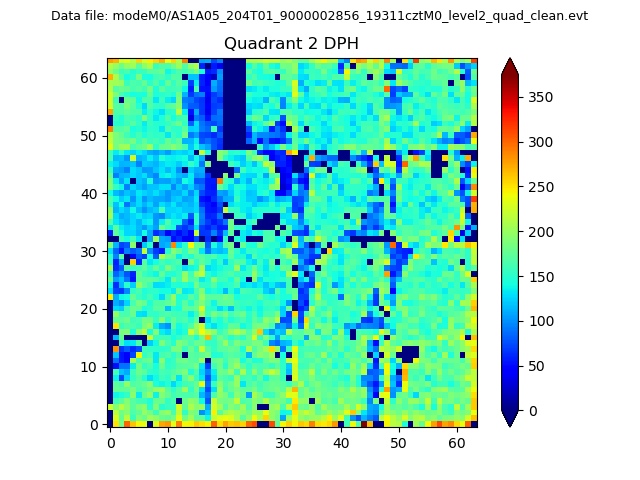
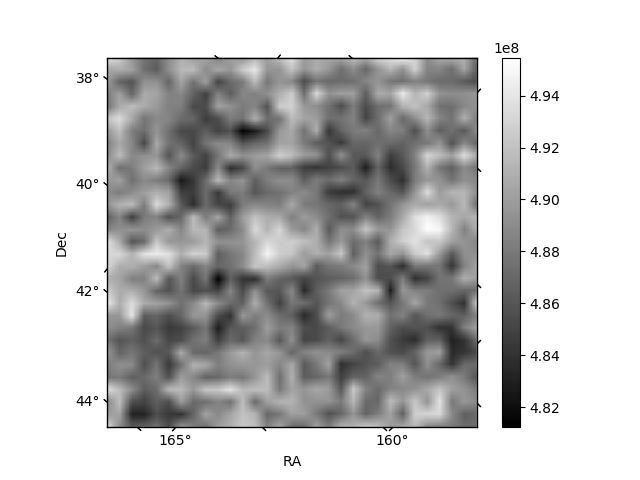
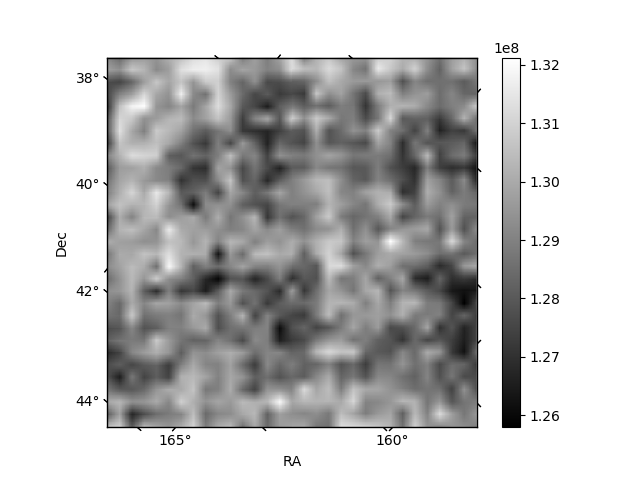
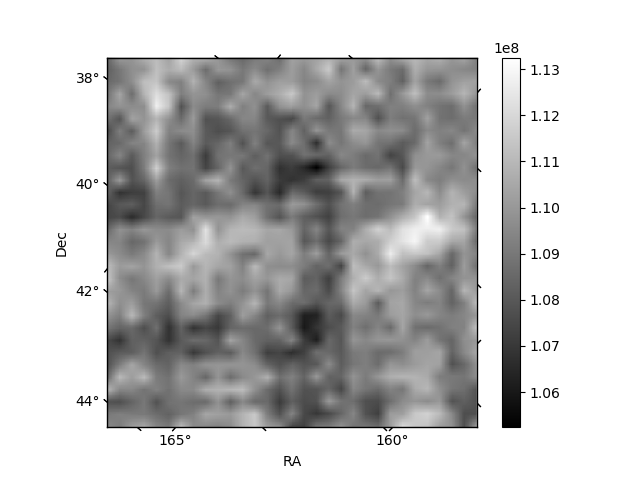
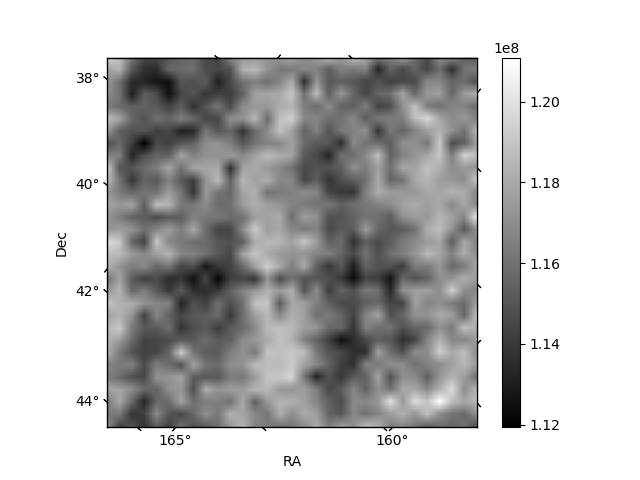
Histogram calculated using DETX and DETY for each event in the final _common_clean file
| Quadrant A | 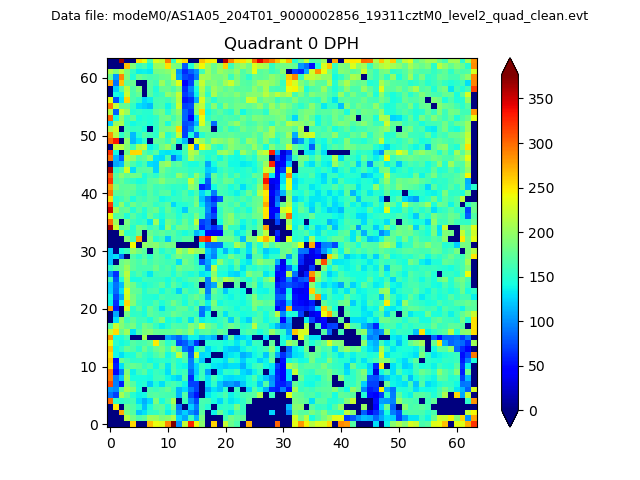 |
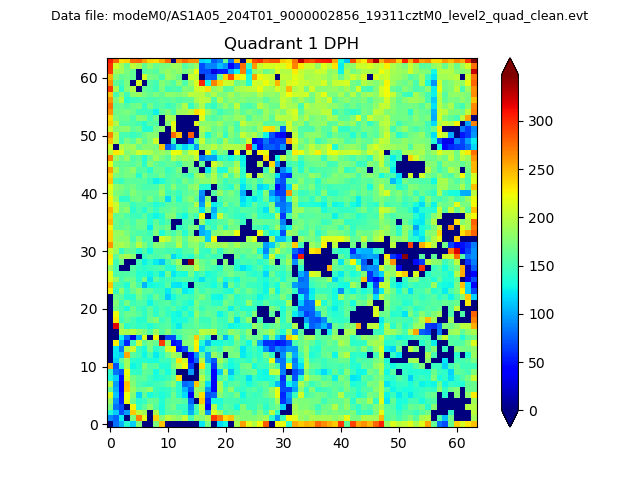 |
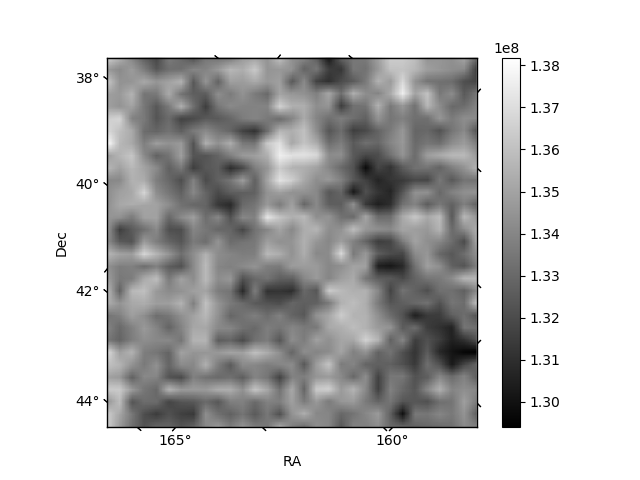
Quadrant B |
|---|---|---|---|
| Quadrant D | 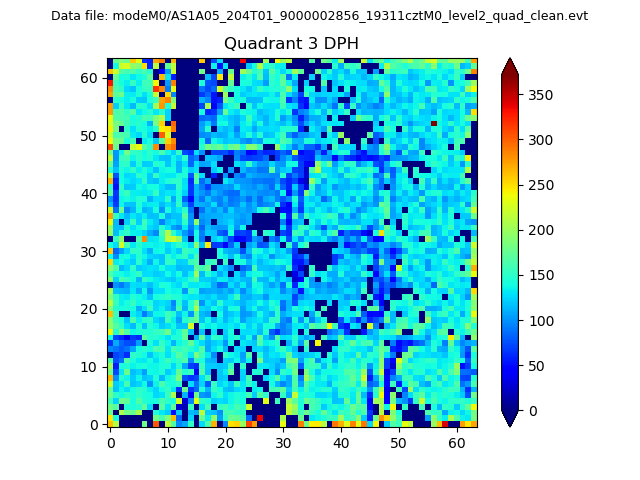 |
 |
Quadrant C |
| Plot type | Count rate plots | Images |
|---|---|---|
| Comparison with Poisson distribution Blue bars denote a histogram of data divided into 1 sec bins. Red curve is a Poisson curve with rate = median count rate of data. |
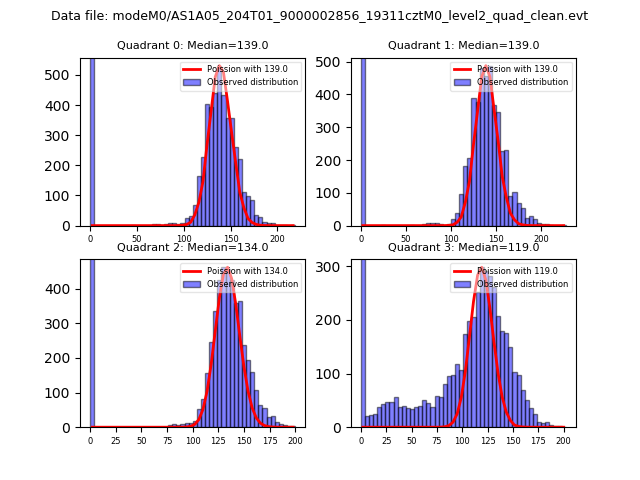 |
 |
| Quadrant-wise count rates Data is divided into 100 sec bins |
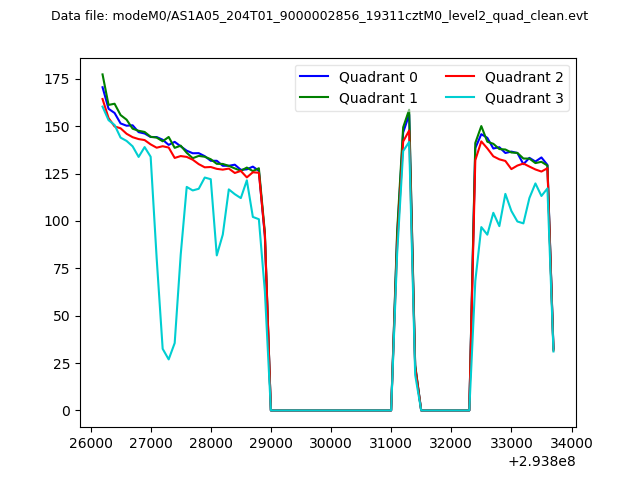 |
|
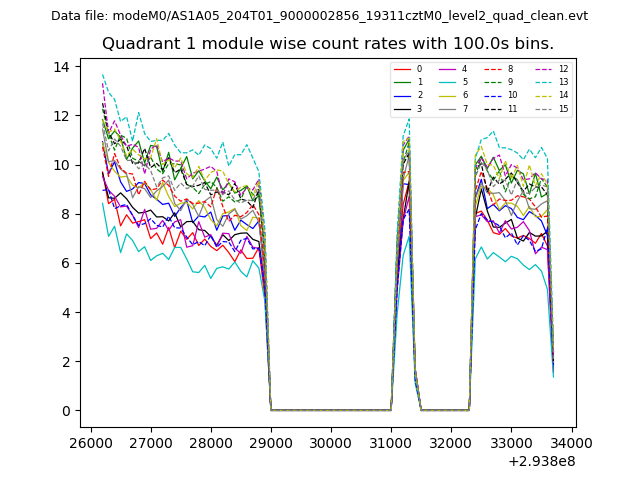
| Module-wise count rates for Quadrant A Data is divided into 100 sec bins |
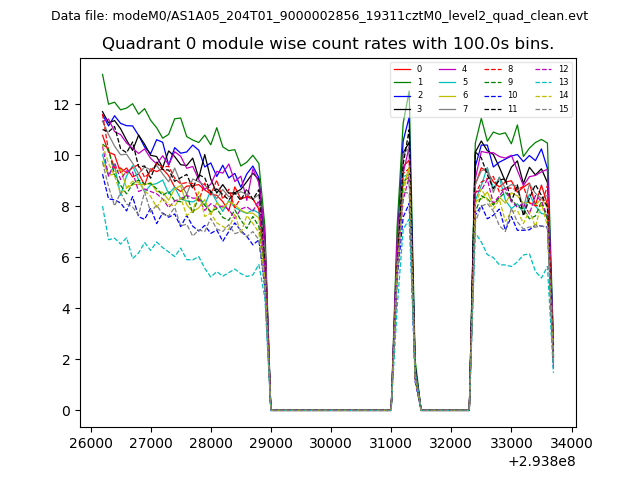 |
 |
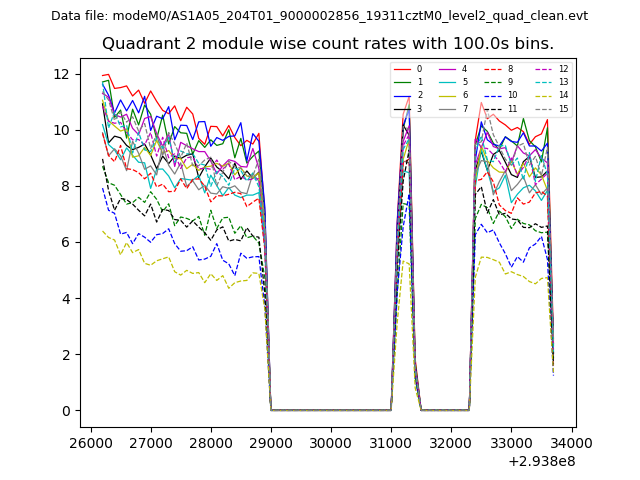
| Module-wise count rates for Quadrant B Data is divided into 100 sec bins |
 |
 |
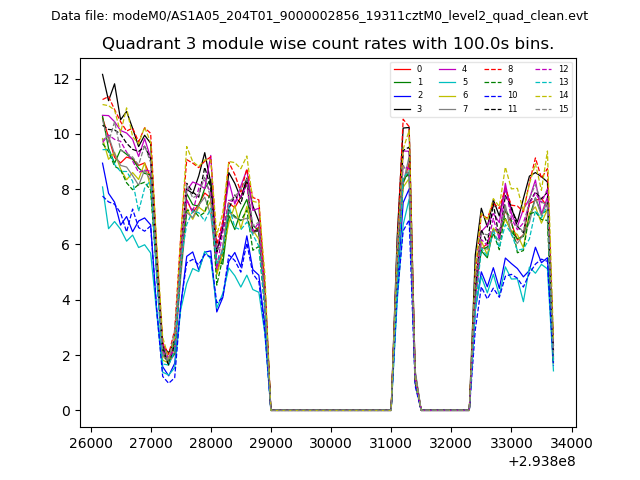
| Module-wise count rates for Quadrant C Data is divided into 100 sec bins |
 |
 |
| Module-wise count rates for Quadrant D Data is divided into 100 sec bins |
 |
 |
| Parameter | Plot |
|---|---|
| CZT HV Monitor | 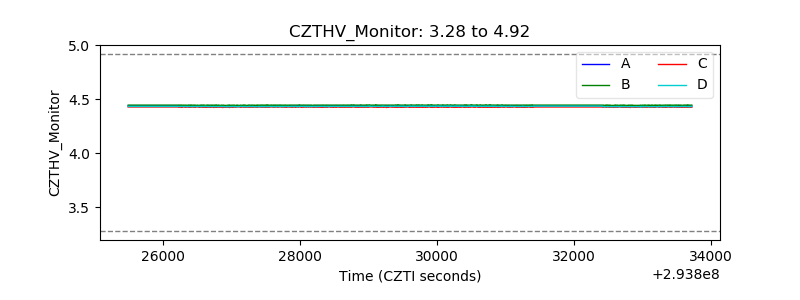 |
| D_VDD | 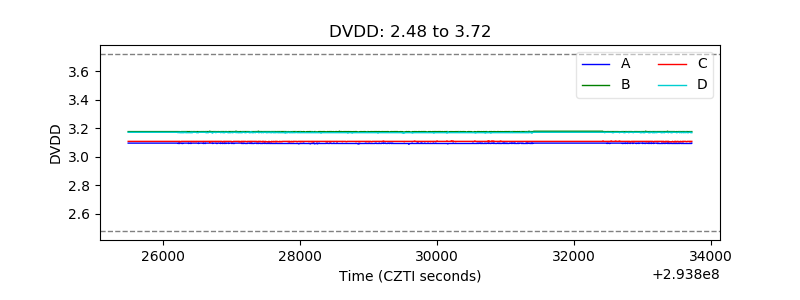 |
| Temperature 1 | 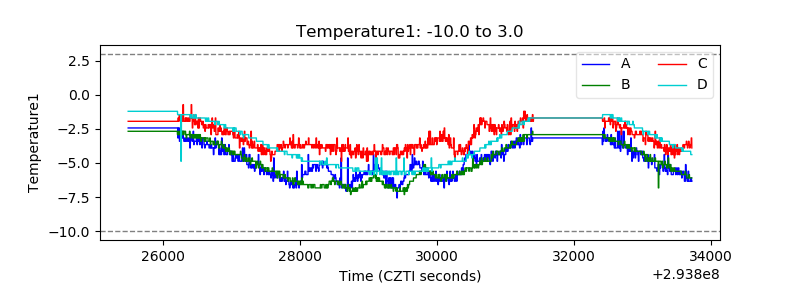 |
| Veto HV Monitor |  |
| Veto LLD |  |
| Alpha Counter | 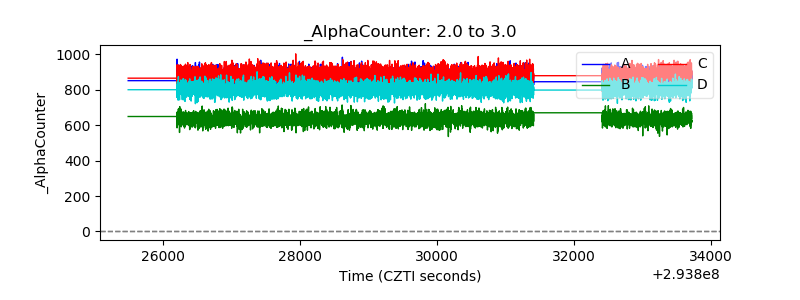 |
| _CPM_Rate | 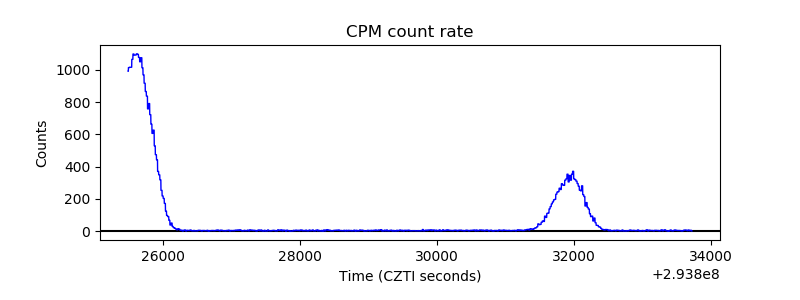 |
| CZT Counter | 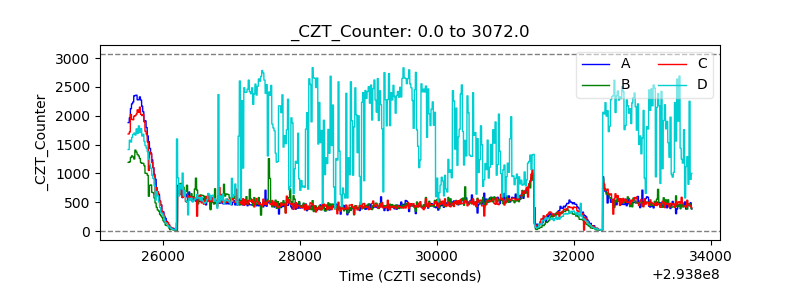 |
| +2.5 Volts monitor | 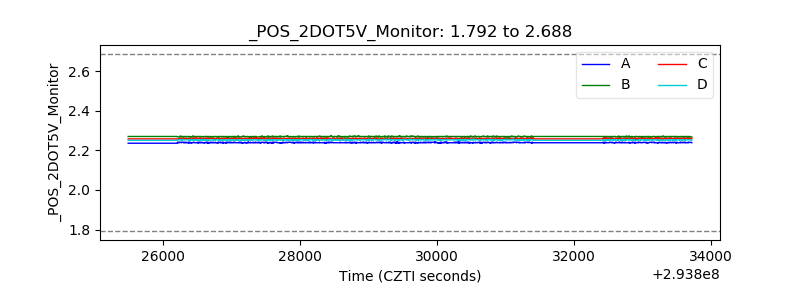 |
| +5 Volts monitor |  |
| _ROLL_ROT | 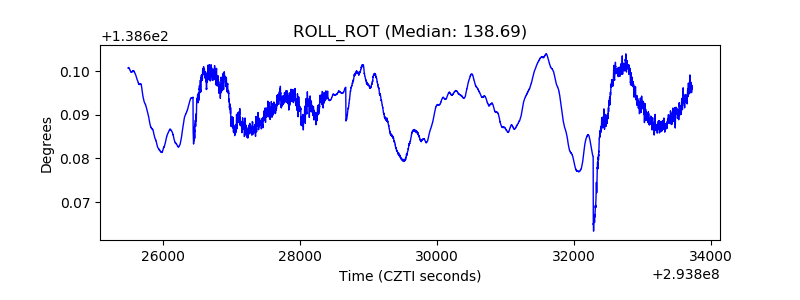 |
| _Roll_DEC | 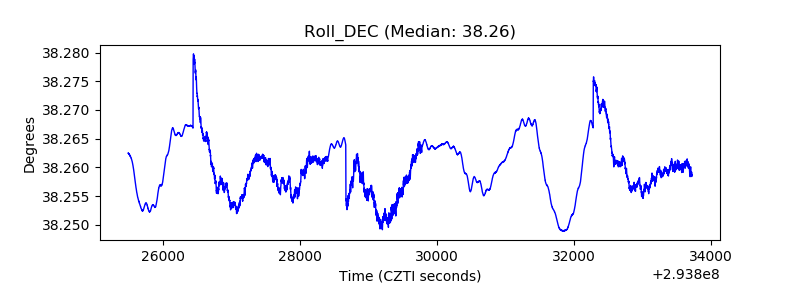 |
| _Roll_RA | 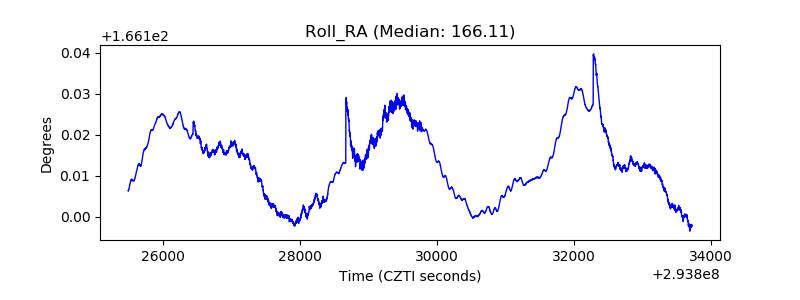 |
| Veto Counter | 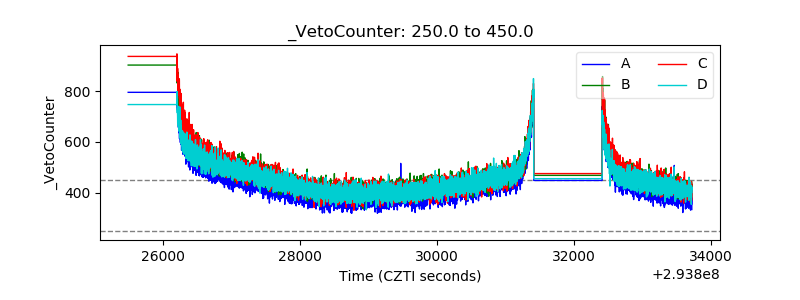 |