| Param | Original file | Final file |
|---|---|---|
| Filename | modeM0/AS1A05_204T01_9000002856_19312cztM0_level2.evt | modeM0/AS1A05_204T01_9000002856_19312cztM0_level2_quad_clean.evt |
| Size (bytes) | 701,000,640 | 93,084,480 |
| Size | 668.5 MB | 88.8 MB |
| Events in quadrant A | 3,264,942 | 625,926 |
| Events in quadrant B | 3,346,547 | 631,829 |
| Events in quadrant C | 3,361,523 | 608,465 |
| Events in quadrant D | 10,789,308 | 470,548 |
| Mode M0 | |||
|---|---|---|---|
| Quadrant | BADHDUFLAG | Total packets | Discarded packets |
| A | 0 | 14346 | 2 |
| B | 0 | 14397 | 2 |
| C | 0 | 14414 | 2 |
| D | 0 | 36897 | 4 |
| Mode M9 | |||
|---|---|---|---|
| Quadrant | BADHDUFLAG | Total packets | Discarded packets |
| A | 0 | 6 | 0 |
| B | 0 | 7 | 0 |
| C | 0 | 7 | 0 |
| D | 0 | 7 | 0 |
| Mode SS | |||
|---|---|---|---|
| Quadrant | BADHDUFLAG | Total packets | Discarded packets |
| A | 0 | 140 | 0 |
| B | 0 | 140 | 0 |
| C | 0 | 140 | 0 |
| D | 0 | 140 | 0 |
| Quadrant | Total seconds | Saturated seconds | Saturation percentage |
|---|---|---|---|
| A | 6910 | 22 | 0.318379% |
| B | 6910 | 45 | 0.651230% |
| C | 6910 | 64 | 0.926194% |
| D | 6909 | 2541 | 36.778116% |
Noise dominated data is calculated using 1-second bins in cleaned event files. If a bin has >2000 counts, and if more than 50% of those come from <1% of pixels, then it is considered to be noise-dominated and hence unusable.
| Quadrant | # 1 sec bins | Bins with >0 counts | Bins with >2000 counts | High rate bins dominated by noise | Noise dominated (total time) | Noise dominated (detector-on time) | Marked lightcurve |
|---|---|---|---|---|---|---|---|
| A | 7545 | 6911 | 0 | 0 | 0.00% | 0.00% | 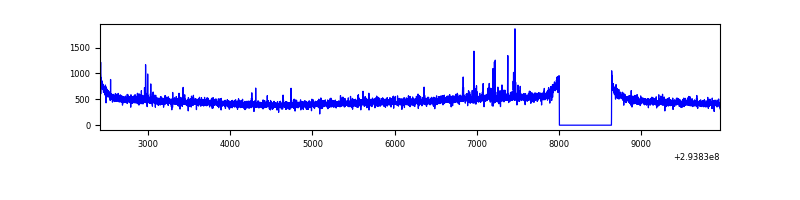 |
| B | 7545 | 6911 | 0 | 0 | 0.00% | 0.00% | 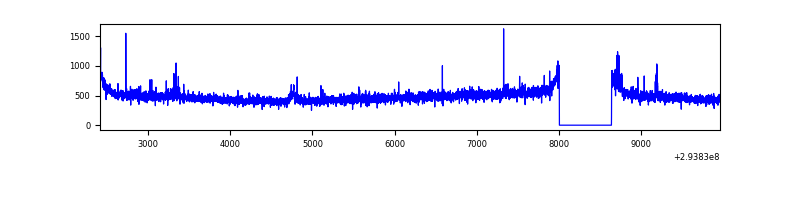 |
| C | 7545 | 6911 | 0 | 0 | 0.00% | 0.00% | 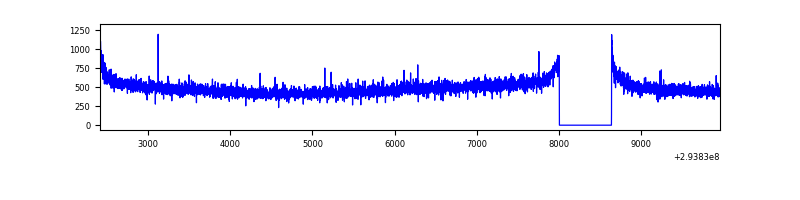 |
| D | 7544 | 6910 | 2086 | 2086 | 27.65% | 30.19% | 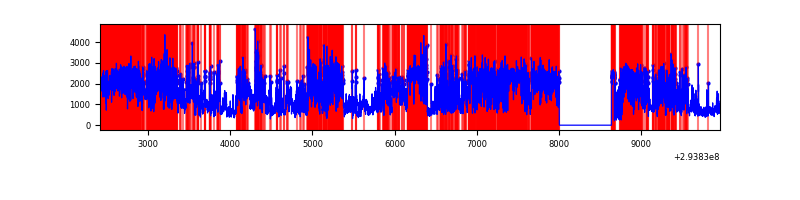 |
Top three noisy pixels from each quadrant. If the there are fewer than three noisy pixels in the level2.evt file, extra rows are filled as -1
| Pixel properties | Quadrant properties | ||||||
|---|---|---|---|---|---|---|---|
| Quadrant | DetID | PixID | Counts | Sigma | Mean | Median | Sigma |
| A | 5 | 16 | 19770 | 112.56 | 837 | 820 | 168.4 |
| A | 4 | 2 | 12121 | 67.12 | 837 | 820 | 168.4 |
| A | 13 | 254 | 7598 | 40.26 | 837 | 820 | 168.4 |
| B | 0 | 229 | 26813 | 163.86 | 832 | 810 | 158.7 |
| B | 12 | 111 | 19180 | 115.76 | 832 | 810 | 158.7 |
| B | 11 | 111 | 16964 | 101.8 | 832 | 810 | 158.7 |
| C | 14 | 238 | 125619 | 654.32 | 809 | 812 | 190.7 |
| C | 3 | 233 | 75731 | 392.77 | 809 | 812 | 190.7 |
| C | 13 | 61 | 5594 | 25.07 | 809 | 812 | 190.7 |
| D | 10 | 66 | 4747059 | 28468.62 | 686 | 666 | 166.7 |
| D | 7 | 238 | 1555504 | 9325.84 | 686 | 666 | 166.7 |
| D | 1 | 52 | 1160185 | 6954.74 | 686 | 666 | 166.7 |
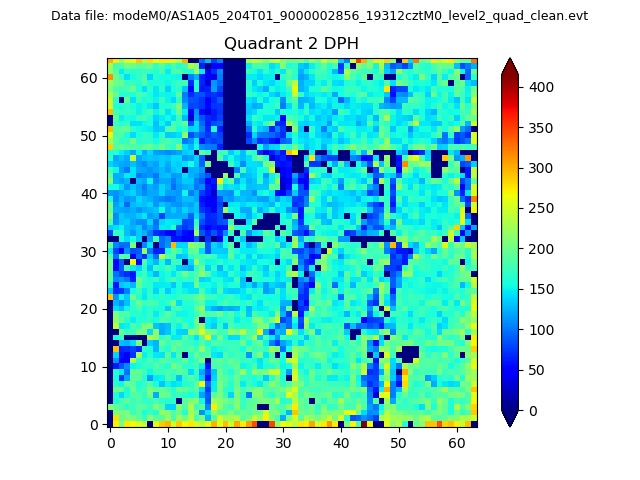
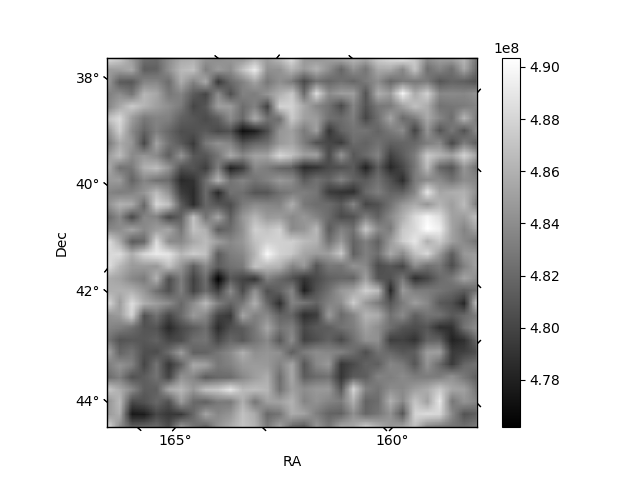
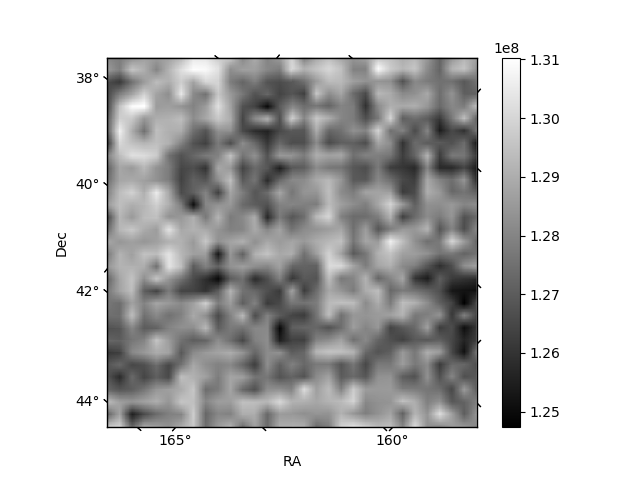
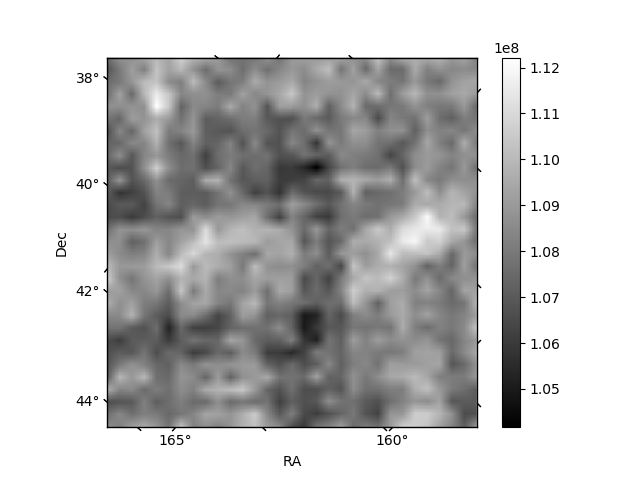
Histogram calculated using DETX and DETY for each event in the final _common_clean file
| Quadrant A | 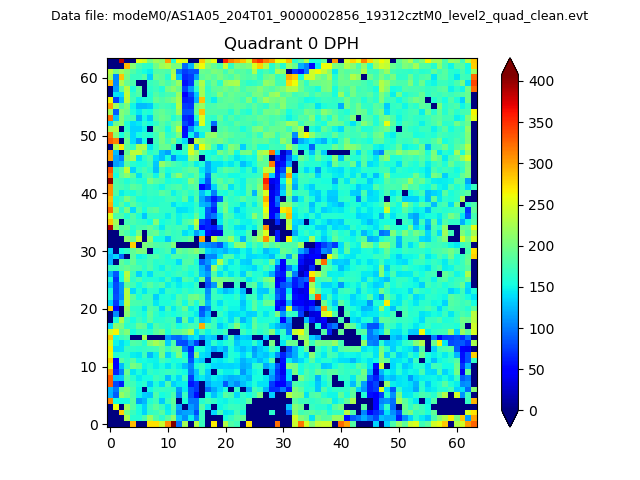 |
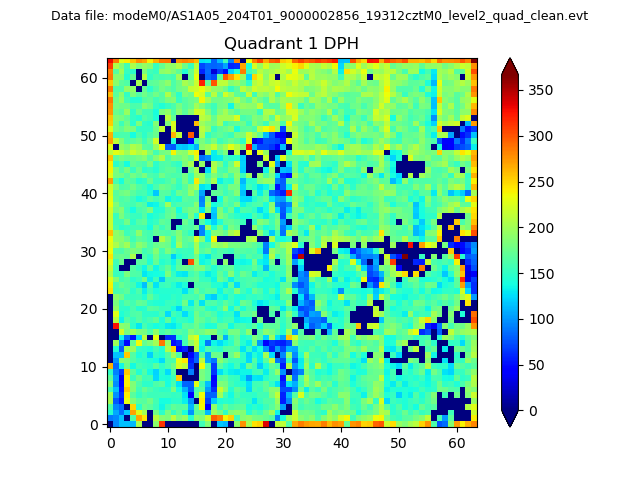 |
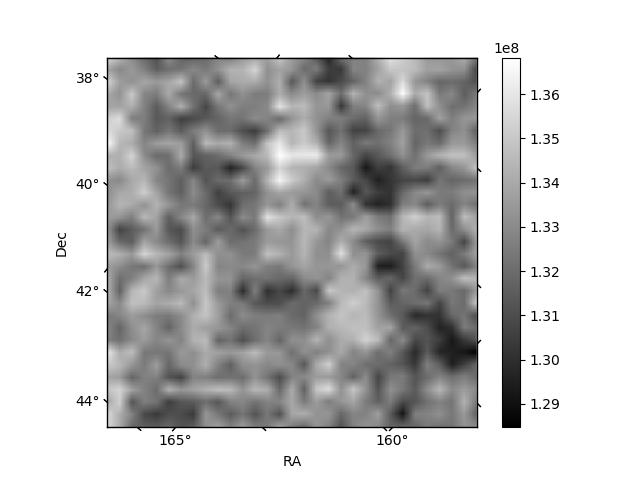
Quadrant B |
|---|---|---|---|
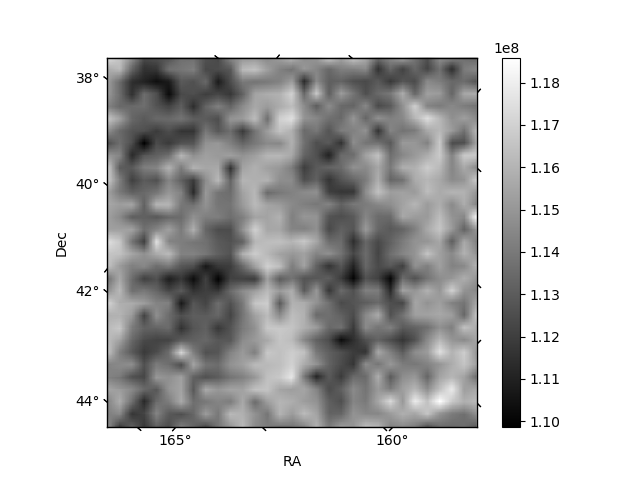
| Quadrant D | 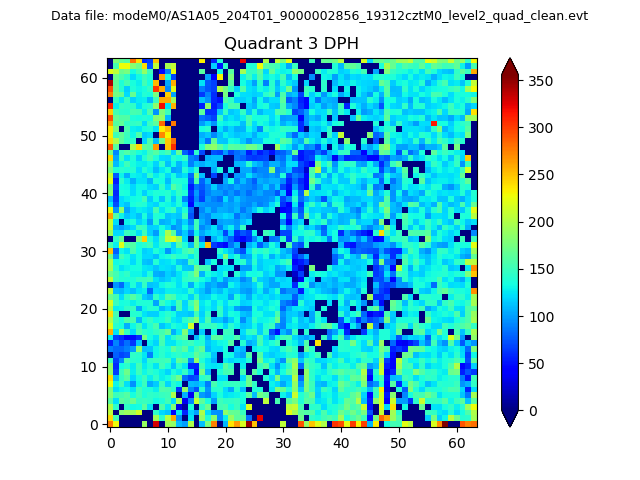 |
 |
Quadrant C |
| Plot type | Count rate plots | Images |
|---|---|---|
| Comparison with Poisson distribution Blue bars denote a histogram of data divided into 1 sec bins. Red curve is a Poisson curve with rate = median count rate of data. |
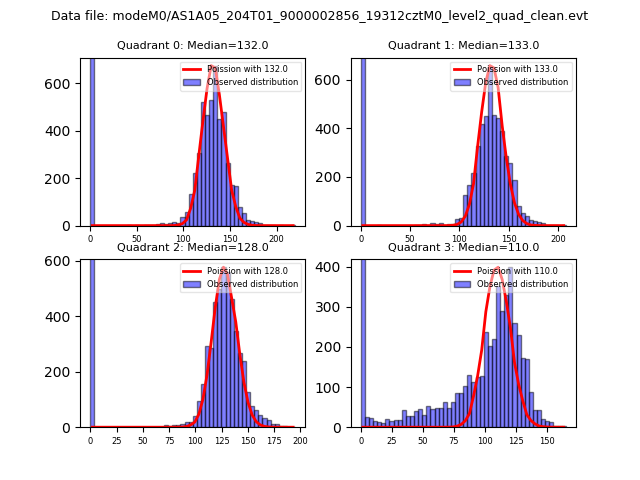 |
 |
| Quadrant-wise count rates Data is divided into 100 sec bins |
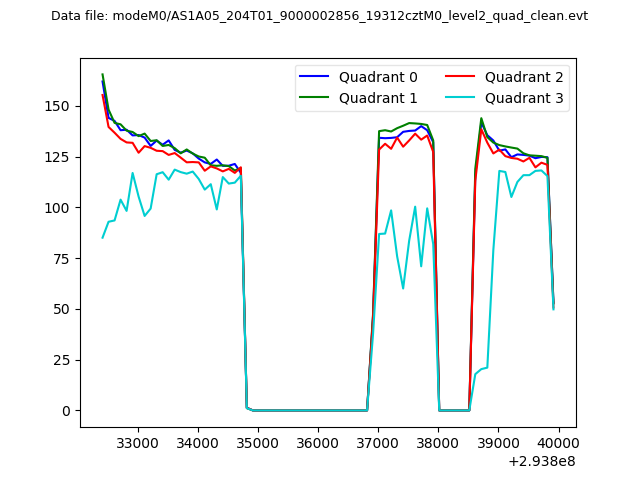 |
|
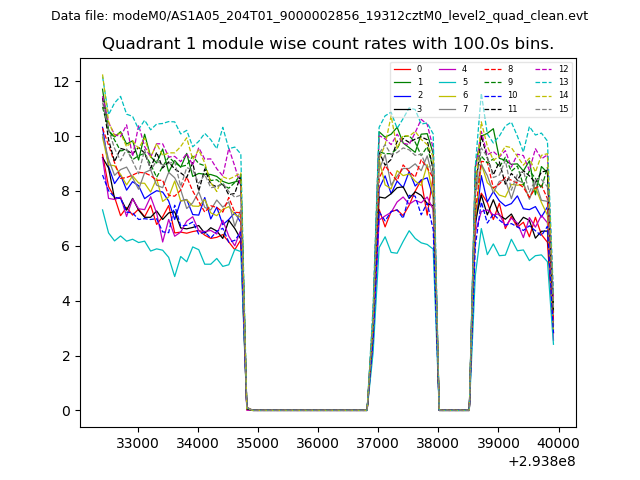
| Module-wise count rates for Quadrant A Data is divided into 100 sec bins |
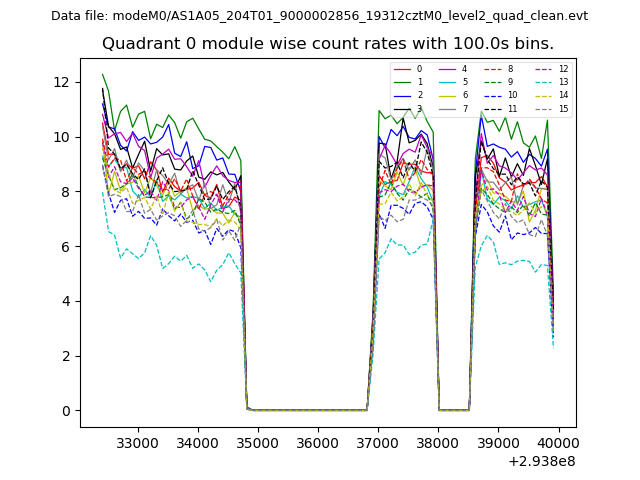 |
 |
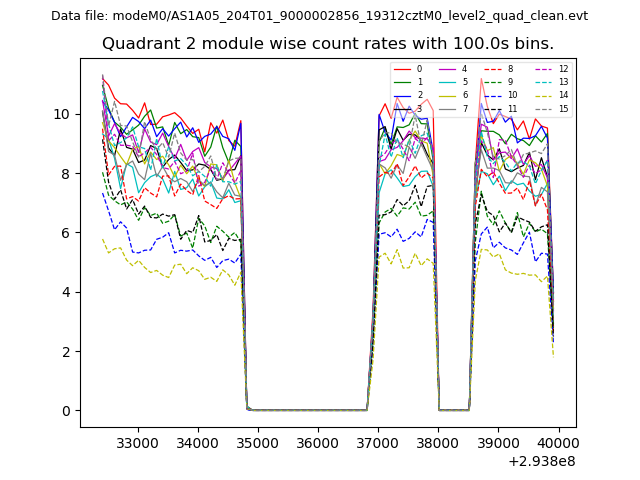
| Module-wise count rates for Quadrant B Data is divided into 100 sec bins |
 |
 |
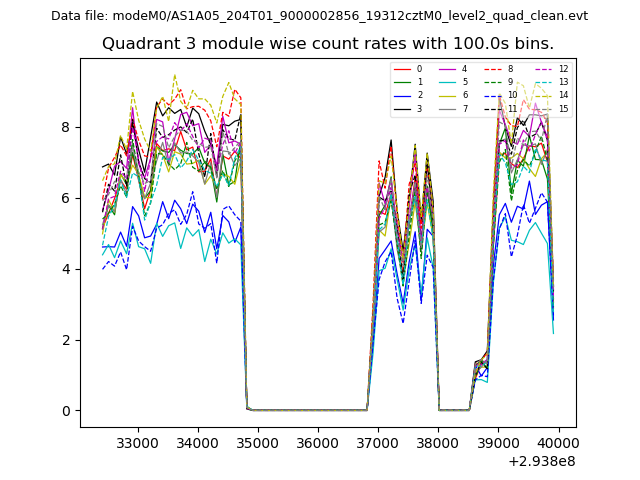
| Module-wise count rates for Quadrant C Data is divided into 100 sec bins |
 |
 |
| Module-wise count rates for Quadrant D Data is divided into 100 sec bins |
 |
 |
| Parameter | Plot |
|---|---|
| CZT HV Monitor | 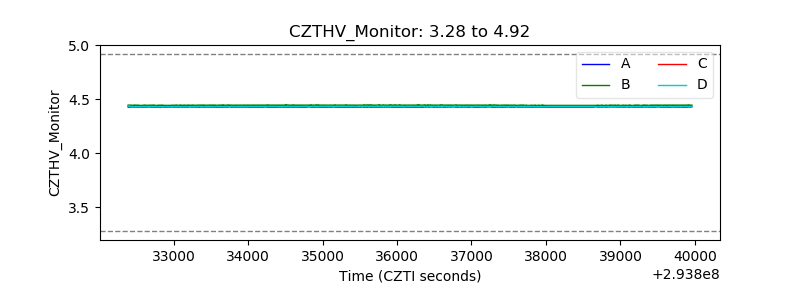 |
| D_VDD | 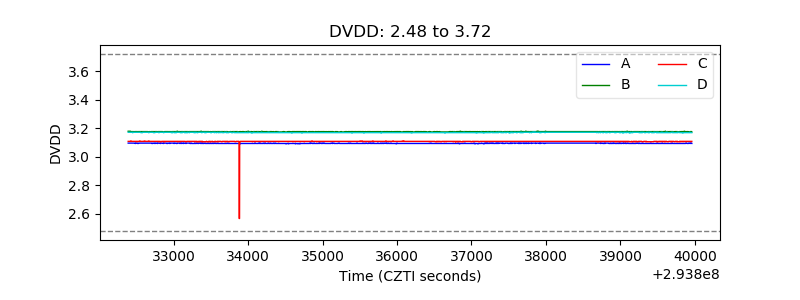 |
| Temperature 1 |  |
| Veto HV Monitor | 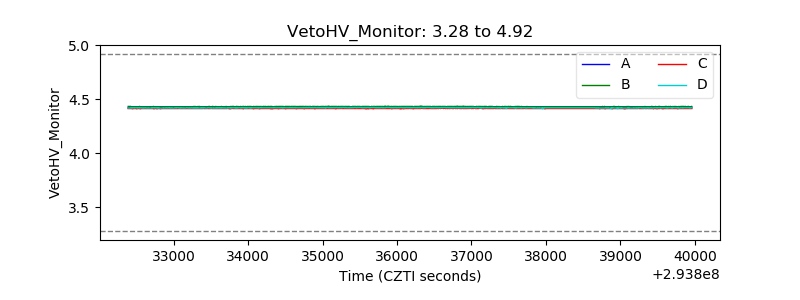 |
| Veto LLD | 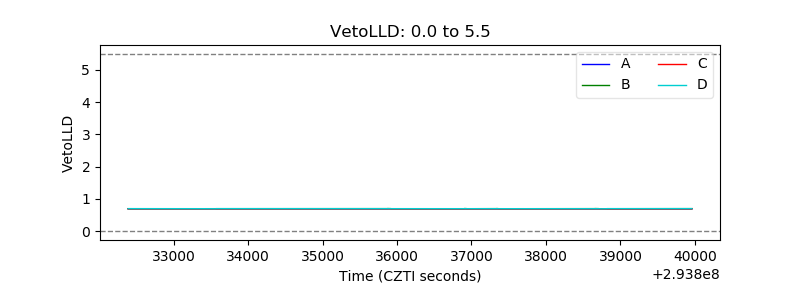 |
| Alpha Counter | 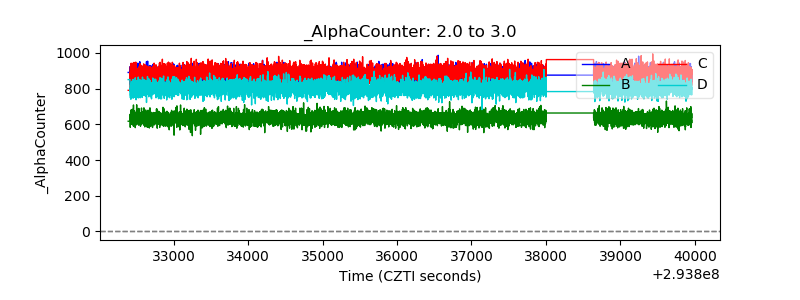 |
| _CPM_Rate | 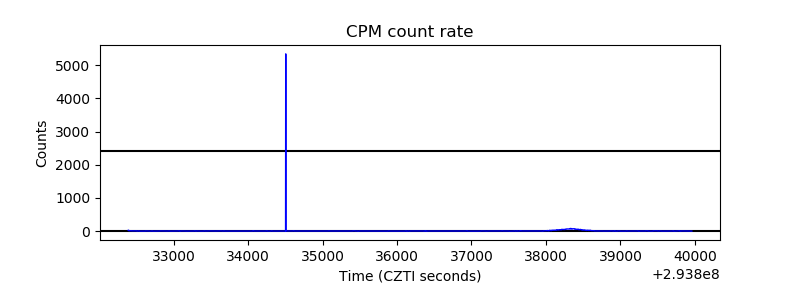 |
| CZT Counter | 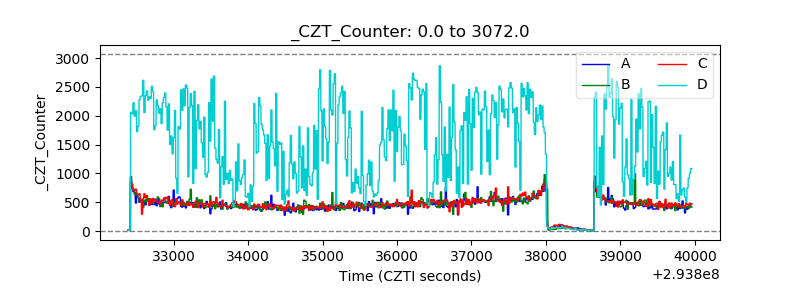 |
| +2.5 Volts monitor |  |
| +5 Volts monitor | 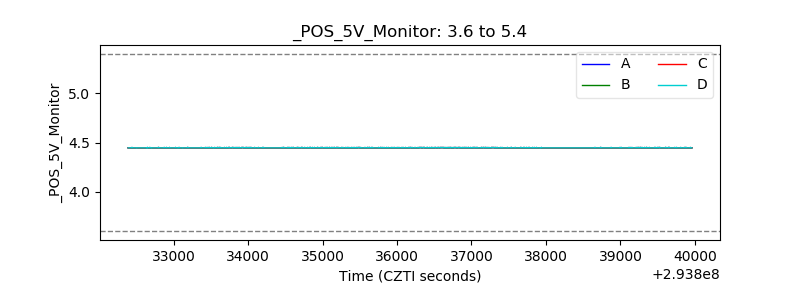 |
| _ROLL_ROT | 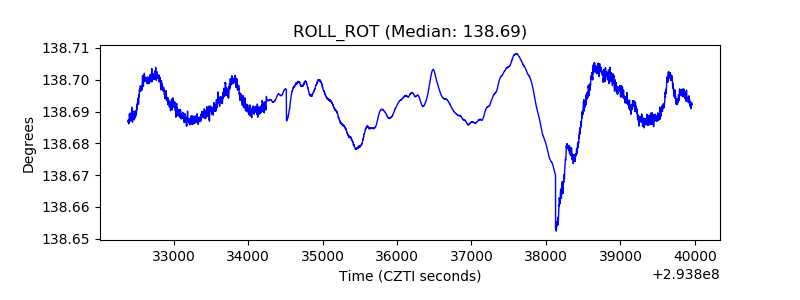 |
| _Roll_DEC | 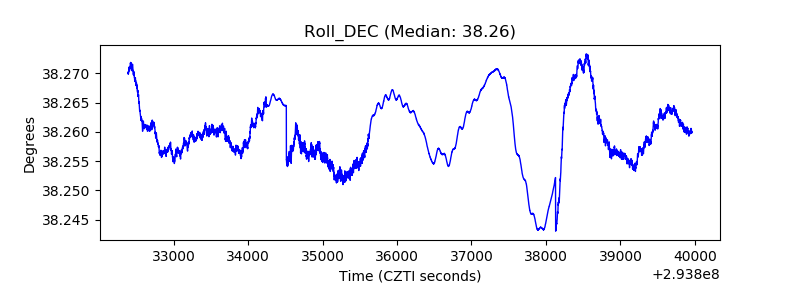 |
| _Roll_RA | 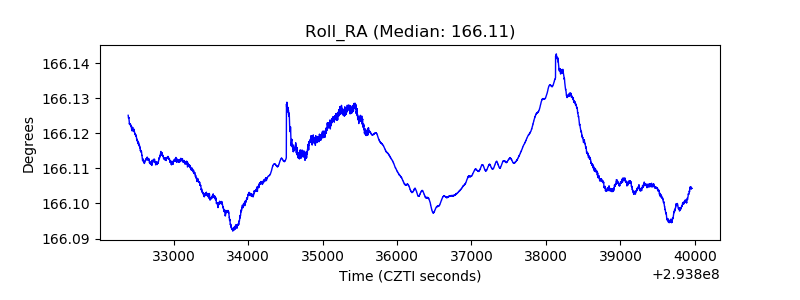 |
| Veto Counter | 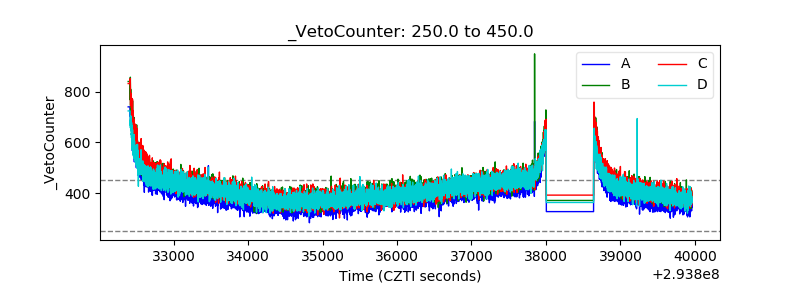 |