| Param | Original file | Final file |
|---|---|---|
| Filename | modeM0/AS1A05_204T01_9000002856_19315cztM0_level2.evt | modeM0/AS1A05_204T01_9000002856_19315cztM0_level2_quad_clean.evt |
| Size (bytes) | 797,817,600 | 89,199,360 |
| Size | 760.9 MB | 85.1 MB |
| Events in quadrant A | 3,600,753 | 594,752 |
| Events in quadrant B | 3,721,141 | 599,138 |
| Events in quadrant C | 3,769,634 | 573,936 |
| Events in quadrant D | 12,550,603 | 397,487 |
| Mode M0 | |||
|---|---|---|---|
| Quadrant | BADHDUFLAG | Total packets | Discarded packets |
| A | 0 | 15894 | 2 |
| B | 0 | 16159 | 2 |
| C | 0 | 16265 | 2 |
| D | 0 | 42620 | 2 |
| Mode M9 | |||
|---|---|---|---|
| Quadrant | BADHDUFLAG | Total packets | Discarded packets |
| A | 0 | 6 | 0 |
| B | 0 | 6 | 0 |
| C | 0 | 6 | 0 |
| D | 0 | 6 | 0 |
| Mode SS | |||
|---|---|---|---|
| Quadrant | BADHDUFLAG | Total packets | Discarded packets |
| A | 0 | 156 | 0 |
| B | 0 | 156 | 0 |
| C | 0 | 156 | 0 |
| D | 0 | 156 | 0 |
| Quadrant | Total seconds | Saturated seconds | Saturation percentage |
|---|---|---|---|
| A | 7687 | 116 | 1.509041% |
| B | 7688 | 171 | 2.224246% |
| C | 7688 | 185 | 2.406348% |
| D | 7688 | 3312 | 43.080125% |
Noise dominated data is calculated using 1-second bins in cleaned event files. If a bin has >2000 counts, and if more than 50% of those come from <1% of pixels, then it is considered to be noise-dominated and hence unusable.
| Quadrant | # 1 sec bins | Bins with >0 counts | Bins with >2000 counts | High rate bins dominated by noise | Noise dominated (total time) | Noise dominated (detector-on time) | Marked lightcurve |
|---|---|---|---|---|---|---|---|
| A | 8258 | 7688 | 1 | 1 | 0.01% | 0.01% | 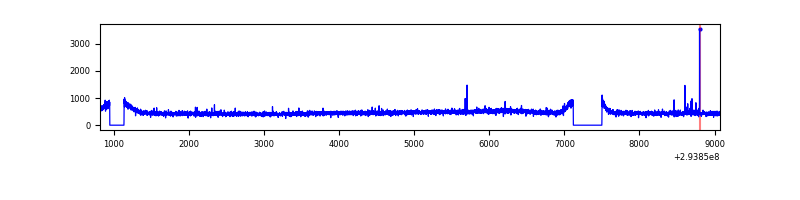 |
| B | 8259 | 7689 | 1 | 1 | 0.01% | 0.01% | 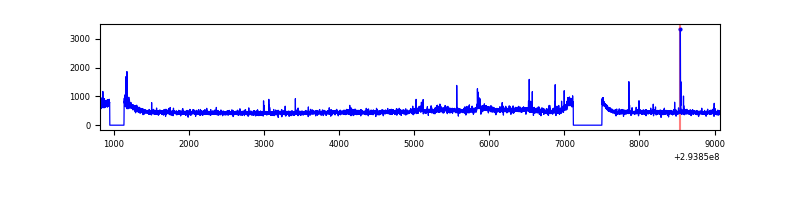 |
| C | 8259 | 7689 | 14 | 14 | 0.17% | 0.18% | 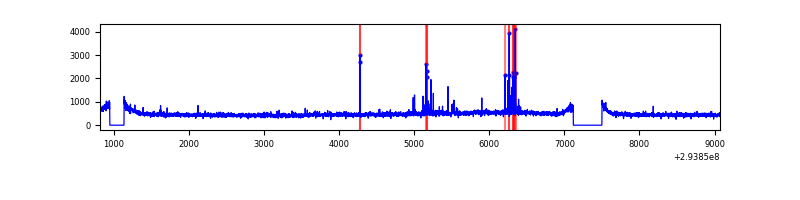 |
| D | 8259 | 7688 | 2910 | 2910 | 35.23% | 37.85% | 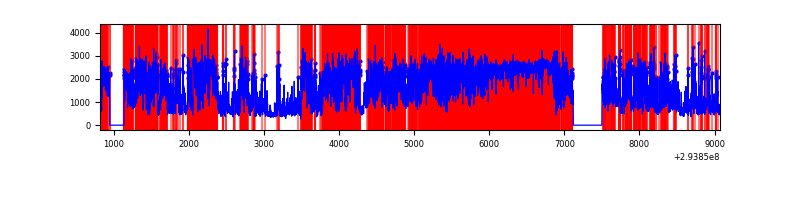 |
Top three noisy pixels from each quadrant. If the there are fewer than three noisy pixels in the level2.evt file, extra rows are filled as -1
| Pixel properties | Quadrant properties | ||||||
|---|---|---|---|---|---|---|---|
| Quadrant | DetID | PixID | Counts | Sigma | Mean | Median | Sigma |
| A | 11 | 29 | 22247 | 112.58 | 924 | 904 | 189.6 |
| A | 5 | 16 | 13757 | 67.79 | 924 | 904 | 189.6 |
| A | 13 | 254 | 8880 | 42.07 | 924 | 904 | 189.6 |
| B | 0 | 229 | 27901 | 151.87 | 921 | 896 | 177.8 |
| B | 0 | 198 | 24778 | 134.31 | 921 | 896 | 177.8 |
| B | 12 | 111 | 22110 | 119.3 | 921 | 896 | 177.8 |
| C | 14 | 238 | 136115 | 642.82 | 890 | 896 | 210.4 |
| C | 0 | 207 | 84022 | 395.18 | 890 | 896 | 210.4 |
| C | 3 | 233 | 68907 | 323.32 | 890 | 896 | 210.4 |
| D | 10 | 66 | 6377621 | 35999.25 | 726 | 705 | 177.1 |
| D | 7 | 238 | 1858246 | 10486.27 | 726 | 705 | 177.1 |
| D | 1 | 52 | 828853 | 4675.1 | 726 | 705 | 177.1 |
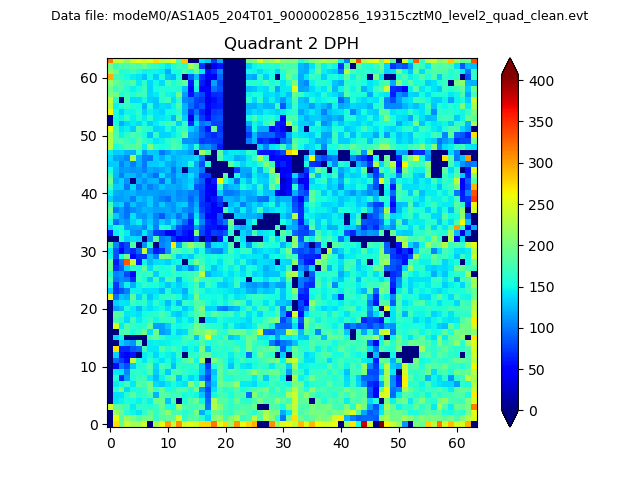
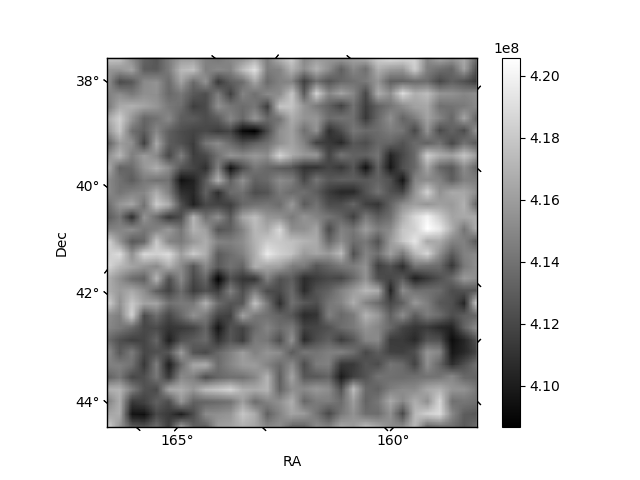
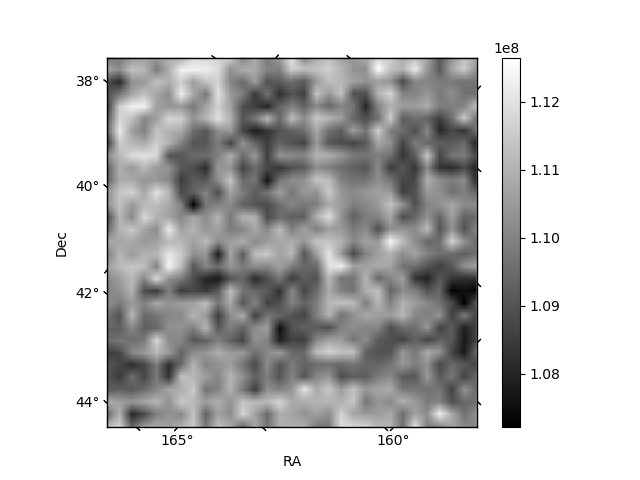
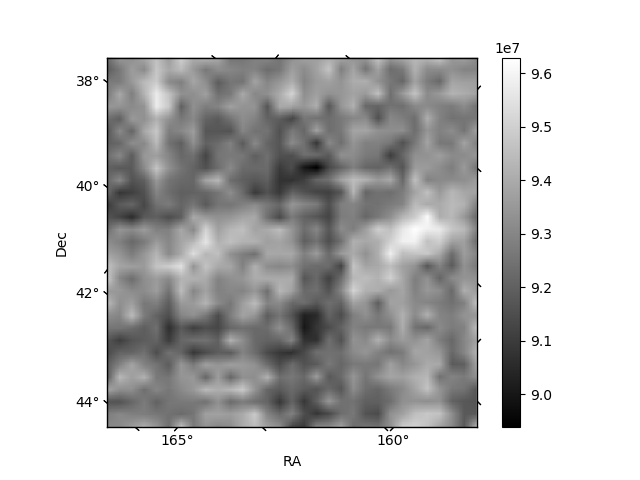
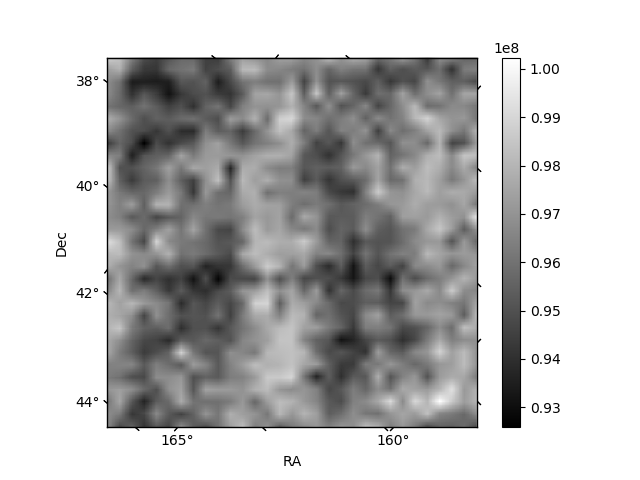
Histogram calculated using DETX and DETY for each event in the final _common_clean file
| Quadrant A | 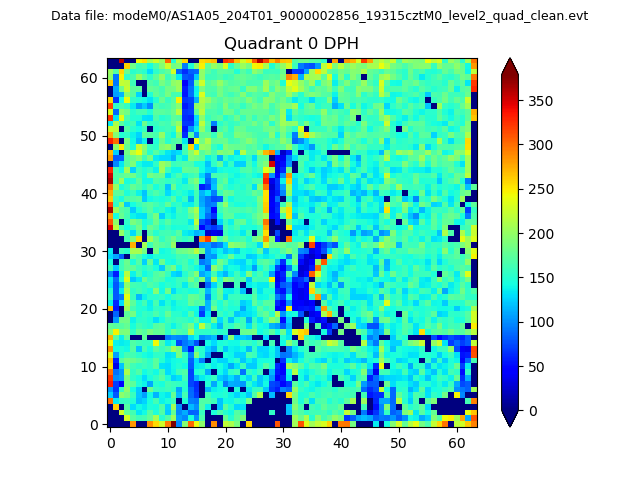 |
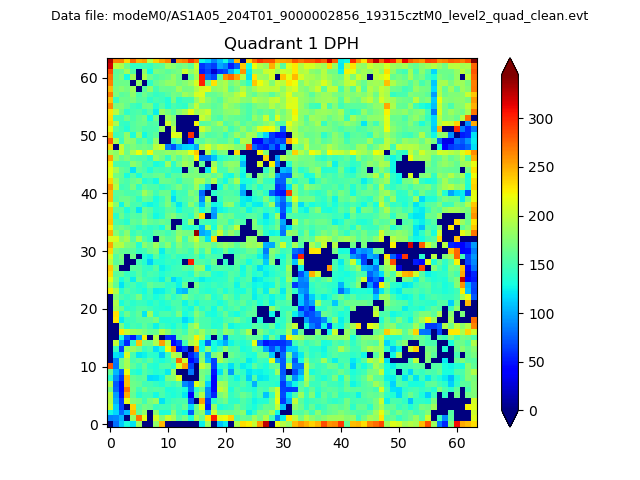 |
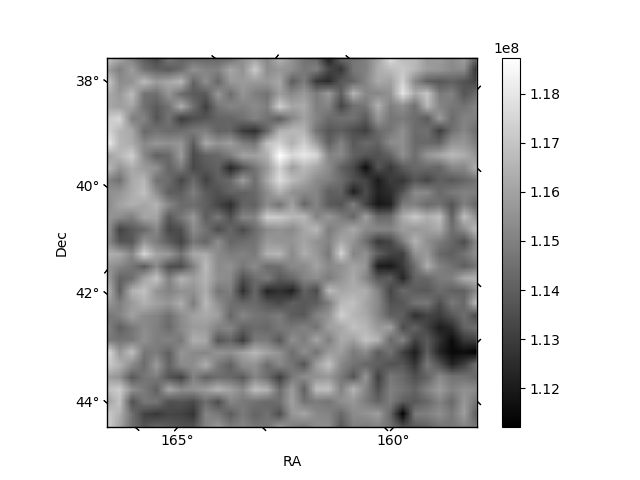
Quadrant B |
|---|---|---|---|
| Quadrant D | 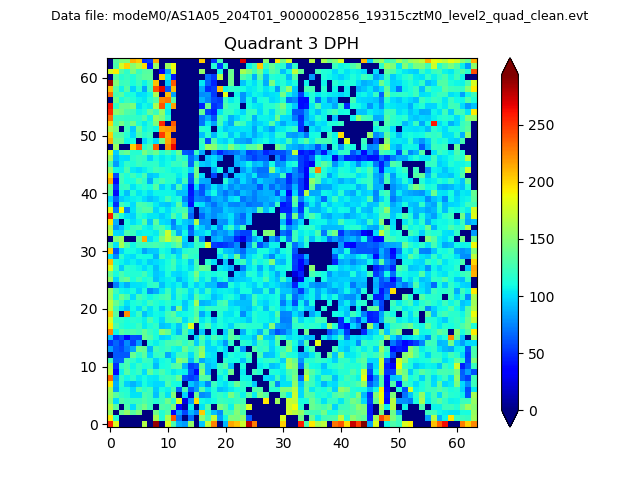 |
 |
Quadrant C |
| Plot type | Count rate plots | Images |
|---|---|---|
| Comparison with Poisson distribution Blue bars denote a histogram of data divided into 1 sec bins. Red curve is a Poisson curve with rate = median count rate of data. |
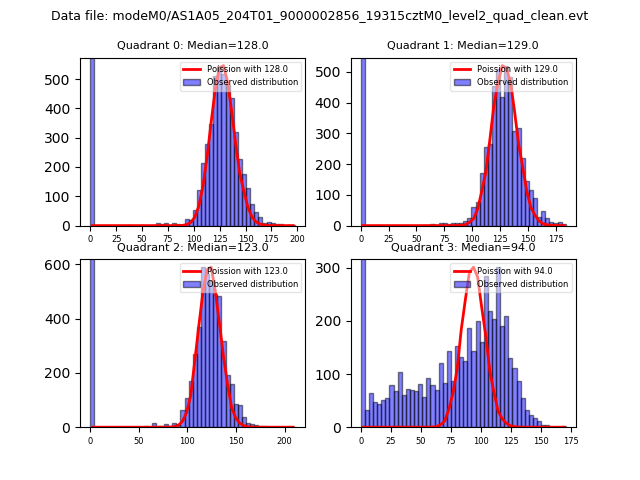 |
 |
| Quadrant-wise count rates Data is divided into 100 sec bins |
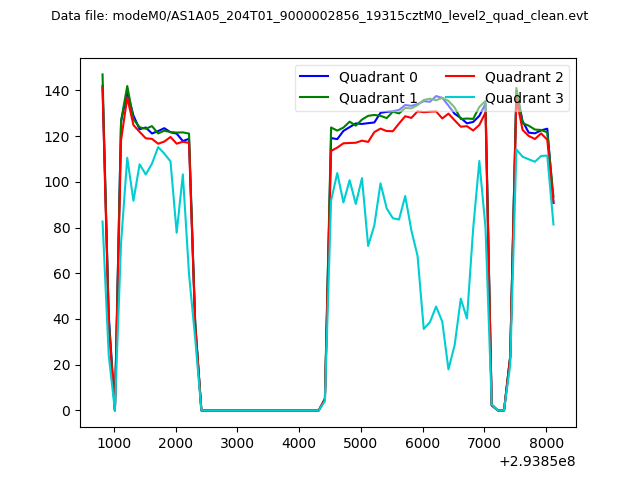 |
|
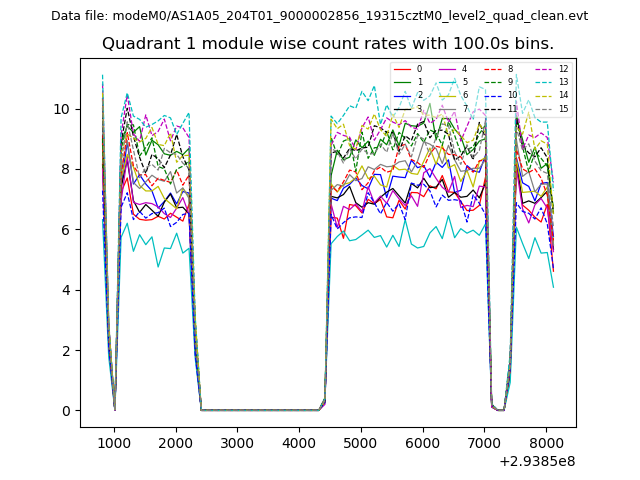
| Module-wise count rates for Quadrant A Data is divided into 100 sec bins |
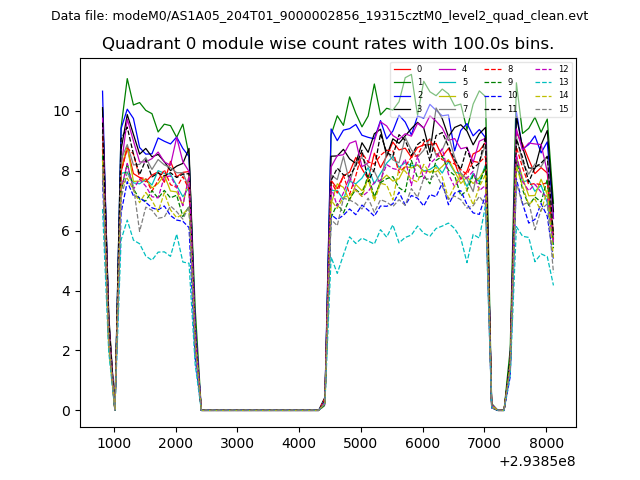 |
 |
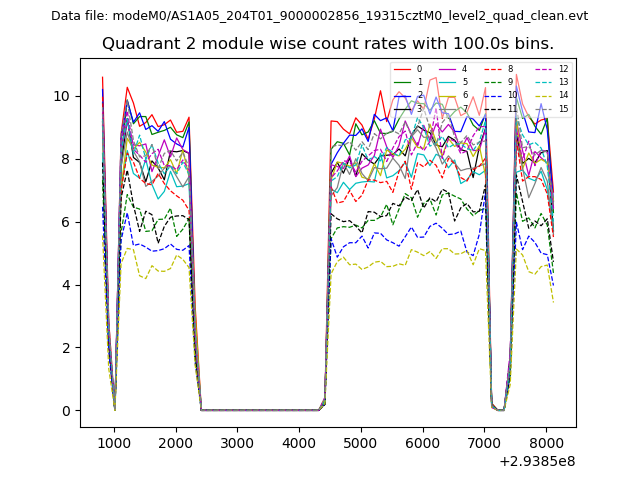
| Module-wise count rates for Quadrant B Data is divided into 100 sec bins |
 |
 |
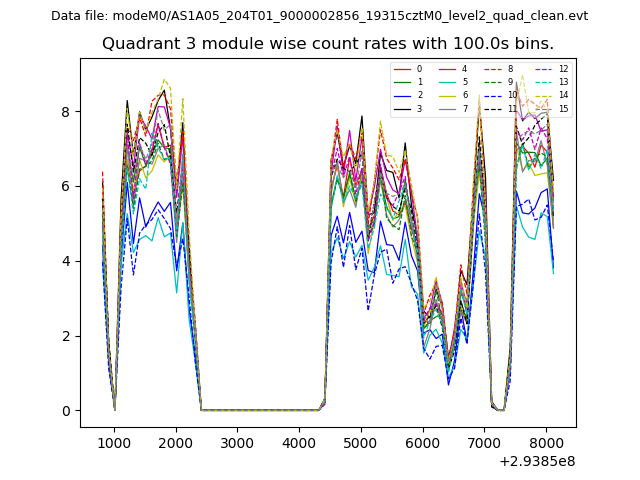
| Module-wise count rates for Quadrant C Data is divided into 100 sec bins |
 |
 |
| Module-wise count rates for Quadrant D Data is divided into 100 sec bins |
 |
 |
| Parameter | Plot |
|---|---|
| CZT HV Monitor | 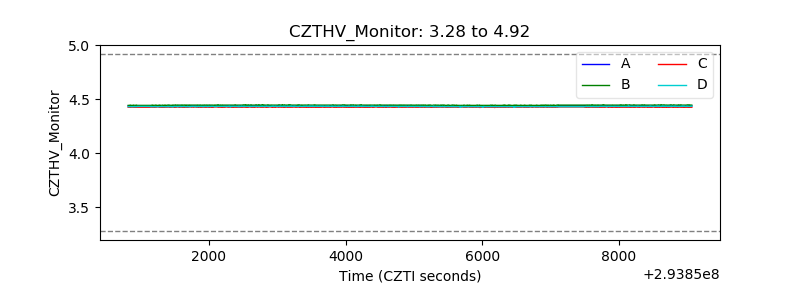 |
| D_VDD | 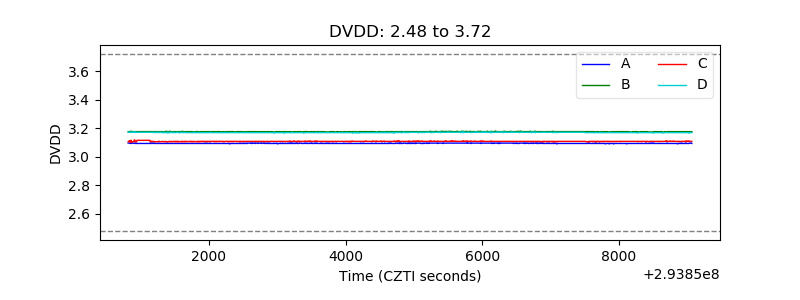 |
| Temperature 1 |  |
| Veto HV Monitor | 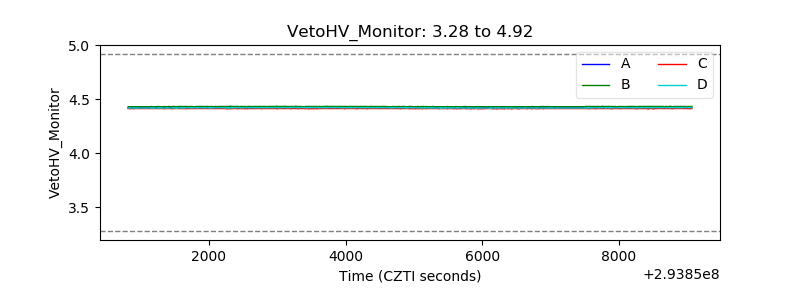 |
| Veto LLD | 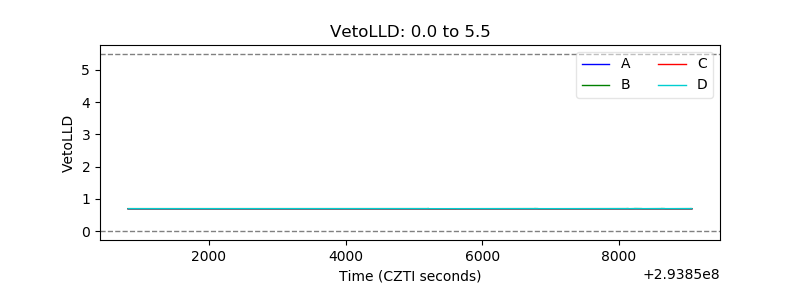 |
| Alpha Counter | 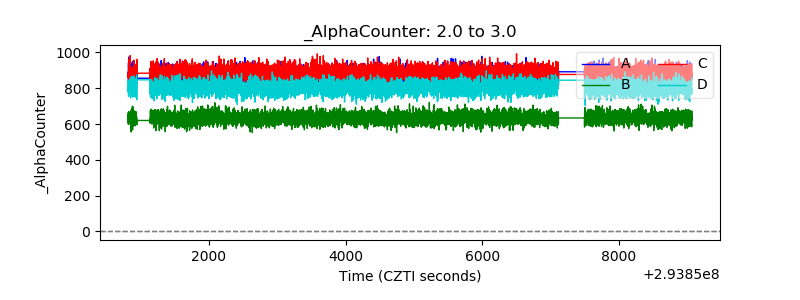 |
| _CPM_Rate | 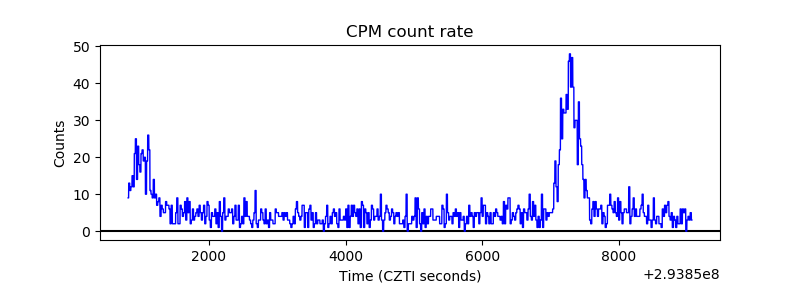 |
| CZT Counter | 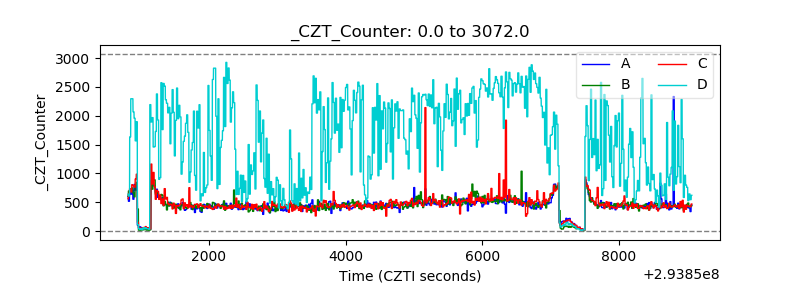 |
| +2.5 Volts monitor |  |
| +5 Volts monitor |  |
| _ROLL_ROT | 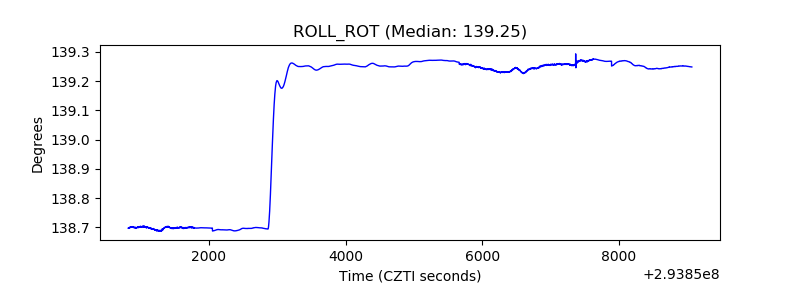 |
| _Roll_DEC |  |
| _Roll_RA | 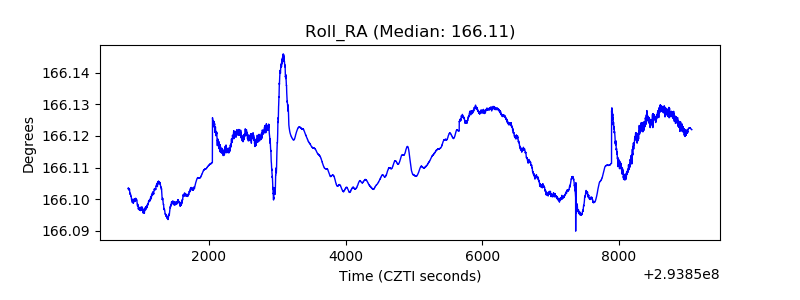 |
| Veto Counter | 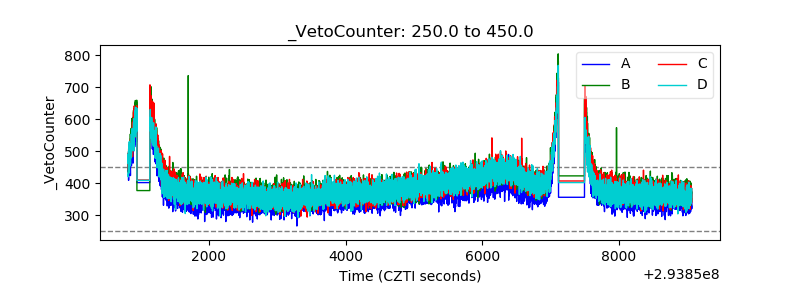 |